Methanol formation via oxygen insertion chemistry in ices
Abstract
We present experimental constraints on the insertion of oxygen atoms into methane to form methanol in astrophysical ice analogs. In gas-phase and theoretical studies this process has previously been demonstrated to have a very low or non-existent energy barrier, but the energetics and mechanisms have not yet been characterized in the solid state. We use a deuterium UV lamp filtered by a sapphire window to selectively dissociate O2 within a mixture of O2:CH4 and observe efficient production of CH3OH via O(1D) insertion. CH3OH growth curves are fit with a kinetic model, and we observe no temperature dependence of the reaction rate constant at temperatures below the oxygen desorption temperature of 25K. Through an analysis of side products we determine the branching ratio of ice-phase oxygen insertion into CH4: 65% of insertions lead to CH3OH with the remainder leading instead to H2CO formation. There is no evidence for CH3 or OH radical formation, indicating that the fragmentation is not an important channel and that insertions typically lead to increased chemical complexity. CH3OH formation from O2 and CH4 diluted in a CO-dominated ice similarly shows no temperature dependence, consistent with expectations that insertion proceeds with a small or non-existent barrier. Oxygen insertion chemistry in ices should therefore be efficient under low-temperature ISM-like conditions, and could provide an important channel to complex organic molecule formation on grain surfaces in cold interstellar regions such as cloud cores and protoplanetary disk midplanes.
1 Introduction
Complex organic molecules (COMs) have been detected towards star-forming regions at all stages of evolution, including molecular clouds, protostellar hot cores, envelopes, and outflows, and protoplanetary disks (e.g. Blake et al., 1987; Bottinelli et al., 2004; Arce et al., 2008; Öberg et al., 2010, 2015). It is of great interest to understand the rich chemistry that feeds the formation and destruction of these molecules in the interstellar medium (ISM) in order to constrain the chemical inventories available for pre-biotic chemistry as solar systems develop. To explain COM production, current astrochemical models typically rely on grain-surface radical recombination chemistry that becomes active in lukewarm (30K) ices (Garrod et al., 2008; Herbst & van Dishoeck, 2009). However, observations of COMs towards very cold interstellar environments such as pre-stellar cores (Öberg et al., 2010; Bacmann et al., 2012; Cernicharo et al., 2012, e.g.) indicate that a cold pathway to complex molecule formation must also be active.
A central challenge to building chemical complexity at low temperatures is the incorporation of several heavy elements into molecules. To address this, many experimental studies have focused on the hydrogenation of unsaturated oxygen-bearing molecules. Repeated hydrogenation of CO has been shown to be efficient and leads to the production of the stable molecules H2CO and CH3OH (Watanabe & Kouchi, 2002; Fuchs et al., 2009):
| (1) |
In addition, H atom bombardment of CO ices has been recently shown to form even more complex molecules: H atom abstractions along the CO hydrogenation pathway (1) lead to enhanced populations of radical species, which can recombine to form larger COMs (Fedoseev et al., 2015; Chuang et al., 2016). However, this recombination chemistry requires diffusion of relatively heavy radical species, which in interstellar ices are not expected to be mobile at low temperatures.
Here, we present experiments demonstrating an oxygen insertion mechanism as an alternative pathway to COM formation at low temperatures, using the test case of CH3OH formation from O insertion into CH4. Unlike radical recombination pathways, oxygen insertion does not require diffusion of heavy species. The ability to convert hydrocarbons directly to COMs represents a novel channel to explain observed COM abundances.
The gas-phase insertion of excited O(1D) into CH4 has been well-studied: initially, vibrationally excited CH3OH is formed, and at sufficiently high pressures can be collisionally stabilized; otherwise, the molecule fragments into the radical products CH3 + OH (DeMore & Raper, 1967; Lin & DeMore, 1973). In the gas phase, therefore, insertions are typically net destructive and lead to smaller rather than larger molecules. Gas-phase oxygen insertion has been shown experimentally to be essentially barrierless (e.g. DeMore & Raper, 1967), and indeed theoretical studies suggest a small 280K barrier (Yu & Muckerman, 2004).
Oxygen insertion has also been qualitatively demonstrated in condensed systems. In Appelman et al. (1989), HOF was photolyzed within a CH4 matrix under high vacuum (10-7 Torr) conditions. Parnis et al. (1993) and Lugez et al. (1994) both studied oxygen insertion into CH4 within Ar matrices, using photolysis of N2O and O3 respectively for O(1D) atom generation. Each of these studies qualitatively demonstrated CH3OH formation via oxygen insertion in the solid state. However, to date there is no quantitative or mechanistic description of this process. Moreover, the ice compositions in these previous studies are not astrophysically realistic. In order to evaluate the extent to which oxygen insertion can lead to chemical complexity in the ISM, a detailed understanding of how this process occurs in astrophysical ice analogs is required. In particular, it is essential to determine the energetic feasibility under ISM-like conditions, and the efficiency of CH3OH formation compared to fragmentation and other product formation.
O(1D) atoms, which are required for this insertion process, are in the first electronically excited state with energies 2eV higher than the ground state O(3P). O(1D) production has been demonstrated by UV photolysis of a number of molecules which should be abundant in interstellar ice mantles, including O2, CO2, O3, and H2O, as well as electron impact of O2 and CO2 (Lee et al., 1977; Slanger & Black, 1971; DeMore & Raper, 1966; Stief et al., 1975; Cosby, 1993; Kedzierski et al., 2013). CO2 and H2O are of particular importance, as H2O is the main constituent of interstellar ices and CO2 is typically present at abundances of 10-30% with respect to H2O (Öberg et al., 2011). Photolysis of CO2 follows the dissociation channel to O(1D) + CO() between 120nm and 170nm, with measured efficiencies of 94% and 100% at 157nm and 147nm respectively (Zhu & Gordon, 1990; Slanger & Black, 1971). From 105nm-145nm, H2O dissociates to H2 + O(1D) with an efficiency of 10% (Ung, 1974; Stief et al., 1975; Slanger & Black, 1982). Importantly, for both CO2 and H2O, O(1D) can be generated upon exposure to Lyman- irradiation (121.6nm), which dominates the UV spectrum in cloud cores and protoplanetary disks (e.g. Öberg, 2016). Therefore, dissociation of common oxygen-bearing molecules in ice mantles should produce these excited oxygen atoms, which may then insert into neighboring hydrocarbons within the ice.
To assess the energetics and mechanism of this reaction scheme in astrophysical ice analogs, we selectively dissociate O2 within mixed O2:CH4 ices and O2:CH4:CO ices. In Section 2, we describe the experimental apparatus and procedures. Section 3 details the data analysis techniques used, and Section 4 presents the results. In Section 5 we discuss the reaction network and mechanisms in this system, as well as the astrophysical implications of this process.
2 Experimental Details
We use the ulta-high vacuum experiment described in detail in Lauck et al. (2015). The chamber is evacuated to a base pressure of 5 x 10⁻¹⁰ Torr. A closed-cycle He cryostat cools a CsI substrate window to temperatures as low as 9K. Temperature is monitored by a temperature controller (LakeShore 335) with an estimated accuracy of 2K and a relative uncertainty of 0.1K. Ices are typically grown on the substrate by introduction of gases through a 4.8mm diameter dosing pipe at 0.7 inches from the substrate. For co-deposition experiments, two separate dosing pipes at 1.2 inches from the substrate were used to introduce gases. Experiments were performed using the following gases: CH4 (99.9% purity, Aldrich), 13CH4 (99%, Aldrich), CD4 (99%, Aldrich), 16O2 (99.98%, Aldrich), 18O2 (97%, Aldrich), Ar (99.95%, Aldrich), and CO (99.95%, Aldrich). To obtain mixtures, gases were combined in a differentially pumped gas line with a base pressure 10-4 Torr. A Fourier transform infrared spectrometer (Bruker Vertex 70v) in transmission mode was used to measure infrared-active molecules in the ice. A quadrupole mass spectrometer (Pfeiffer QMG 220M1) continuously monitored the gas-phase species present in the chamber.
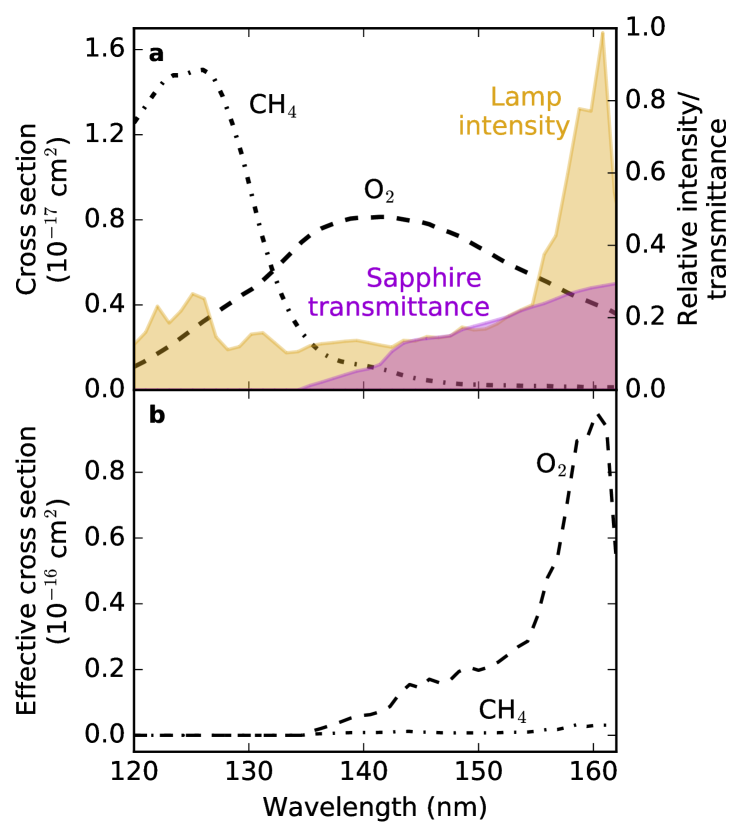
To selectively dissociate O2 within a CH4:O2 mixture, we irradiate the ice samples with a H2D2 lamp (Hamamatsu L11798) filtered by a 0.08” thick sapphire window (MPF Products, Inc.) Figure 1a shows the spectral distribution of the UV lamp overlaid with the transmittance spectrum of sapphire with a similar thickness111http://resources.montanainstruments.com/help/window-materials and the UV absorption cross-sections for both CH4 and O2 (Cruz-Diaz et al., 2014b). The convolution of lamp intensity, sapphire transmittance, and absorption cross-section for each species is shown as the “effective” cross-section in Figure 1b. This represents the relative absorption of each molecule under the irradiation conditions of the present experiment. The absorption of CH4 is negligible due to the cutoff of the sapphire window, while O2 still has a large absorption profile which is dominated by the 160.8nm Lyman band of the H2D2 lamp. The photoproducts of O2 in this wavelength regime are well-characterized: upon exposure to light at wavelengths from 140-175nm, O2 dissociates into O(3P) + O(1D) with an efficiency of unity (Lee et al., 1977).
All experimental details are summarized in Table 1. We define different groups of experiments, each varying with respect to the Fiducial category as indicated: (I- Fiducial) 16O2:13CH4 1.4:1, 50ML total ice thickness; (II) 20ML thickness; (III) 0.2:1 ratio; (IV) capping layer of argon; (V) 90ML thickness; (VI): 12CD4:18O2; (VII) other isotopologues (qualitative analysis only); (VIII) CO:13CH4:16O2 4:1:1, 125ML thickness; (IX): CO:13CH4:16O2 7:1:1, 170ML thickness; (X): control experiments- only 1 reactant.
The experimental procedure for groups I-VII involved a single deposition of a mixture of CH4 and O2; for groups VIII and IX, separate dosing tubes were used to co-deposit CO and a CH4:O2 mixture. In all cases, dosing was performed at 9K, followed by a 2 hour sample irradiation at a set temperature at an angle of 45o by the H2D2 lamp. During irradiation, IR scans were taken every 3 minutes. Following irradiation, a temperature programmed desorption (TPD) was performed by ramping the sample temperature at a rate of 2K/min to 200K. During the temperature ramp, IR scans were taken every 2 minutes and desorbing species were monitored with the QMS.
| Experiment | Group | Irradiation | Ice composition | Ratio | Total thickness |
|---|---|---|---|---|---|
| temp (K) | (ML) | ||||
| 1 | I | 9 | 16O2 : 13CH4 | 1.3 : 1 | 53 |
| 2 | I | 9 | 16O2 : 13CH4 | 1.8 : 1 | 52 |
| 3 | I | 14 | 16O2 : 13CH4 | 1.4 : 1 | 53 |
| 4 | I | 19 | 16O2 : 13CH4 | 1.3 : 1 | 51 |
| 5 | I | 24 | 16O2 : 13CH4 | 1.4 : 1 | 50 |
| 6 | I | 25 | 16O2 : 13CH4 | 1.4 : 1 | 54 |
| 7 | II | 9 | 16O2 : 13CH4 | 0.9 : 1 | 18 |
| 8 | II | 14 | 16O2 : 13CH4 | 1.6 : 1 | 23 |
| 9 | II | 19 | 16O2 : 13CH4 | 1.3 : 1 | 19 |
| 10 | III | 9 | 16O2 : 13CH4 | 0.2 : 1 | 26 |
| 11 | III | 19 | 16O2 : 13CH4 | 0.2 : 1 | 23 |
| 12 | III | 24 | 16O2 : 13CH4 | 0.2 : 1 | 23 |
| 13aawith Ar top layer | IV | 9 | 16O2 : 13CH4 | 1.2 : 1 | 38 |
| 14 | V | 9 | 16O2 : 13CH4 | 1.6 : 1 | 92 |
| 15 | V | 9 | 16O2 : 13CH4 | 1.6 : 1 | 87 |
| 16aawith Ar top layer | VI | 9 | 18O2 : 12CD4 | 1.5 : 1 | 37 |
| 17 | VI | 9 | 18O2 : 12CD4 | 1.9 : 1 | 66 |
| 18 | VI | 19 | 18O2 : 12CD4 | 1.7 : 1 | 59 |
| 19aawith Ar top layer | VII | 9 | 18O2 : 13CH4 | 0.8 : 1 | 32 |
| 20 | VII | 9 | 16O2 : 12CH4 | 1.5 : 1 | 55 |
| 21 | VIII | 9 | 12CO : 16O2 : 13CH4 | 4.3 : 1.1 : 1 | 125 |
| 22 | VIII | 19 | 12CO : 16O2 : 13CH4 | 4.5 : 1.1 : 1 | 127 |
| 23 | VIII | 19 | 12CO : 16O2 : 13CH4 | 4.4 : 1.1 : 1 | 125 |
| 24 | IX | 9 | 12CO : 16O2 : 13CH4 | 6.9 : 1.0 : 1 | 172 |
| 25 | IX | 14 | 12CO : 16O2 : 13CH4 | 6.8 : 1.0 : 1 | 172 |
| 26 | IX | 19 | 12CO : 16O2 : 13CH4 | 7.0 : 1.0 : 1 | 174 |
| 27 | X | 9 | 13CH4 | - | 15 |
| 28 | X | 9 | 16O2 | - | 23 |
3 Data analysis
3.1 O2 thickness determination
Since O2 is infrared inactive, we quantify the O2 dose by calibrating the time-integrated QMS signal to the IR-determined CH4 dose as in Fayolle et al. (2013):
| (2) |
Here, is the column density of species , is the time-integrated QMS intensity of each molecule’s dominant ion, and is the gas-phase electron impact ionization cross-section of each molecular ion at 70eV. The QMS mass signals 17, 20, 32, and 36 are used to trace 13CH4, CD4, 16O2, and 18O2 respectively; these masses should not be contaminated by signal from any other molecule. O2 and CH4 cross-sections are taken from Straub et al. (1996) and Straub et al. (1997) respectively. The average value of from all experiments was used to convert to O2 doses; based on variations between experiments, we expect an O2 dose uncertainty of about 30%. The CH4 thickness uncertainty is 20%, arising mainly due to the uncertainty in band strength.
3.2 UV flux
The photon flux from the UV lamp was measured with a NIST calibrated AXUV-100G photo-diode at the sample holder to be 1.4 x 10¹³ photons cm-2 s-1, with a measurement uncertainty of 5% for the wavelengths of interest in this work. For a 2-hour irradiation, this results in a total fluence of 1 x 1017 cm-2. To ensure that UV photons penetrate the entire ice sample, we calculate the attenuation of photons for experiments of different ice thickness. The photon attenuation is calculated at 160.8nm, since this represents the peak of the “effective” cross-section (Section 2), using the formula
| (3) |
where is the column density of molecule X (molecule cm-2), is the UV absorption cross-section, and and are the transmitted and incident intensities, respectively. We assume the standard monolayer coverage of 1015 molecules cm-2 and cross-sections = 3.9x10⁻¹⁸ cm2 and = 0.9x10⁻¹⁸ cm2 (Cruz-Diaz et al., 2014a, b). For O2 ice, 15, 35, and 65ML will absorb 6%, 13%, and 22% of photons respectively. For CO ice, 85 and 135ML will absorb 7% and 11% of photons respectively. Therefore, photon attenuation is small and should not impact the experimental results even for the thickest O2 and CO ices.
3.3 IR spectra and growth curves
IR spectra were used to determine the initial ice column densities of CH4 as well as the growth of products during irradiation. Each spectrum is averaged over 128 interferograms and takes approximately 2 minutes to complete. Column densities of each species were calculated using the integrated area of IR features:
| (4) |
where is column density (molecule cm-2), is the integrated area of the IR band (absorbance units), and is the band strength in optical depth units. The standard monolayer coverage of 1015 molecules cm-2 was assumed.
| Molecule | Mode | Line center (cm-1) | ||
|---|---|---|---|---|
| (13C/16O/H) | (12C/18O/D) | (cm molec-1) | ||
| CH4 | bend | 1291 | 989 | 8.4 x 10⁻¹⁸ () |
| CH3OH | CO str | 1008 | 952 | 1.8 x 10⁻¹⁷ () |
| O3 | a-str | 1034 | 975 | 8.8 x 10⁻¹⁸ () |
| CO | str | 2092 | 1.1 x 10⁻¹⁷ () | |
| CO2 | a-str | 2276 | 1.3 x 10⁻¹⁶ () | |
| H2CO | CO str | 1683 | 9.6 x 10⁻¹⁸ () | |
| CH2 sc. | 1498 | 3.9 x 10⁻¹⁸ () | ||
| H2O | bend | 1652 | 1.1 x 10⁻¹⁷ () | |
Product growth curves can only be measured for 13CH4:16O2 and 12CD4:18O2 mixtures (Groups I-VI and VIII-IX), as other isotopologue combinations have overlapping O3 and CH3OH infrared features. IR band centers and strengths used for quantifying molecule abundances are listed in Table 2.
O3 column densities are highly uncertain since only RAIRS band strengths were available in the literature. However, absolute O3 measurements are not required for quantifying the reaction between O atoms and CH4. To estimate the ozone abundance, we assume that the ratio between RAIRS and transmission band strengths is consistent within an experiment (e.g. Ioppolo et al., 2008). We therefore scale the RAIRS band strength of O3 reported in Loeffler et al. (2006) by the ratio of the transmission and RAIRS band strengths for the H2O bending mode (1.4; Bouilloud et al., 2015; Loeffler et al., 2006).
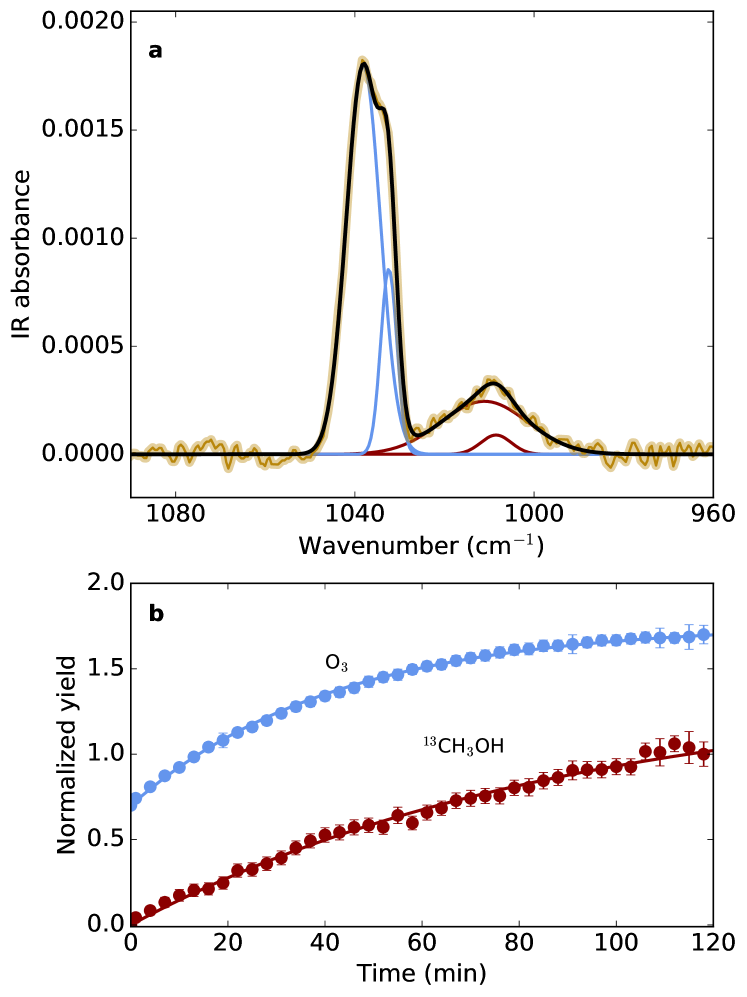
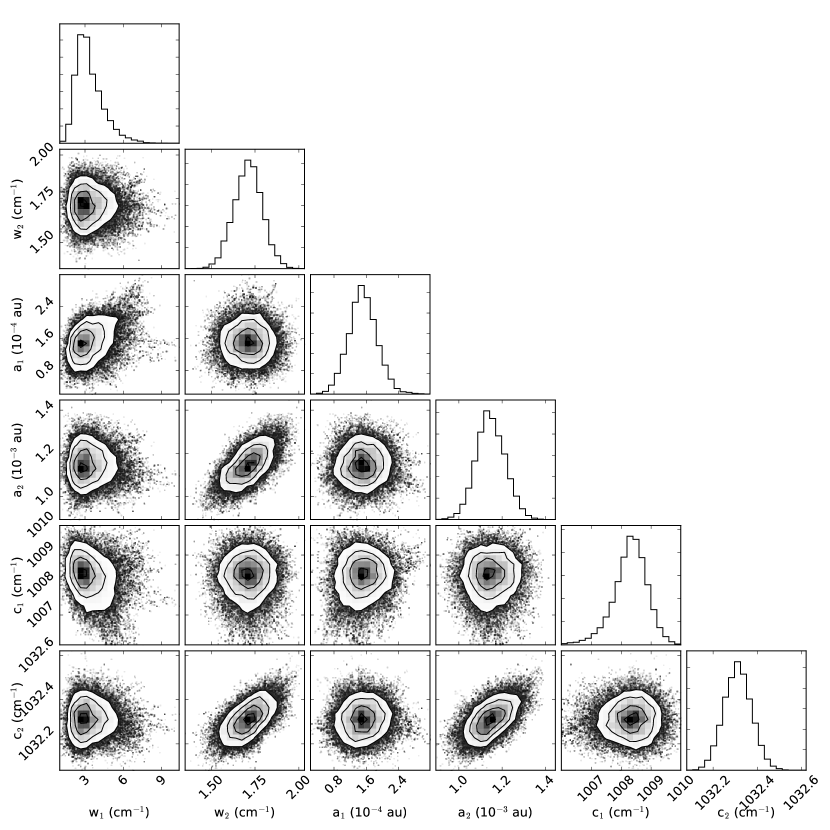
For CH3OH, the direct product of O insertion into CH4, the strongest feature is the band. Due to the proximity of the O3 band, both features were fit simultaneously with Gaussian profiles. Each feature is well-fit by a double Guassian; thus, for each spectrum we fit four Gaussians as seen in Figure 2a. Fitting is done using the python package (Foreman-Mackey et al., 2013). In addition to the four Gaussian profiles, we simultaneously fit a local linear baseline term as part of the overall fit. This enables us to incorporate any uncertainties that arise from the choice of baseline into subsequent analysis. Figure 9 in Appendix A shows an example corner plot displaying the degree of parameter covariance as well as the fit convergence.
3.4 Kinetic modeling
The reaction steps leading to methanol formation are:
| (5) | |||
| (6) |
where kpd is the photodissociation rate of O2 and is the rate of oxygen insertion to form methanol. In addition to formation via O insertion, CH3OH can also be photo-dissociated by UV light in this wavelength range. To account for potential CH3OH loss we include a destruction term in the kinetic model:
| (7) |
As detailed in previous work, there are numerous possible products of CH3OH processing (Bennett et al., 2007; Öberg et al., 2009). For the purposes of fitting growth curves, we are mainly interested in the loss of CH3OH, and discuss the potential formation of other products in more detail in Section 4. We note that CH3OH could also be consumed by other mechanisms such as H abstractions, however we assume that photodissociation is the dominant destruction mechanism. Incorporating other pathways would require modeling the entire system simultaneously, which is not practical given difficulties in measuring column densities of each product throughout the experiment.
From Reactions 6 and 7 we obtain the integrated rate law describing CH3OH formation:
| (8) |
where Nss is a proportionality factor representing the steady-state abundance. We have assumed that the timescales of O(1D) atom formation and destruction are much faster than the reaction timescale, and therefore the photodissociation kinetics of O2 (Reaction 5) do not contribute to the overall growth rate. Indeed, typical CH3OH formation rates are on the order of 10-4ML s-1, while the timescale for O formation ( x x N) is an order of magnitude faster, and the rate constant for O(1D) relaxation to O(3P) in solids is on the order of 1 s-1 (Mohammed, 1990).
For fitting Equation 8 to growth curves, we assume that the rate constant for photodestruction of CH3OH is equal to that of photon absorption, or x . is taken from Cruz-Diaz et al. (2014a) to be 2.9 x 10⁻¹⁸ cm2 at 160.8nm for a total absorption rate = 4.1 x 10⁻⁵ s-1 = . An example fit is shown in Figure 2b for 13CH3OH and O3 growth curves during the irradiation of a 13CH4:16O2 ice mixture (Experiment 3). The fits are very good, indicating that this model is indeed appropriate and that no additional parameters are required to describe the kinetics. Growth curves along with best-fit kinetic models for all other experiments are shown in Appendix B.
4 Results
4.1 Proof of concept: CH3OH production
During irradiation of 13CH4:16O2 mixtures, 13CH3OH formation is observed in situ by the growth of the infrared band at 1008 cm-1. Figure 3a shows this feature in the spectrum of pure 13CH3OH. The band is not formed during irradiation of pure 13CH4 or pure 16O2, but does grow during irradiation of a mixture of 13CH4:16O2. The growth of 16O3 can also be seen in the pure 16O2 and mixed 13CH4:16O2 experiments.
Figure 3b and c show results from the TPD following sample irradiation. In Figure 3b, the QMS trace for 33, which corresponds to the mass of 13CH3OH, is observed for the mixed irradiated sample. Desorption occurs around 140K, as in the 13CH3OH standard. No 33 signal is observed for either of the pure control experiments. Figure 3c shows the integrated IR band area around 1008cm-1 during the temperature ramp. Again, in the mixed irradiated experiment, the band disappears around 140K and matches well with the 13CH3OH standard.
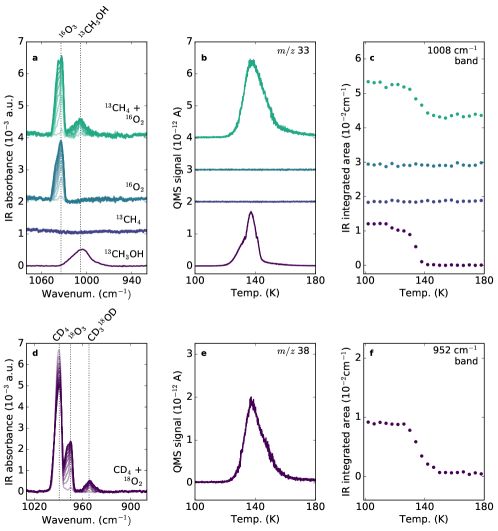
Mixtures of CD4:18O2 similarly demonstrated growth of CDOD. A standard was not commercially available, however we identify the band at 952cm-1 as CDOD based on its similar growth to 13CH3OH during irradiation (Figure 3d). Furthermore, 38 corresponding to CDOD desorbs around 140K coincident with the depletion of the IR band at 952cm-1(Figure 3e and f). We therefore confirm the O insertion behavior in two isotopologue systems; based on these different lines of evidence, CH3OH is produced during the irradiation of CH4:O2 mixtures.
| Expt. | (ML) | (s-1) |
|---|---|---|
| 1 | 3.5 [0.4] | 1.1 [0.1] x 10-4 |
| 2 | 3.0 [0.5] | 1.0 [0.2] x 10-4 |
| 3 | 4.9 [1.0] | 6.3 [1.3] x 10-5 |
| 4 | 3.1 [0.3] | 1.2 [0.2] x 10-4 |
| 5 | 3.8 [0.7] | 8.0 [1.5] x 10-5 |
| 6 | 7.1 [1.8] | 4.0 [1.1] x 10-5 |
| 7 | 1.5 [0.4] | 1.2 [0.3] x 10-4 |
| 8 | 0.8 [0.4] | 1.5 [0.4] x 10-4 |
| 9 | 1.1 [0.5] | 1.1 [0.4] x 10-4 |
| 10 | 2.5 [0.6] | 7.5 [1.7] x 10-5 |
| 11 | 1.2 [0.2] | 1.4 [0.3] x 10-4 |
| 12 | 1.0 [0.3] | 1.6 [0.3] x 10-4 |
| 13 | 2.1 [0.2] | 1.5 [0.2] x 10-4 |
| 14 | 3.8 [1.3] | 9.5 [3.4] x 10-5 |
| 15 | 2.8 [0.9] | 1.2 [0.4] x 10-4 |
| 16 | 3.1 [1.5] | 7.1 [3.3] x 10-5 |
| 17 | 7.0 [3.3] | 3.9 [2.1] x 10-5 |
| 18 | 5.7 [2.5] | 5.4 [2.4] x 10-5 |
4.2 O2:CH4 Experiments
4.2.1 Rate constants
To assess the energetics of oxygen insertion into CH4, experiments were performed at 9K, 14K, 19K, 24K, and 25K. As described in Section 3.3, first-order kinetic models with photodissociative loss were used to fit each growth curve. Fits are typically performed for 2 hours of irradiation, however for ices thicker than 30ML fits are performed for 1 hour irradiations since peak overlap between the CH3OH and O3 feature becomes more severe for the higher product column densities. The parameters and Nss for each model are listed in Table 3. The scatter in rate constants from all 13CH4:16O2 experiments performed at 9K was used to estimate uncertainties due to day-to-day systematics. We find a standard deviation of 20% in the rate constant values; for all experiments, this systematics uncertainty was added in quadrature with the growth curve fit errors in order to obtain the final uncertainties on .
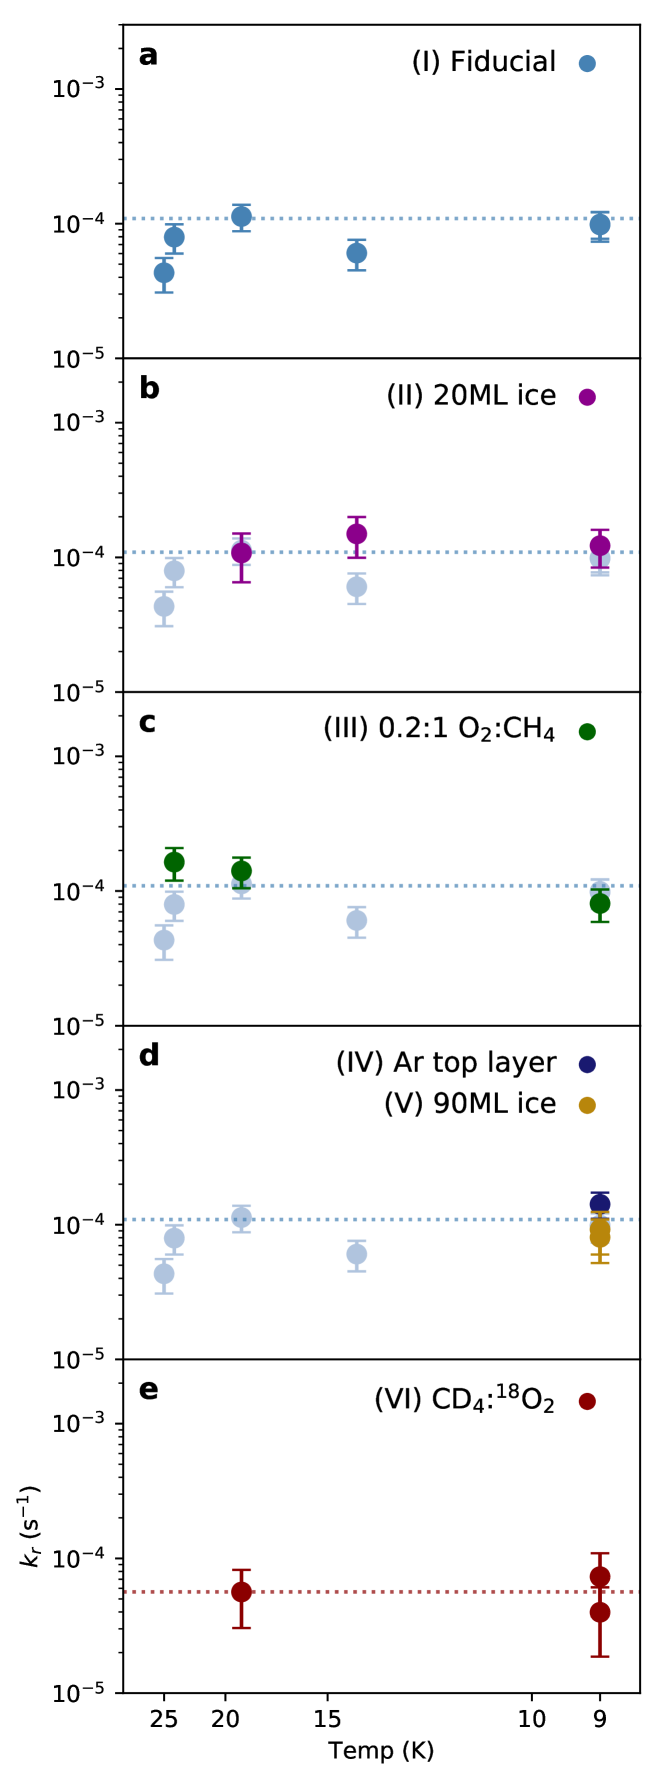
Figure 4 shows Arrhenius plots of the rate constants for different groups of experiments. For all 13CH4:16O2 experiments at temperatures below 25K, there is no temperature dependence to the CH3OH formation rate constant: regardless of the ice thickness, the CH4:O2 ratio, or the presence of an inert capping gas, the value of is consistent around 10-4s-1. The lower rate at 25K is likely due to the onset of oxygen desorption. In experiments of CD4:18O2 the actual rate constants for CDOD production are slightly lower than for 13CH3OH; this could be due to deuterium exchange altering the apparent kinetics, or a difference in zero-point energy impacting the reaction rates. As for 13CH4:16O2 experiments there is no temperature dependence between 9K and 19K, indicating similar underlying energetics for the different isotopologue systems. The lack of temperature dependence on the reaction rate is consistent with expectations from gas-phase and theoretical studies, which demonstrate barrierless or almost barrierless insertion of O(1D) into CH4.
4.2.2 Other products
O3, H2CO, CO, CO2, and H2O are formed during the irradiation in addition to CH3OH. These are identified from their infrared features (Figure 5), which shift as predicted for different isotope combinations. IR line centers used for identification and corresponding references are listed in Table 4.
| Position (cm-1) | Assignment | Reference | Position (cm-1) | Assignment | Reference |
|---|---|---|---|---|---|
| 13CH4 + 16O2 | 13CH4 + 18O2 | ||||
| 3000 | 13CH4 | a | 3000 | 13CH4 | a |
| 2825 | 13CH3OH | a | 2807 | 13CH4 | a |
| 2807 | 13CH4 | a | 2240 | 13C18O2 | e |
| 2276 | 13CO2 | b | 2039 | 13C18O | f |
| 2092 | 13CO | b | 1652 | HC18O | g |
| 1683 | HCO | c* | 1645 | HO | h* |
| 1652 | H2O | b | 1291 | 13CH4 | a |
| 1498 | HCO | c* | 979 | 18O3 | d* |
| 1291 | 13CH4 | a | 13CHOH | g | |
| 1034 | O3 | d* | 12CH4 + 16O2 | ||
| 1008 | 13CH3OH | a | 3009 | CH4 | a |
| 12CD4 + 18O2 | 2822 | H2CO | b | ||
| 3237 | CD4 | a | 2815 | CH4 | a |
| 2306 | C18O2 | e | 2341 | CO2 | b |
| 2251 | CD4 | a | 2139 | CO | b |
| 2088 | C18O | f | 1718 | H2CO | b |
| 1631 | D2C18O | g | 1659 | H2O | b |
| 989 | CD4 | a | 1495 | H2CO | b |
| 975 | O3 | d* | 1300 | CH4 | a |
| 952 | CDOD | g | 1033 | O3 | d* |
| CH3OH | b | ||||
Reference spectrum in this work; bbLoeffler et al. (2006); re-scaled from RAIRS valueBouilloud et al. (2015); ccfootnotemark: Kaiser et al. (2015); ddfootnotemark: Schriver-Mazzuoli et al. (1995); eefootnotemark: Du et al. (2011); fffootnotemark: Legay-Sommaire & Legay (1982); ggfootnotemark: Assigned based on shifts from other isotopologues; hhfootnotemark: Zheng et al. (2011)
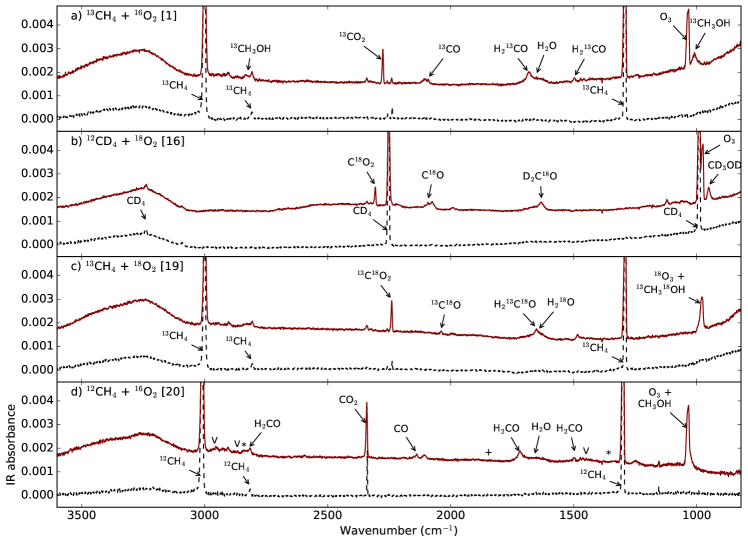
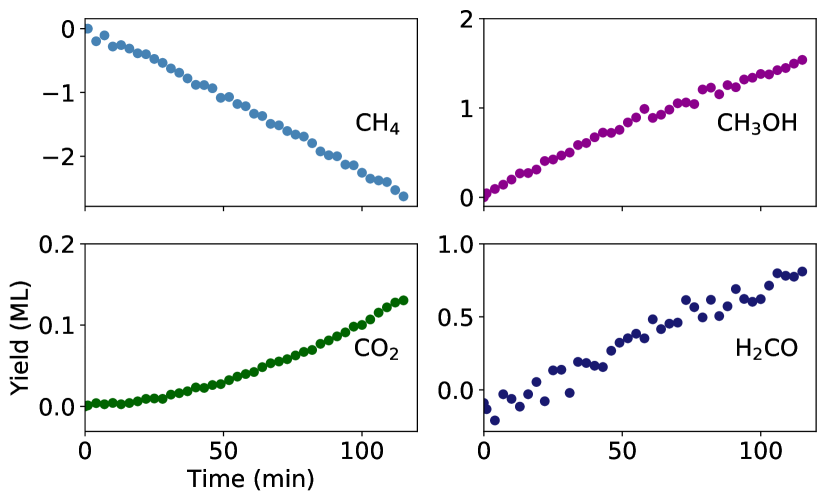
None of the isotopologue combinations result in clean IR features for all products. For unblended features in the 13CH4:16O2 experiments, growth curves can be measured from integrated IR spectra using the band strengths listed in Table 2. An example set of growth curves is shown in Figure 6. CH4 is steadily consumed over the course of the experiment; CH3OH and H2CO growth begins at early times, while CO2 growth accelerates later in the irradiation.
Final yields of all products are calculated from the IR spectrum after 2 hours of irradiation. For products with blended features, yields are estimated as follows. The CO band is blended in 13CH4:16O2 experiments, but not for 13CH4:18O2 and 12CH4:16O2 (Exps. 19 and 20). In both unblended cases the ratio of CO/CO2 is equal to 1.3. Therefore, the CO yield in 13CH4:16O2 experiments is estimated by multiplying the CO2 yield by 1.3. H2O overlaps with the H2CO feature at 1683cm-1. To estimate the H2O yield, the H2CO contribution is calculated based on the area of its 1498cm-1 feature and then subtracted from the integrated area of the entire blended feature.
| CO | CO2 | H2CO | CH3OH | H2O | O3 |
|---|---|---|---|---|---|
| (% wrt CH4 consumed) | (% wrt O2 dose) | ||||
| 6.8 [0.6] | 5.3 [0.5] | 26.3 [8.7] | 60.0 [6.2] | 11.8 [4.5] | 12.7 [1.4] |
Average product yields (Table 5) are calculated from experiments in Groups I, IV, and V, which all have sufficiently large IR features for all molecules to be quantified. Total yields of carbon-bearing products are consistent with the measured consumption of CH4 when considering band strength uncertainties.
4.2.3 Branching ratio
The ratios of carbon-bearing products can be used to derive the branching ratio of O(1D) + CH CH3OH. As seen in Table 5, CH3OH has an average yield of 606% with respect to CH4 consumption. This represents a lower limit to the CH3OH formation efficiency since, as described in Section 3.4, CH3OH is also susceptible to photodissociation. We can calculate the maximum abundance of carbon-bearing derivatives that may be formed from CH3OH photoprocessing using the integrated rate law for product formation by Reaction 7:
| (9) |
where [pr] represents the combined abundance of products from CH3OH destruction. This represents an upper limit on the actual amount of products formed since not every photon absorption is necessarily dissociative. Using the values of and Nss derived from fitting CH3OH growth curves (Table 3), we find an average upper limit of 9.71% photo-products with respect to CH4 consumption after 2 hours.
Assuming that CO and CO2 are daughter species of H2CO processing, the summed abundance of CO, CO2, and H2CO represents the total number of H2CO molecules that are formed over the course of an experiment. Experimentally, the average total abundance of H2CO + CO + CO2 is equal to 389% with respect to CH4 consumption. Therefore, we observe more carbon-bearing side products than can be produced purely through CH3OH photoprocessing. The remaining products are likely formed from the product channel O(1D) + CH4 H2CO + H2. The branching ratio of this channel should be equal to the difference between the observed side products and calculated abundances of photo-products. This value will represent a lower limit since the calculated photoproduct yield is based on the assumption that every photon absorbed by CH3OH is dissociative. We obtain a lower limit for the H2CO channel branching ratio of 299%. Based on this analysis we can therefore bracket the branching ratio of the CH3OH channel between 60-71%, with the lower limit representing a scenario with no CH3OH photodissociation and the upper limit representing the maximum possible CH3OH photodissociation.
Performing this same treatment at other time points, we find that the mean H2CO branching ratio begins small and increases over the irradiation, flattening out to 28-29% after 90 minutes. This is consistent with a scenario in which some H2CO comes directly from O insertion, and some from CH3OH dissociation.
We note that an abstraction pathway of O + CH4 OH + CH3 is a negligible or non-existent channel: if important, there should be considerable amounts of C2H6 and H2O2 from CH3 + CH3 and OH + OH, and we do not detect C2H6 or H2O2 as products. We determine upper limits for each species using Experiment 20 (12CH4:16O2), as band strengths and positions are most reliable for the standard isotopes. The line centers where H2O2 and C2H6 should appear are shown in Figure 5d; qualitatively, it is clear that these are minor species if they are present at all. To determine the C2H6 upper limit, we use the band at 2972cm-1 (2.2 x 10⁻¹⁷cm molec-1; Hudson et al., 2014). We find an upper limit of 0.05ML, or 1.7% with respect to CH4 consumption. Only RAIRS band strengths are available in the literature for H2O2 and so, as for described for O3 in Section 3.3, we scale the RAIRS band strength reported in Loeffler et al. (2006). For the bending mode at 1368cm-1 this yields a band strength of 3.0 x 10⁻¹⁷cm molec-1. We find an H2O2 upper limit of 0.01ML, compared to a typical O3 yield of 4ML for experiments with similar initial doses. Thus, these species are either not produced or are a small fraction of the total reaction.
4.3 CO dilution experiments
In order to evaluate whether CH3OH formation via O(1D) insertion into CH4 is also efficient in a more astrophysically realistic environment, we performed a set of experiments (21-26) in which the reactants 16O2 and 13CH4 were diluted in 12CO. CO absorbs UV radiation, thereby introducing the possibility of contamination from CO-induced chemistry. However, by following the formation of 12C vs. 13C products we determine that 12CO mainly reacts to form 12CO2. We follow the growth of 13CH3OH in order to determine the oxygen insertion kinetics.
| Expt. | (ML) | (s-1) |
|---|---|---|
| 21 | 0.54 [0.15] | 1.1 [0.3] x 10-4 |
| 22 | 0.70 [0.33] | 5.1 [2.6] x 10-5 |
| 23 | 0.38 [0.15] | 9.8 [3.9] x 10-5 |
| 24 | 1.43 [0.90] | 1.6 [1.3] x 10-5 |
| 25 | 0.54 [0.45] | 3.7 [3.1] x 10-5 |
| 26 | 0.55 [0.46] | 3.5 [3.1] x 10-5 |
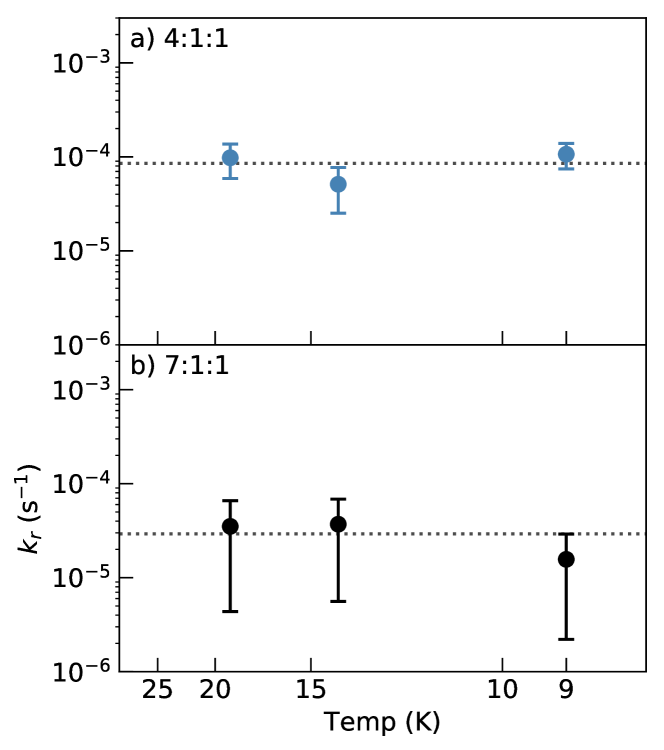
Rate constants for CH3OH formation are determined by fitting Equation 8 as before. CH3OH formation rate constants are derived at temperatures between 9K-19K for ices of two different compositions: 4:1:1 12CO:16O2:13CH4 mixtures and 7:1:1 12CO:16O2:13CH4 mixtures. Since product yields are reduced when the reactants are diluted in CO, uncertainties on the rate constants are higher than in the O2:CH4 experiments. Still, as can be seen from the Arrhenius plots (Figure 7), there is no temperature dependence to the CH3OH formation rate. The parameters and Nss are shown in Table 6.
5 Discussion
5.1 Reaction network
As mentioned in Section 1, for the UV wavelengths in this study, O2 dissociation proceeds through the channel O2 O(1D) + O(3P) with an efficiency of unity (Lee et al., 1977). Thus, our ices should contain equal parts O(1D) and O(3P). We now draw from gas-phase, theoretical, and, when available, condensed-phase studies to interpret the formation pathways of our observed products. Figure 8 presents a summary of the possible pathways we discuss.
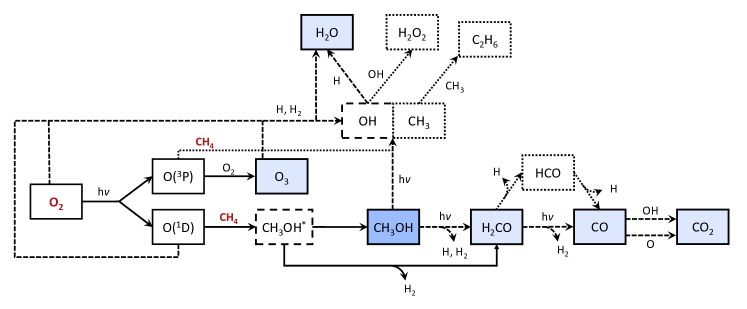
CH3OH formation: In the gas phase the insertion of O(1D) into CH4 results in an excited CH3OH product, which undergoes unimolecular dissociation to form mainly OH + CH3 unless it is stabilized by e.g. collision (DeMore & Raper, 1967; Parnis et al., 1993) or supersonic expansion (Hays et al., 2015). As our experiments involve condensed ices, it is fully consistent that the intact CH3OH molecule is observed due to energy dissipation into the solid. This insertion process has been demonstrated to have essentially no barrier in gas-phase and theoretical studies (DeMore & Raper, 1967; Yu & Muckerman, 2004), which is again consistent with the lack of a temperature dependence to CH3OH formation in our experiments.
In contrast, ground state O(3P) oxygen atoms follow an abstraction channel with CH4 to produce OH + CH3, with an estimated barrier of over 5000K (e.g. Walch & Dunning Jr., 1980; Zhao et al., 2016). Such an abstraction channel could conceivably lead to CH3OH production through radical recombination, however this is unlikely due to the high theoretical energy barrier. Furthermore, as stated in Section 4.2.3, the upper limits for C2H6 and H2O2 are on the order of a percent or less of the total consumed CH4, indicating that abstraction is not an important process in this system.
O3 formation: O3 formation from energetic processing of molecular oxygen under astrochemically relevant conditions has been well-described in the literature (e.g. Schriver-Mazzuoli et al., 1995; Bennett & Kaiser, 2005; Sivaraman et al., 2011). The mechanism for O3 formation under these conditions is O(3P) + O2. This is likely the formation pathway occurring in our ices as well since O(3P) should be formed in similar quantities as O(1D), and the barrier to react with CH4, the other available reaction partner, is high.
H2CO formation: A fraction of H2CO may be formed from photo-processing of CH3OH, as has been demonstrated in previous UV irradiation studies (e.g. Gerakines et al., 1996; Öberg et al., 2009). As discussed in Section 4.2.3, the majority of H2CO is likely formed directly from insertion of O(1D) into CH4. Indeed, following CH3OH, H2CO is the next most stable possible product of O(1D) insertion into CH4 (Chang & Lin, 2002; Yu & Muckerman, 2004), and gas-phase and matrix studies typically show H2CO as the second-most common insertion product (e.g. DeMore & Raper, 1967; Appelman et al., 1989; Hays et al., 2015). Moreover, from Figure 6 the shape of the H2CO growth curve is different from the second-generation product CO2, but quite similar to that of the primary insertion product CH3OH. This is consistent with a scenario in which the majority of H2CO forms from the same mechanism as CH3OH, as opposed to growing only from CH3OH processing.
CO formation: Successive H abstractions could form CO via H2CO HCO CO, but as seen in Figure 5d HCO is not observed in the IR despite having a comparable band strength to CO (Bennett et al., 2007). Alternatively, CO may be produced by unimolecular dissociation of H2CO to directly form CO + H2, which is a demonstrated photo-process of H2CO in the condensed phase (Thomas Jr. & Guillory, 1973) and explains the lack of observed HCO.
H2O formation: Hydrogenation channels beginning with O, O2, or O3 have been shown experimentally to lead to water formation (Dulieu et al., 2010; Ioppolo et al., 2008; Romanzin et al., 2011) and are likely at play in this system given the availability of these reactants. An alternative pathway is the formation and subsequent hydrogenation of OH by the abstraction pathway of O(3P) with CH4. However, given the high barrier to the O(3P) abstraction pathway and lack of observed C2H6, reaction pathways beginning with O, O2, or O3 are more likely.
CO2 formation: From the shape of its growth curve (Figure 6), CO2 is almost certainly a second-generation product, with its abundance increasing at later times in the experiment. One possible route for CO2 formation is CO + OH, with OH formed as an intermediate along the H2O formation channels. Studies have also shown CO2 formation from CO + O (Parnis et al., 1993; Madzunkov et al., 2006; Minissale et al., 2013). It is unclear whether the higher energy barrier of the CO + O pathway or the higher diffusion barrier of the CO + OH pathway will dominate under these conditions.
5.2 O insertion reaction
We derive a branching ratio for the CH3OH channel of 65%, with the remaining insertions leading to H2CO formation. Fragmentation does not appear to be an important process in this system as evidenced by the lack of CH3 and OH chemistry. Solid-state oxygen insertions should therefore lead to a net increase in chemical complexity, in most cases increasing the size of the product molecule and in all cases forming an O-containing organic from a hydrocarbon.
We observe no temperature dependence to CH3OH formation via oxygen insertion, consistent with gas-phase and theoretical studies which show a negligible or non-existent energy barrier. With these experiments alone, however, we cannot definitively rule out the presence of a small energy barrier for several reasons. First, our experiments cannot isolate any contributions from tunneling, which may play a role at the low temperatures studied here. Additionally, it is possible that a diffusion barrier for O atoms could mask an insertion barrier, since the atoms would have to overcome a barrier to diffuse away than to react. Based on rather low diffusion barriers for O atoms in models (400K; Garrod & Pauly, 2011), only a small reaction barrier could be masked in this way. Finally, the photodissociation of O2 may lead to the formation of “hot” oxygen atoms: the threshold for formation of O(3P) + O(1D) is 175nm (Nee & Lee, 1997), whereas the UV lamp in this study peaks at 160.8nm. This energy difference represents 0.6eV. Some of this excess energy will be dissipated into the solid, but it is possible that oxygen atoms formed as a result of photodissociation are superthermal.
A hot atom mechanism may also be at play in ISM ices: as described in Section 1, the O(1D) required for oxygen insertion chemistry in astrophysical settings is likely formed from photolysis or radiolysis of oxygen-bearing molecules. The possibility that oxygen insertion is driven by hot atoms in our experiments makes it important to explore in ices with more realistic compositions than O2:CH4 mixtures. In the CO-dominated experiments (Section 4.3), we found that even when the reactants are diluted in a CO ice, the CH3OH formation rate follows the same temperature-independent trend as in the O2:CH4 only experiments. Thus, whether O(1D) insertion is mediated by a hot atom mechanism or not, we find that it can proceed at very low temperatures in a barrierless/pseudo-barrierless manner.
When taken along with the theoretical insertion barrier of just 280K and a negligible measured insertion barrier in the gas phase, an essentially barrierless ice-phase insertion process is the most likely explanation for our experimental results. We conclude that insertion is a dominant reaction pathway when excited O(1D) is present, and furthermore that it proceeds pseudo-barrierlessly in ISM-like ices.
5.3 Astrophysical implications
In the interstellar medium, O insertion pathways could be of particular importance in very cold regions where radical diffusion chemistry is not thermally accessible. Indeed, gas-phase chemistry leading to hydrocarbon formation is known to be very efficient at low temperatures; these hydrocarbons can then accrete onto grain surfaces. Meanwhile, as mentioned in Section 1, excited O(1D) atoms can be formed by energetic processing of common oxygen-bearing constituents of astrophysical ices (in particular, H2O and CO2). The insertion of oxygen atoms directly into hydrocarbons would then lead to the formation of a variety of complex organic species, without the need for radical diffusion. The degree to which this type of chemistry contributes to COM formation will need to be tested by astrochemical modelers. In this case, it will be important to distinguish between O(3P) and O(1D) atoms in order to accurately account for the chemistry.
Ultimately it will be important to quantify the process of O insertion into larger hydrocarbons: CH3OH, while a convenient test case, can be produced in astrochemical models via CO hydrogenation. Larger organics, on the other hand, are regularly underproduced in models and therefore seemingly missing a formation pathway. From the limited literature available, O insertions into both saturated and unsaturated larger hydrocarbons should occur at low temperatures in condensed phases (Parnis et al., 1993; DeMore, 1969), though further experiments are required to quantify the energetics and product distribution of such systems. While we expect to see a low or non-existent insertion barrier for larger hydrocarbons, it is important to obtain branching ratios for the insertion products: the C-H bonds are not necessarily degenerate in larger hydrocarbons as they are in CH4, making it difficult to predict a priori which products will form. Moreover, gas-phase studies suggest that an abstraction channel becomes increasingly competitive with insertion for larger hydrocarbons (Luntz, 1980). There is also some evidence for O insertion into C-C bonds in the gas phase (Yang, 2006). The experimental setup used in this study cannot be used to test oxygen insertions into other hydrocarbons, as most larger hydrocarbons have appreciable UV absorption cross-sections above the sapphire window cutoff; however, testing these systems experimentally should be possible with an atomic beam setup. Quantitative constraints on the energetics and product distributions of O atom insertion into larger hydrocarbons will enable an evaluation of the importance of oxygen insertion chemistry to forming complex molecules in astrophysical environments.
6 Conclusions
We have experimentally tested and quantified the formation of CH3OH via oxygen insertion into methane in astrophysical ice analogs. From our results we conclude:
-
1.
Selective dissociation of O2 in mixed O2:CH4 ices results in the formation of CH3OH in various isotopologue studies. The growth kinetics of CH3OH are well described by a model that includes both formation and photo-dissociative loss.
-
2.
A direct insertion mechanism of O(1D) atoms into CH4 explains CH3OH formation, with a minor channel of H2CO production and no evidence of fragmentation to CH3 + OH. O(1D) insertions in ices therefore lead to a net increase in chemical complexity. We quantify the steady-state branching ratio to CH3OH to be 60-71%.
-
3.
Experiments with varying ice thicknesses and reactant ratios show no temperature dependence to the CH3OH formation rate constant from 9-24K. This holds even when the reactants are diluted in a CO matrix, consistent with a small or non-existent energy barrier to insertion.
-
4.
Experimental constraints on the energetics and branching ratios of O insertions into larger hydrocarbons are required to assess the contribution of oxgyen insertion chemistry to observed abundances of COMs.
The authors thank Edith Fayolle, Robin Garrod, and Ilsa Cooke for valuable feedback. J.B.B acknowledges funding from the National Science Foundation Graduate Research Fellowship under Grant DGE1144152. K.I.O. acknowledges funding from the Simons Collaboration on the Origins of Life (SCOL) investigator award.
7 Appendix A: IR spectrum fitting with MCMC
For 16O2:13CH4 experiments, each IR spectrum was fit from 940-1090cm-1. The scan immediately prior to irradiation was subtracted from each irradiation spectrum. Irradiation spectra were then fit with a model consisting of a linear baseline term and four Gaussians:
| (10) |
where and represent the y and x offsets for the baseline, are the Gaussian amplitudes, are the Gaussian centers, and are the Gaussian widths. An example corner plot from MCMC fitting with is shown in Figure 9; for clarity, the fit parameters for two Gaussians are shown rather than all 16 parameters simultaneously. For fitting the 18O2:CD4 experiments, the wavelength range used for fitting was 900-965cm-1, and only two Gaussians were required in the model since the 18O3 feature is sufficiently well-separated from CDOD. For CO:16O2:13CH4 experiments, spectra were fit from 980-1030cm-1 and due to low product yields a single Gaussian was sufficient to fit the CH3OH feature.
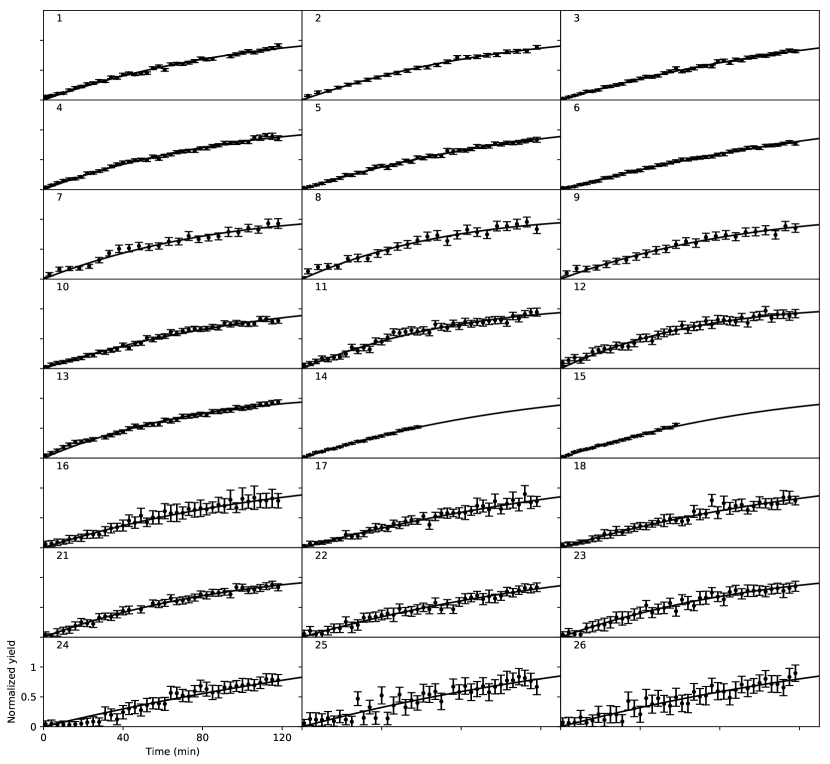
8 Appendix B: Experimental growth curves and model fits
Growth curves along with best-fit kinetic models for all experiments are shown in Figure 10.
References
- Appelman et al. (1989) Appelman, E. H., Downs, A. J., & Gardner, C. J. 1989, JPhCh, 93, 598
- Arce et al. (2008) Arce, H. G., Santiago-García, J., Jørgensen, J. K., Tafalla, M., & Bachiller, R. 2008, ApJ, 681, L21
- Bacmann et al. (2012) Bacmann, A., Taquet, V., Faure, A., Kahane, C., & Ceccarelli, C. 2012, A&A, 541, L12
- Bennett et al. (2007) Bennett, C. J., Chen, S.-H., Sun, B.-J., Chang, A. H. H., & Kaiser, R. I. 2007, ApJ, 660, 1588
- Bennett & Kaiser (2005) Bennett, C. J., & Kaiser, R. I. 2005, ApJ, 635, 1362
- Blake et al. (1987) Blake, G. A., Sutton, E. C., Masson, C. R., & Phillips, T. G. 1987, ApJ, 315, 621
- Bottinelli et al. (2004) Bottinelli, S., Ceccarelli, C., Lefloch, B., et al. 2004, ApJ, 615, 354
- Bouilloud et al. (2015) Bouilloud, M., Fray, N., Bénilan, Y., et al. 2015, MNRAS, 451, 2145
- Cernicharo et al. (2012) Cernicharo, J., Marcelino, N., Roueff, E., et al. 2012, ApJ, 759, L43
- Chang & Lin (2002) Chang, A. H. H., & Lin, S. H. 2002, CPL, 363, 175
- Chuang et al. (2016) Chuang, K.-J., Fedoseev, G., Ioppolo, S., van Dishoeck, E. F., & Linnartz, H. 2016, MNRAS, 455, 1702
- Cosby (1993) Cosby, P. C. 1993, JChPh, 98, 9560
- Cruz-Diaz et al. (2014a) Cruz-Diaz, G. A., Muñoz Caro, G. M., Chen, Y.-J., & Yih, T.-S. 2014a, A&A, 562, A119
- Cruz-Diaz et al. (2014b) Cruz-Diaz, G. A., Muñoz Caro, G. M., Chen, Y.-J., & Yih, T.-S. 2014b, A&A, 562, A120
- DeMore (1969) DeMore, W. B. 1969, JPhCh, 73, 391
- DeMore & Raper (1966) DeMore, W. B., & Raper, O. F. 1966, JChPh, 44, 1780
- DeMore & Raper (1967) DeMore, W. B., & Raper, O. F. 1967, JChPh, 46, 2500
- Du et al. (2011) Du, J., Wan, L., Wu, L., et al. 2011, JPCA, 115, 1040
- Dulieu et al. (2010) Dulieu, F., Amiaud, L., Congiu, E., et al. 2010, A&A, 512, A30
- Fayolle et al. (2013) Fayolle, E. C., Bertin, M., Romanzin, C., et al. 2013, A&A, 556, A122
- Fedoseev et al. (2015) Fedoseev, G., Cuppen, H. M., Ioppolo, S., Lamberts, T., & Linnartz, H. 2015, MNRAS, 448, 1288
- Foreman-Mackey et al. (2013) Foreman-Mackey, D., Hogg, D. W., Lang, D., & Goodman, J. 2013, PASP, 125, 306
- Fuchs et al. (2009) Fuchs, G. W., Cuppen, H. M., Ioppolo, S., et al. 2009, A&A, 505, 629
- Garrod et al. (2008) Garrod, R. T., Widicus Weaver, S. L., & Herbst, E. 2008, ApJ, 682, 283
- Garrod & Pauly (2011) Garrod, R. T., & Pauly, T. 2011, ApJ, 735, 15
- Gerakines et al. (1996) Gerakines, P. A., Schutte, W. A., & Ehrenfreund, P. 1996, A&A, 312, 289
- Hays et al. (2015) Hays, B. M., Wehres, N., DePrince, B. A., et al. 2015, CPL, 630, 18
- Herbst & van Dishoeck (2009) Herbst, E., & van Dishoeck, E. F. 2009, ARA&A, 47, 427
- Hudson et al. (2014) Hudson, R. L., Gerakines, P. A., & Moore, M. H. 2014, Icar, 243, 148
- Ioppolo et al. (2008) Ioppolo, S., Cuppen, H. M., Romanzin, C., van Dishoeck, E. F., & Linnartz, H. 2008, ApJ, 686, 1474
- Kaiser et al. (2015) Kaiser, R. I., Maity, S. J., & Jones, B. M. 2015, Angewandte Chemie, 127, 197
- Kedzierski et al. (2013) Kedzierski, W., Hein, J. D., Tiessen, C. J., et al. 2013, Can. J. Phys., 91, 1044
- Lauck et al. (2015) Lauck, T., Karssemeijer, L., Shulenberger, K., et al. 2015, ApJ, 801, 118
- Lee et al. (1977) Lee, L. C., Slanger, T. G., Black, G., & Sharpless, R. 1977, JChPh, 67, 5602
- Legay-Sommaire & Legay (1982) Legay-Sommaire, N., & Legay, F. 1982, CP, 66, 315
- Lin & DeMore (1973) Lin, C. L., & DeMore, W. B. 1973, JPhCh, 77, 863
- Loeffler et al. (2006) Loeffler, M. J., Teolis, B. D., & Baragiola, R. A. 2006, JChPh, 124, 104702
- Luntz (1980) Luntz, A. C. 1980, JChPh, 73, 1143
- Lugez et al. (1994) Lugez, C., Schriver, A., Levant, R., & Schriver-Mazzouli, L. 1994, CP, 181, 129
- Madzunkov et al. (2006) Madzunkov, S., Shortt, B. J., MacAskill, J. A., Darrach, M. R., & Chutjian, A. 2006, PhRvA, 73, 020901
- Minissale et al. (2013) Minissale, M., Congiu, E., Manicò, G., Pirronello, V., & Dulieu, F. 2013, A&A, 559, A49
- Mohammed (1990) Mohammed, H. H. 1990, JChPh, 93, 412
- Nee & Lee (1997) Nee, J. B., & Lee, P. C. 1997, JPCA, 101, 6653
- Öberg (2016) Öberg, K. I. 2016, ChRv, 116(17), 9631
- Öberg et al. (2011) Öberg, K. I., Boogert, A. C. A., Pontoppidan, K. M., et al. 2011, ApJ, 740, 109
- Öberg et al. (2010) Öberg, K. I., Bottinelli, S., Jørgensen, J. K., & van Dishoeck, E. F. 2010, ApJ, 716, 825
- Öberg et al. (2009) Öberg, K. I., Garrod, R. T., van Dishoeck, E. F., & Linnartz, H. 2009, A&A, 504, 891
- Öberg et al. (2015) Öberg, K. I., Guzmán, V. V., Furuya, K., et al. 2015, Nature, 520, 198
- Parnis et al. (1993) Parnis, J. M., Hoover, L. E., Fridgen, T. D., & Lafleur, R. D. 1993, JPhCh, 97, 10708
- Romanzin et al. (2011) Romanzin, C., Ioppolo, S., Cuppen, H. M., van Dishoeck, E. F., & Linnartz, H. 2011, JChPh, 134, 084504
- Schriver-Mazzuoli et al. (1995) Schriver-Mazzuoli, L., de Saxcé, A., Lugez, C., Camy-Peyret, C., & Schriver, A. 1995, JChPh, 102, 690
- Sivaraman et al. (2011) Sivaraman, B., Mebel, A. M., Mason, N. J., Babikov, D., & Kaiser, R. I. 2011, PCCP, 13, 421
- Slanger & Black (1971) Slanger, T. G., & Black, G. 1971, JChPh, 54, 1889
- Slanger & Black (1982) Slanger, T. G., & Black, G. 1982, JChPh, 77, 2432
- Stief et al. (1975) Stief, L. J., Payne, W. A., & Klemm, R. B. 1975, JChPh, 62, 4000
- Straub et al. (1996) Straub, H. C., Renault, P. Lindsay, B. G., Smith, K. A., & Stebbings, R. F. 1996, PhRvA, 54, 2146
- Straub et al. (1997) Straub, H. C., Lin, D. Lindsay, B. G., Smith, K. A., & Stebbings, R. F. 1997, JChPh 106, 4430
- Thomas Jr. & Guillory (1973) Thomas Jr., S. G., & Guillory, W. A. 1973, JPhCh, 77, 2469
- Ung (1974) Ung, A. Y. M. 1974, CPL, 28, 603
- Walch & Dunning Jr. (1980) Walch, S. P., & Dunning Jr., T. H. 1980, JChPh, 72, 3221
- Watanabe & Kouchi (2002) Watanabe, N., & Kouchi, A. 2002, ApJ, 571, L173
- Yang (2006) Yang, X. 2006, PCCP, 8, 205
- Yu & Muckerman (2004) Yu, H., & Muckerman, J. T. 2004, JPCA, 108, 8615
- Zhao et al. (2016) Zhao, H., Wang, W., & Zhao, Y. 2016, JPCA, 120, 7589
- Zheng et al. (2011) Zheng, W., Kim, Y. S., & Kaiser, R. I. 2011, PCCP, 13, 15749
- Zhu & Gordon (1990) Zhu, Y. F., & Gordon, R. J. 1990, JChPh, 92, 2897