59 \journalyear2017 \journaleditorsP. Benaglia, H. Muriel, R. Gamen & M. Lares
1
1
7
mateofa@iafe.uba.ar
EBL constraints with VERITAS gamma-ray observations
La luz extragaláctica de fondo (EBL) contiene la radiación total emitida en procesos nucleares y de acreción desde la época de recombinación. La medición directa de este fondo es extremadamente difícil debido a la contaminación proveniente de la luz zodiacal. En cambio, la astronomía de rayos gamma ofrece la posibilidad de restringir de manera indirecta al EBL estudiando los efectos que la absorción de rayos gamma tiene en los espectros de fuentes detectadas en la banda de muy altas energías (100 GeV). En general, los efectos de la absorción pueden apreciarse como un softening en el espectro y/o cambios abruptos en el índice espectral de fuentes observadas. En este estudio se utilizan observaciones recientes de un grupo de blazares, realizadas con VERITAS, sobre las que se aplican dos métodos para obtener límites en las propiedades espectrales del EBL. Se presentan resultados preliminares que serán luego completados con observaciones mas recientes para mejorar las restricciones aplicadas el EBL.
Abstract
The extragalactic background light (EBL) contains all the radiation emitted by nuclear and accretion processes since the epoch of recombination. Direct measurements of the EBL in the near-IR to mid-IR waveband are extremely difficult due mainly to the zodiacal foreground light. Instead, gamma-ray astronomy offers the possibility to indirectly set limits on the EBL by studying the effects of gamma-ray absorption in the spectra of detected sources in the very high energy range (VHE: 100 GeV). These effects can be generally seen in the spectra of VHE blazars as a softening (steepening) of the spectrum and/or abrupt changes in the spectral index or breaks. In this work we use recent VERITAS data of a group of blazars and apply two methods to derive constraints for the EBL spectral properties. We present preliminary results that will be completed with new observations in the near future to enhance the limits on the EBL.
keywords:
submillimiter: diffuse background — gamma rays: galaxies1 Introduction
The extragalactic background light (EBL) contains all radiation released from nuclear and accretion processes since the epoch of recombination. It consists essentially of all emitted and absorbed/re-emitted starlight accumulated over all redshifts. Understanding this background radiation is crucial to understand star formation processes and galaxy evolution models. So far, no direct detection has been achieved; the difficulty of this is due mainly to the zodiacal foreground light (Hauser, 1998). However, throughout the last decade, upper and lower limits have been established using different methods, e.g. integrated galaxy counts from optical observations with the Hubble Space Telescope (Gardner et al., 2000; Madau & Pozzetti, 2000), infrared observations using Spitzer Space Telescope (Fazio et al., 2004; Papovich et al., 2004) and the Infrared Space Observatory (Elbaz et al., 2002). So far we have learned the EBL has a bimodal spectrum with one component peaking at and another peaking at (Orr et al., 2011).
Gamma-ray astronomy offers the chance to indirectly set limits on the EBL by studying the effects of gamma-ray absorption in the spectra of detected sources in the very high energy range (VHE: 100 GeV). Gamma rays in the TeV regime have a high probability of interacting with background photons from the EBL via pair production (Gould & Schréder, 1966). The resulting leptons can interact via inverse Compton scattering with background photons as well, generating a cascade that results in the conversion of VHE photons into less energetic photons that can travel further (Aharonian et al., 1994). The cascade process results in an overall softening effect in the observed spectra of VHE energy sources. Moreover, the EBL spectral properties themselves can produce distinctive features in the observed spectra of VHE sources. In particular, recent EBL models, like Franceschini et al. (2008), predict an abrupt shift in the spectral index around 1 TeV that depends on the source distance, i.e. on the total EBL attenuation for a given source.
Blazars are a special type of active galactic nuclei (AGN) that have their jet pointing towards the Earth, and that present an unusually high TeV flux. The observed spectrum of these sources can be well characterized in the VHE range by a power law (e.g. Schönfelder, 2001). In this work we revisit a published method (Orr et al., 2011) for analyzing blazar spectra and we use recent VERITAS (Holder et al., 2006) data from the blazar 1ES1218+304 to test the method. This analysis will be part of a more complete EBL study that is being done by the VERITAS collaboration using more sources and methods.
2 Method
Absorption of VHE photons can leave several traces in the observed spectra of blazars. In this work we explore two different methods to constrain the EBL using two different features present in observed blazar spectra: the softening of the spectral index (spectral shape method) and the spectral break around 1 TeV (spectral break method). EBL constraints are derived by testing different models/realizations for the EBL spectral energy distribution (SED). For this study, a baseline model was assumed, following the shape outlined by lower limits gathered from the Hubble Space Telescope, the Spitzer Space Telescope and the Infrared Space Observatory. This baseline model is then used to generate different EBL scenarios following the third order splines method used in Mazin & Raue (2007). In this case the method is used to generate different SEDs by varying two wavelength values: =15m and =1.6m representing the mid and near IR regimes respectively.
2.1 Spectral Shape Method
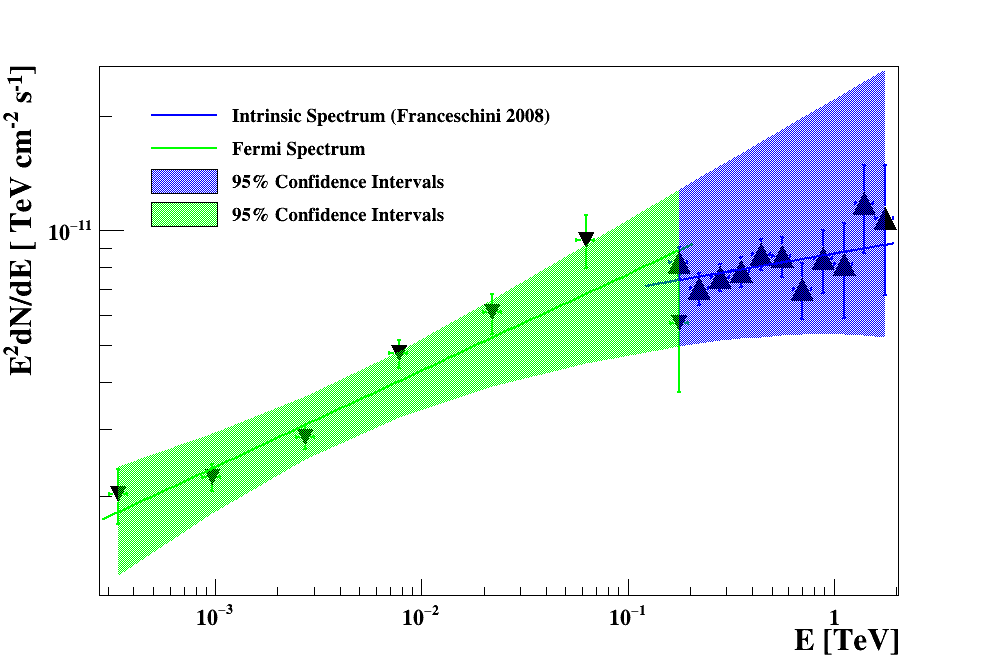
EBL absorption produces a steepening (softening) in the VHE part of the spectrum which depends both on the EBL properties and on the source distance. On the other hand, absorption has a minimal effect on the high energy (HE: 10 MeV E 100 GeV) part of the spectrum. Under the assumption that the intrinsic VHE spectrum of the source is a prolongation of the HE part, it is possible to test different EBL model-scenarios by using them to correct for EBL absorption in observed spectra and compare the resulting spectra to the corresponding HE spectra measured with Fermi-LAT. Using the EBL model it is possible to calculate the optical depth of a photon of a given energy and at a given redshift. The intrinsic spectrum is then calculated using the relationship
| (1) |
where is the intrinsic spectrum, is the observed spectrum, and is the optical depth at energy E and source redshift z. is calculated for different EBL realizations generated with the splines method. The resulting intrinsic spectrum is then fitted by a power law and the model is accepted or rejected following the criterion
| (2) |
where and are the calculated intrinsic spectral index and variance respectively, and and are the Fermi spectral index and variance respectively.
2.2 Spectral Break Method
EBL absorption may also produce breaks in the observed spectrum. In particular, given the overall shape of the EBL, a break around 1 TeV is expected. The magnitude of these breaks increases with the source distance and depends on the EBL shape (Imran & Krennrich, 2008). Using a test intrinsic spectrum, the expected observed spectrum is calculated for different EBL realizations by using the inverse of equation 1. Gaussian fluctuations are added to the resulting points using a Normal distribution with a standard deviation equal to 25% of each point’s error bar. The resulting spectrum is then fitted with a broken power law with the form
| (3) |
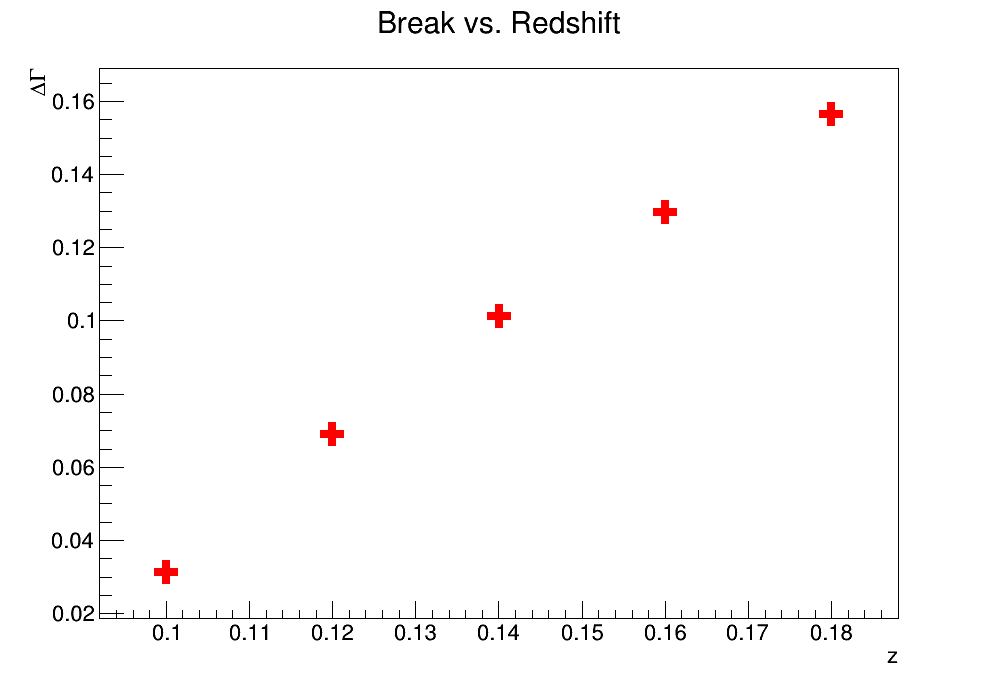
where is the normalization at the break energy , and are the spectral indexes below and above the respectively and is the energy. For this particular study the break energy is fixed in 1 TeV and the fit functions are forced to match each other at this break point. The spectral break is then defined as
| (4) |
From here, the expected dependence of with redshift is estimated and then compared with the observed dependence. Doing this for different EBL realizations it is possible to test possible models by checking consistency between expected and observational results.
3 Data Selection & Analysis
For the complete analysis 18 blazars were selected at various redshifts and with different spectral properties. All of them have been detected with a significance of more than 10 . The processing and reduction of the TeV data is done with VERITAS own developed analysis software. Fermi-LAT observations are used to obtain the source’s spectra in the GeV regime. At the moment the data is being processed and analyzed by members of the VERITAS collaboration using mainly the National Energy Research Scientific Computing Center (NERSC) cluster.
4 Preliminary Results
We have tested the de-absorption spectrum calculations and the methods on over 120 hours of 1ES1218+304 data to see the scripts are working properly.
Figure 1 shows an example of the GeV and TeV spectra after de-absorption, each one fitted with a power law. The difference in the resulting spectral indexes and determines whether the model is accepted or rejected. Table 1 shows results obtained for three different EBL models as an example.
| Model | N | Condition |
|---|---|---|
| Franceschinni | 0.65 | OK |
| Spline 1 | 0.24 | OK |
| Spline 2 | 3.33 | NO |
Figure 2 shows TeV spectra of two test sources at two different redshifts, fitted with a broken power law with a break at 1 TeV. It can be seen that the method
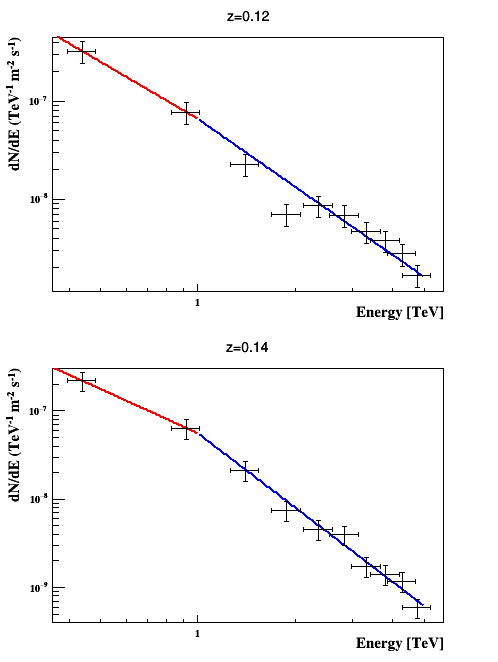
Figure 3 shows an example of the expected trend of with redshift z obtained for a Crab-like spectrum111These results were obtained without considering any fluctuations, just to test the scripts were working properly.. The behavior of with redshift will then be calculated for each considered source and compared to observations to constrain EBL models.
We tested and applied the spectral shape and spectral break methods on 1ES1218+304 data and checked scripts are working properly. These methods will be used on the new data once the processing and analysis phase concludes, and will hopefully derive more stringent constraints on the EBL spectral properties.
This research is supported by grants from the U.S. Department of Energy Office of Science, the U.S. National Science Foundation and the Smithsonian Institution, and by NSERC in Canada. We acknowledge the excellent work of the technical support staff at the Fred Lawrence Whipple Observatory and at the collaborating institutions in the construction and operation of the instrument.
References
- Aharonian et al. (1994) Aharonian F., Coppi P., Voelk H., 1994, ApJ, 423, L5
- Elbaz et al. (2002) Elbaz D., et al., 2002, A&A, 384, 848
- Fazio et al. (2004) Fazio G. G., et al., 2004, ApJS, 154, 39
- Franceschini et al. (2008) Franceschini A., Rodighiero G., Vaccari M., 2008, A&A, 487, 837
- Gardner et al. (2000) Gardner J. P., Brown T. M., Ferguson H. C., 2000, ApJ, 542, L79
- Gould & Schréder (1966) Gould R., Schréder G., 1966, Physical Review Letters, 16, 252
- Hauser (1998) Hauser M. G., 1998, in American Astronomical Society Meeting Abstracts. p. 1337
- Holder et al. (2006) Holder J., et al., 2006, Astroparticle Physics, 25, 391
- Imran & Krennrich (2008) Imran A., Krennrich F., 2008, International Cosmic Ray Conference, 3, 981
- Madau & Pozzetti (2000) Madau P., Pozzetti L., 2000, MNRAS, 312, L9
- Mazin & Raue (2007) Mazin D., Raue M., 2007, A&A, 471, 439
- Orr et al. (2011) Orr M. R., Krennrich F., Dwek E., 2011, ApJ, 733, 77
- Papovich et al. (2004) Papovich C., Dole H., Egami E., 2004, ApJS, 154, 70
- Schönfelder (2001) Schönfelder V., 2001, The Universe in Gamma Rays