The Peculiar Filamentary HI Structure of NGC 6145
Abstract
In this paper, we report the peculiar HI morphology of the cluster spiral galaxy NGC 6145, which has a 150 kpc HI filament on one side that is nearly parallel to its major axis. This filament is made up of several HI clouds and the diffuse HI gas between them, with no optical counterparts. We compare its HI distribution with other one-sided HI distributions in the literature, and find that the overall HI distribution is very different from the typical tidal and ram-pressure stripped HI shape, and its morphology is inconsistent with being a pure accretion event. Only 30% of the total HI gas is anchored on the stellar disk, while most of HI gas forms the filament in the west. At a projected distance of 122 kpc, we find a massive elliptical companion (NGC 6146) with extended radio emission, whose axis points to an HI gap in NGC 6145. The velocity of the HI filament shows an overall light-of-sight motion of 80 to 180 km s-1 with respect to NGC 6145. Using the long-slit spectra of NGC 6145 along its major stellar axis, we find that some outer regions show enhanced star formation, while in contrast, almost no star formation activities are found in its center (2 kpc). Pure accretion, tidal or ram-pressure stripping is not likely to produce the observed HI filament. An alternative explanation is the jet-stripping from NGC 6146, although direct evidence for a jet-cold gas interaction has not been found.
Subject headings:
galaxies: general – galaxies: jets – galaxies: starburst – stars: formation – methods: observational1. Introduction
Observationally, the HI distribution of galaxies measured at 21 cm is often irregular and more extended than their optical counterparts. According to the HI mappings of nearby galaxies, such as Westerbork observations of neutral Hydrogen in Irregular and SPiral galaxies (WHISP; Swaters et al., 2002), the HI morphology of galaxies exhibits a wide variety of features, such as HI tails, bridges and extra-planar HI gas (Fraternali et al., 2002; Oosterloo et al., 2007). In galaxy clusters, a series of physical processes can influence or determine HI morphologies, such as tidal stripping (Farouki & Shapiro, 1981; Mayer et al., 2006; Haynes et al., 2011), ram-pressure stripping (e.g. Moore et al., 1996; Mayer et al., 2006), and interaction with close companions (Hibbard & Yun, 1999; Okamoto et al., 2015). However, the dominant physical process shaping the HI morphology varies from case to case.
Tidal stripping, which commonly occurs in galaxy groups and clusters, is quite efficient at removing gas, dust and stars from galactic halos (Farouki & Shapiro, 1981; Icke, 1985; Mayer et al., 2006; Haynes et al., 2011), and especially loose peripheral or extra-planar HI gas (Valluri & Jog, 1990), often associated with enhanced star formation activities in galactic centers (Hummel et al., 1990; Li et al., 2008; Smith et al., 2010). As shown in many archetypal examples from observations, typical tidally stripped HI morphology exhibits multiple tidal tails or bridges (Hibbard et al., 2000; Duc et al., 2000; Okamoto et al., 2015), such as the 180 kpc HI tidal tail in merger ARP 299 (Hibbard & Yun, 1999), and HI bridges in minor merger system of M81, M82 and NGC 3077 (Yun et al., 1994), usually as well as disturbed optical morphologies (Schombert, 1988; Kormendy & Djorgovski, 1989). Haynes et al. (2011) examined 199 ALFALFA objects that have no optical counterparts in SDSS, and found 75% of them are located in fields where galaxies of similar redshifts are found, suggesting that they are likely to be related to tidal-debris fields.
In contrast to tidal stripping, ram-pressure stripping only acts on the interstellar medium (ISM) when satellite galaxies are falling into clusters. A typical ram-pressure stripped HI morphology shows a head-tail shape (Gavazzi et al., 1995; van Gorkom et al., 2003; Kenney et al., 2004; Lee & Chung, 2015). By mapping the HI gas distribution of galaxies in Virgo cluster, Chung et al. (2009) found a remarkable number of galaxies with long, one-sided HI tails pointing away from M87, which were proposed to be the effect of ram-pressure stripping, in the sense that these galaxies are falling into the Virgo core for the first time. By modeling pressure variations in the ISM during the ram-pressure stripping process, Fujita (1998) and Fujita & Nagashima (1999) found that star formation activities can increase by up to a factor of two on short timescales ( 108 yr) in rich clusters, while the removal of the HI gas reservoir leads to a suppression of star formation on longer timescales.
In this paper, we report a galaxy (NGC 6145) from the “Bluedisk” project (Wang et al., 2013, 2015), which hosts a one-sided HI filament of 150 kpc length in projected image. The Bluedisk project has mapped the HI emission of a sample of 23 galaxies with unusually high HI mass fractions, as well as a similar-sized sample of control galaxies (Wang et al., 2013). NGC 6145 is from the control sample, which has a normal HI mass fraction, and it resides in the Abell cluster A2197 (Wrobel et al., 1988), whose halo mass is 10 (Yang et al., 2007); i.e., about one third of Virgo cluster (Fouqué et al., 2001). Three companions at similar redshifts are found within the projected distance of 150 kpc from NGC 6145. The HI shape of NGC 6145 does not exhibit typical HI tidal tails or head-tail features, indicating that it is not typical tidal or ram-pressure stripped galaxy. No optical counterparts are found to the HI filament, which is different to typical interactions or mergers. This excited our interest to explore the physical origin of the 150 kpc HI filament. Thus, in this work we analyzed the HI properties, local environment, and star-formation status of NGC 6145, which provide clues to its origin.
The remainder of this paper is organized as follows. In Section 2, we briefly introduce the data we used, including the HI datacube and the optical long-slit spectra along the major axis of NGC 6145. In Section 3, we compare the HI morphology of NGC 6145 with some previous findings of one-sided HI distribution of galaxies. We also investigate the local environment of NGC 6145, the kinematics of its HI gas, and the star formation history along its major axis. In Section 4, we summarize our results and discuss several possible mechanisms that may account for the observed HI filament. Throughout this paper, all the distance-dependent parameters were computed assuming a flat CDM cosmological model with , and . The redshift of NGC 6145 is 0.0287, which corresponds to a luminosity distance of 126 Mpc from us.
2. Data
NGC 6145 is one of the 50 targeted galaxies in “Bluedisk” project. Both HI interferometry and optical long-slit spectral data were obtained. A full description of observations and data reductions of these datasets were presented by Wang et al. (2013) and Carton et al. (2015). Therefore, we give only a brief introduction of these procedures in this section.
2.1. HI Observations and data reduction
The 21 cm emission of NGC 6145 was observed with Westerbork Synthesis Radio Telescope (WSRT) in March 2012 with an on-source integration time of 12 hours. The raw data cube was produced using the pipeline described in Serra et al. (2012), which is based on the MIRIAD reduction package (Sault et al., 1995). In this paper, the HI cube was built with a robust weighting of 0.4, which provided a suitable compromise between sensitivity and resolution.
The velocity resolution is km s-1 (FWHM) and the typical beam has a half-power beamwidth (HPBW) of arcsec2. The HI cube covers a redshift range of , corresponding to a velocity range of 1900 km s-1, and has a size of 1∘ on each side, corresponding to a physical scale of 2.0 Mpc at a redshift (the redshift of NGC 6145). This means that close companions of NGC 6145 were also observed by WSRT at the same time.
We generated a two-dimensional HI total-intensity map of NGC 6145 in two steps. First, we identified 3-dimensional regions with 21 cm emission with a smoothing and clipping algorithm. We then added all the detected HI emission along the velocity direction. We also estimated errors for all non-zero pixels in the HI intensity map.
2.2. Optical long-slit spectroscopy
2.2.1 Observation and data reduction
The optical long-slit spectrum of NGC 6145 was obtained using the Intermediate dispersion Spectrograph and Imaging System (ISIS) on the 4.2 m William Herschel Telescope (WHT). Details of data and their full reduction were described by Carton et al. (2015), although we have briefly summarized the relevant details here.
The spectrograph was set up to observe over the wavelength ranges 3700 - 5300 Å and 5750 - 7200 Å simultaneously, with a spectral resolution that is effectively described by a Gaussian with a 1.7 Å FWHM. The observation was performed on the night of 2nd May 2013, and the seeing conditions varied between 0.7 and 1.4 arcsec. Note that this is significantly smaller than the 3 arcsec slit width. The total integration time was 1h (31200s).
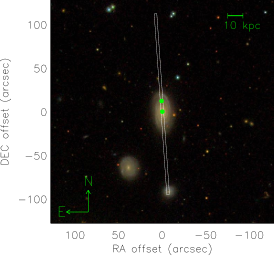
The spectroscopic slit was oriented to pass through the center and along the major axis of the galaxy (left panel of Figure 1). The position angle (PA) is 4∘, as determined from the SDSS image.
2.2.2 Spectral fitting
To reduce the statistical dependence between neighboring bins, and to improve the signal-to-noise ratio (SNR) of the spectra, we have radially binned our spectra with a bin size of 1.2 arcsec, which is roughly equal to the median FWHM of the seeing.
To measure the emission- and absorption-based parameters, we adopted a chi-squared minimization fitting method (Li et al., 2005). The templates are galactic eigenspectra constructed with a principal component analysis method. When fitting the spectrum, we carefully masked the emission lines iteratively. This fitting code is efficient and stable, especially for spectra with low SNR. The disadvantage of our code is that it is unable to fit the line-of-sight (LOS) velocity automatically. To overcome this limitation, we used a fixed velocity given by the spectroscopic SDSS redshift in the first fitting, and extracted the velocities of the emission lines in the red-arm. Specifically, we used the H emission when it was prominent. Then we fitted the galaxy rotation curve using the formula from Böhm et al. (2004):
| (1) |
where is the radius, Vmax is the maximum rotation velocity, V0 is a constant offset in velocity, and and r0 define the shape of the profile. In our procedure, we set to 5 (recommended by Böhm et al., 2004) and V0 to 0 km s-1. Then we obtained the best-fitting result with Vmax=175 km s-1 and =4.4 arcsec. By using this model, we interpolated the rotation velocity at any position along the slit in a numerically stable way. We then used these interpolated velocities as input and refitted stellar continuum. Note that due to the wide slit (wider than the seeing), the precise rotation curve was difficult to obtain (see figure 1 in Carton et al., 2015). However, this model provides a reasonable approximation to the true velocity curve along the spectroscopic slit.
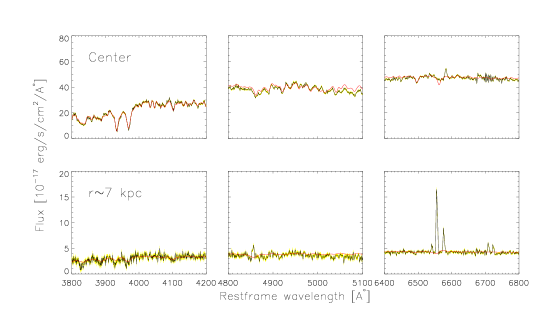
The right panels of Figure 1 illustrate two examples of spectral fitting result at two radii (marked as green points in the optical image): one at galactic center (top) and the other 7 kpc from the center (bottom). In each case, we present the spectrum in three wavelength intervals, where the observed spectrum and its error are shown as the black line and the yellow shaded area, respectively. The best-fitting continuum spectrum is shown in red, where the continuum models match very well with the spectral features in all three wavelength intervals. We compared the central spectrum from the long-slit observation with the SDSS 3-arcsec fiber spectrum, and found the two are highly consistent with each other. There are almost no emission line features at the galactic center, while significant H and H emission are seen at the radius of 7 kpc.
2.3. Physical properties of the galaxy
The physical quantities considered in this work include the stellar mass , stellar surface mass density , Sérsic index , the NUV color and the global star formation rate (SFR). The stellar mass, Sérsic index and NUV color are obtained from NASA Sloan Atlas (NSA; Blanton et al., 2011). The stellar surface density is defined as , where is the physical radius that contains half the total light in the -band. The global SFR is taken from both MPA-JHU database based on SDSS 3-arcsec fiber (Brinchmann et al., 2004), and from Chang et al. (2015) based on multi-band SED fittings of photometric data.
The HI mass is calculated as =()2(), where is the luminosity distance and is the integrated HI flux.
We used the 4000 Å break (Dn(4000)), H absorption (EW(HA)) and H emission (EW(H)) indices to indicate the recent star formation history along the major axis of NGC 6145 (2 Gyr; Bruzual & Charlot, 2003; Kauffmann et al., 2003; Kriek et al., 2011; Li et al., 2015). We measured Dn(4000) and HA index from the emission-line-subtracted spectra for each spectrum, while we measured the emission lines from the stellar-component-subtracted spectrum by fitting a Gaussian profile to these lines.
We estimated the SFR surface density along the major axis with the following formula (Kennicutt, 1989; Kennicutt & Evans, 2012):
| (2) |
where is the H luminosity. When calculating the SFR, we corrected the intrinsic dust attenuation using the Balmer decrement (Domínguez et al., 2013). We adopted the dust attenuation curve from Calzetti et al. (2000) and assumed an intrinsic flux ratio of =2.86, which corresponds to a temperature =104 K and an electron density =102 cm-3 for Case B recombination. We restricted our analysis to spectra for which the SNR of the H and H fluxes was greater than 3. By using this method, the calculated E(B-V)gas has a large range and varies from 0.0 to 1.3 mag. The dust attenuation near the galactic center is small, but becomes extremely high on the outer regions.
3. Results
3.1. HI intensity map of NGC 6145
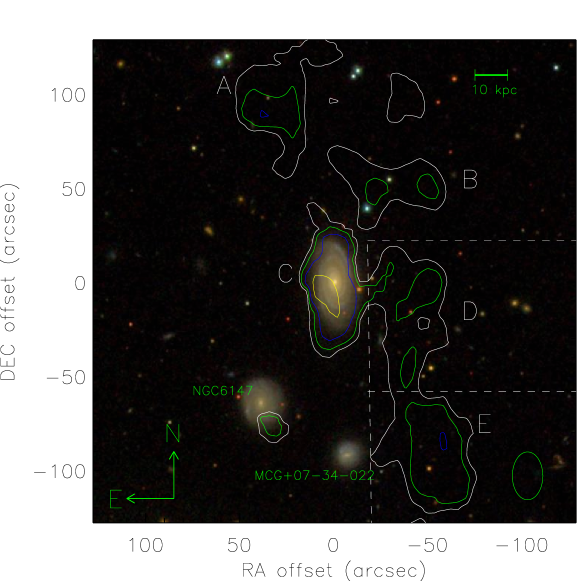
Figure 2 shows the contours of HI column density overlaid on the SDSS optical image of NGC 6145. The white, green, blue and yellow HI contours represent 0.75, 1.5, 3.0 and 6.0 times 1020 atoms cm-2, respectively. The shape of the beam is plotted in green in the bottom-right corner. The map has a size of 147147 kpc2, and the scale is displayed in the top-right corner. For analysis convenience, we roughly separated the HI gas into five regions, based on the outermost contour, and marked them as A, B, C, D and E. We named these five HI regions Clouds A, B, C, D and E in our analysis below. Since Clouds C, D and E are connected, we separated them with white dashed lines according to the HI distribution.
As shown in Figure 2, the HI distribution of NGC 6145 is well resolved, since the size of HI gas is far greater than beam size. The HI gas distribution is quite asymmetric: there is almost no HI gas beyond the stellar disk to the southeast of the galaxy, while several large HI gas clouds can be seen on other sides. These gas clouds, and the diffuse HI gas between them, form a long HI filament with a projected length of 150 kpc. On the stellar disk, the HI gas distribution is asymmetric. The intensity-weighted center of the HI gas anchored on the stellar disk (Cloud C) deviates from its optical center by about 3.3 arcsec, which indicates a gas accumulation at the southeast of the galactic center. The main part of HI distribution generally has a similar shape to that of the stellar disk, and the HI column density drops significantly just beyond the bright part of the stellar disk. When going from galactic center outwards, the HI column density becomes lower than 1.0 atoms cm-2, at a radius of 17.7 kpc along the major axis, which is slightly larger than R25 (16.3 kpc), defined as the radius at the surface brightness of 25 mag arcsec-2 in SDSS -band image.
The total HI mass is 109.74M⊙, when we include HI gas both within and outside the stellar disk. We separated HI gas into five regions as shown in Figure 2. The HI mass is 108.82,108.63,109.22,108.85 and 109.03M⊙ for Clouds A-E, respectively. Among them, Cloud C corresponds to the stellar disk of NGC 6145 and hosts most of the HI gas (29.8% of the total). Clouds A, B, D and E host significant HI gas contents, which account for 11.2%, 7.7%, 12.7% and 19.4% of the total HI gas, respectively. In addition to these five dense clouds, there is also some diffuse HI emission that accounts for 18.6% of the total HI gas. Two close companions, NGC 6147 and MCG +07-34-022, can be seen in Figure 2. MCG +07-34-022 has no detectable HI emission, which is based on a smooth-and-clip algorithm (Serra et al., 2012), while NGC 6147 appears to have a small piece of HI distribution (smaller than the beam size) near its optical counterpart. This HI emission is likely a noise peak, since the corresponding HI mass, 10, is below the noise limit ( 10).
The HI distribution of NGC 6145 shows a 150 kpc filament on one side. Interestingly, one-sided HI distributions of galaxies are not very rare. There are a few other galaxies that also have one-sided HI filaments, such as NGC 4027 (Phookun et al., 1992), Arp 304 (Nordgren et al., 1997), and Arp 84 (Kaufman et al., 1999). In these cases, the optical counterparts are usually found in the density peaks of the one-sided HI distribution, suggesting a merger- or interaction-driven origin. For the case presented in this work, no optical counterparts were found in the HI filament, suggesting that pure interaction or merger are not sufficient to explain it. In some violent interactions and mergers, one or more HI tidal tails can be seen, such as Arp 299 (Hibbard & Yun, 1999), NGC 4038 (Hibbard et al., 2001) and the Arp 270 system (Clemens et al., 1999). In these cases, both the HI and the optical morphology of galaxies exhibit tidal tails or disturbed features. These galaxies are different to NGC 6145, which, along with its companions, does not show disturbed signs, as inferred from the SDSS color image (See Figure 3).
The one-sided HI filaments are not always traced by close companions, such as NGC 4654 (Phookun & Mundy, 1995), NGC 4330, NGC 4402, NGC 4522 and NGC 4569 in Virgo cluster (Chung et al., 2009; Lee & Chung, 2015). These galaxies appear to have head-tail shapes, with a compressed edge on one side and a long tail on the other side. Such a morphology has been proposed to indicate ongoing ram-pressure stripping. In contrast, NGC 6145 does not show a head-tail shape, and several gaps can be seen between the HI clouds, which are not seen in typical ram pressure stripped cases. There are also some HI filaments that are not traced by optical counterparts and do not show a head-tail shape, such as the Leo ring in M96 group (Schneider et al., 1989; Watkins et al., 2014) and the HI filament in NGC 5291 system (Malphrus et al., 1997). The origins and formation of these structures are unclear, and the HI gas in these systems may be primordial (Schneider et al., 1989).
Generally speaking, in contrast with many galaxies showing one-sided HI distributions, the HI filament of NGC 6145 is not traced by close companions, nor does it have a typical ram pressure stripped shape. There is also no evidence that the HI filament is due to tidal interactions, based on the HI and optical images.
3.2. Environment of NGC 6145
NGC 6145 is located to the west of A2197 (Wrobel et al., 1988), which contains more than 300 galaxy members (Yang et al., 2007). The halo mass of this cluster is 1014.6 M⊙, with a size of 2.8 Mpc, where is the radius where dark matter halo has an overdensity of 180. The Abell 2197 is an X-ray poor cluster (Voges et al., 1999), whose total mass is nearly one third of Virgo cluster (Fouqué et al., 2001). The projected distance (Dp) from NGC 6145 to the cluster center is 1.2 Mpc, and it has three close companions within 150 kpc: NGC 6146, NGC 6147 and MCG +07-34-022.
Figure 3 shows the local environment of NGC 6145. Similar to Figure 2, the HI column density contours are displayed in white, green, blue and yellow. The red contours show the radio continuum flux at 1.4 GHz observed by WSRT. The optical image is centered at NGC 6146, which has a size of 340 kpc on each side at a redshift of 0.029. We labeled the names of the companion galaxies in green.
We listed the basic information of these four galaxies in Table 1. From left to right, the columns show the name, right ascension, declination, redshift, stellar mass, surface stellar mass density, NUV, Sérsic index , SFR from MPA-JHU database, SFR from Chang et al. (2015) and the specific SFR (sSFR) (Chang et al., 2015), respectively. Here we listed SFR obtained by two methods: the first one was derived from the SDSS central 3-arcsec fiber spectrum, which reflects the star formation status in the galactic center (Brinchmann et al., 2004); and the second was computed via SED fitting using both SDSS and WISE broad-band fluxes, which represents the star formation status of the whole galaxy.
| Name | ra | dec | z | NUVr | SFR1 | SFR2 | sSFR2 | |||
|---|---|---|---|---|---|---|---|---|---|---|
| (J2000) | (J2000) | () | (mag) | () | () | (yr-1) | ||||
| NGC 6145 | 16h25m02.36s | +40∘5647.8 | 0.02867 | 10.89 | 8.79 | 4.06 | 1.77 | -0.76 | -0.27 | -11.16 |
| NGC 6146 | 16h25m10.33s | +40∘5334.3 | 0.02942 | 11.61 | 9.31 | 5.64 | 5.84 | - | -4.27 | -15.88 |
| NGC 6147 | 16h25m05.84s | +40∘5543.5 | 0.02894 | 10.30 | 8.21 | 3.23 | 0.96 | -1.10 | -2.32 | -12.62 |
| MCG +07-34-022 | 16h25m01.78s | +40∘5515.6 | 0.02954 | 9.75 | 8.08 | 2.73 | 2.30 | -0.50 | -0.97 | -10.72 |
Note. — From left to right, columns show the galaxy name, right ascension, declination, redshift, stellar mass, surface stellar mass density, NUVr, Sérsic index , star formation rate from MPA-JHU database, star formation rate from Chang et al. (2015) and the specific star formation rate (Chang et al., 2015), respectively.

NGC 6146 is a massive elliptical galaxy with a stellar mass of 10, which is about five times massive than NGC 6145. It has no, or very weak, star formation activities at a projected distance of 121.8 kpc from NGC 6145. NGC 6147 and MCG +07-34-022 are smaller galaxies, with masses less than 10. The line-of-sight velocity difference of NGC 6146, NGC 6147, and MCG +07-34-022 with respect to NGC 6145 is 225, 81 and 261 km s-1, respectively, which is much smaller than the velocity dispersion of A2197 (639 km s-1 from Yang et al. (2007) ). These values indicate that they are physically associated and likely gravitationally bound. There are also two galaxies at a similar redshift in the south of NGC 6146 in Figure 3: SDSS J162512.42+405201.6 and SDSS J162512.80+405031.4. However, these two galaxies are not included in Table 1, because they are not massive (logM∗/M10.4) and they are far from the targeted galaxy NGC 6145 with 170kpc.
As shown in Figure 3, NGC 6146 has strong radio emission, with a radio flux density of 155.3 mJy, indicating that it hosts a typical “radio-mode” AGN. When an AGN is at a low level in massive elliptical galaxies, the feedback is usually in a form of radio mode, which uses the mechanical energy of radio-emitting jets (Fabian, 2012). The radio luminosity of NGC 6146 at 1.4 GHz is 3.081023 W Hz-1, which puts it in the FR I type classification (Ghisellini & Celotti, 2001). The jet power we evaluated is erg s-1, by adopting the empirical function from Cavagnolo et al. (2010).
NGC 6146 shows an asymmetric radio-emitting jet along its minor axis, with a position angle of 143.5∘. The radio emission in the northwest has a projected length of 25 kpc, and the other side of radio emission extends to 60 kpc. We call the southeast one “Jet SE”, and the northwest one “Jet NW” in the following analysis (see Figure 3). Wrobel et al. (1988) have found that a high-resolution 18 cm image of NGC 6146 shows a 1 kpc jet knot near the galactic core, and a VLA 20-cm image shows 6-kpc and 11-kpc components at a position angle of 126∘. Compared with the VLA 20-cm image, our 20-cm image has a lower spatial resolution, but higher sensitivity. This explains why in our image we are unable to distinguish the 6 kpc component discovered in the VLA image, but we can detect faint radio emission out to a distance of at least 60 kpc.
There are several possible reasons that might explain the asymmetric radio jet. One is that the jet is simply intrinsically more powerful at one side than at the other side. It is also possible that strong ram- or thermal-pressure gradients in its intergalactic medium have twisted, or disrupted the radio jet on the weaker side (Henriksen et al., 1981). The asymmetric radio jet is unlikely to be caused by the relativistic beaming effect (Bridle & Perley, 1984), because the velocity of the jet would probably decay to be non-relativistic at a projected distance greater than 30 kpc (Strom et al., 1983).
The Jet NW points to the HI gap between Cloud C and Cloud E, as shown in Figure 3. This raises an interesting question: is the Jet NW physically related to the observed HI filament? Observationally, Irwin et al. (1987) proposed a possible ram-pressure stripping case of NGC 3073 by the fast, starburst-driven wind from NGC 3079. NGC 3073 was found to have a head-tail shape with an elongate HI tail, which is remarkably aligned with the nucleus of NGC 3079 (Shafi et al., 2015). However, our case is different to the NGC 3073/3079 system. NGC 6145 is larger in optical size and more massive than NGC 3073 (total mass of 1.1 estimated by Irwin et al. (1987)). The feedback from the nucleus of NGC 6146 is much narrower and stronger than the feedback of stellar wind in NGC 3079. In this sense, one could not rule out the hypothesis that the HI filament is due to the Jet NW from NGC 6146, although the HI morphology of NGC 6145 appears to be different to that of NGC 3073.
3.3. Kinematics of HI gas
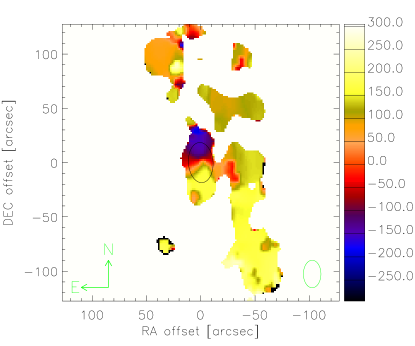

Supposing that the HI gas far beyond the stellar disk was originally from NGC 6145, and was stripped away (ram-pressure stripping or jet stripping), one would expect that the velocity of stripped gas clouds should not be random. Specifically, these stripped HI clouds should have an overall relative motion along the LOS with respect to the host galaxy. The left panel of Figure 4 shows the HI velocity map of NGC 6145, which is normalized by subtracting the optical-recession velocity. The HI velocity fields were derived from a Gauss-Hermite fitting procedure (den Heijer et al., 2015). The central black ellipse shows the stellar disk of this galaxy, where the size of ellipse corresponds to a radius that encloses 90% of the light in -band (R90,r). The velocity map shows a nice spider diagram in the optical region marked by black ellipse, which is similar to well-studied cases of non-faceon spirals (Fraternali et al., 2002; den Heijer et al., 2015). This indicates that the movement of HI gas on stellar disk is not heavily disturbed. The mean LOS velocities of Clouds A, B, D and E are 83.4, 115.2, 126.7 and 174.2 km s-1, respectively, relative to NGC 6145. An increasing LOS velocity is seen along the HI filament from Clouds A, B, D to E. The maximum rotation velocity of this galaxy is 175 km s-1, as determined using Equation 1.
The right panel of Figure 4 shows the position-velocity (P-V) diagram of HI gas along the major axis (PA4∘) of NGC 6145. The green line shows the bes-fitting rotation curve based on the H emission from the long-slit spectra (see Equation 1). The red contours show the levels of 2, 4 and 6 times noise. The velocity of the HI gas is consistent with the velocity curve derived from the H emission along the major axis.
All the gas clouds beyond the stellar disk show positive velocities with respect to the galaxy, which indicates that they are moving away from us along the LOS. If the clouds are on the near side of the galaxy, they are moving towards NGC 6145 (accretion) and if they are on the far side of the galaxy, they are moving away from NGC 6145 (stripping). If we assume accretion is the case, then the HI clouds beyond the stellar disk of NGC 6145 are probably coming from NGC 6147 and MCG +07-34-022. Observationally, NGC 6147 and MCG +07-34-022 have no (or false) detection of 21 cm emission (see Figure 3). With respect to other interacting systems reported in the literature, such as NGC 4027 (Phookun et al., 1992), M81 (Yun et al., 1994), and Arp 84 (Kaufman et al., 1999), the two close companions, NGC 6147 and MCG +07-34-022, do not overlap with the HI filament. This appears to be inconsistent with the explanation that the HI filament is only due to the accretion from NGC 6147 and MCG +07-34-022. Another possible explanation is that the HI filament is the result of accretion from the ram-pressure stripped HI gas originating from the two companion galaxies.
Assuming that the HI filament was originally from NGC 6145, the positive velocity of gas clouds indicates they are departing from NGC 6145. We speculate that gas Clouds A and B originate from the outer regions of stellar disk on the north, and later have been stripped away. Cloud D likely originates from the inner region of stellar disk, and Cloud E is likely from the outer region of stellar disk to the south, based on positions and velocities of these HI clouds. The velocities of the HI in the southern part of the filament are similar to those in the southern part of the galaxy, while the velocities of the HI in the northern part of the filament are very different (by at least 200 km s-1) from those in the northern part of the galaxy. This can be explained by the ram-pressure stripping scenario, where NGC 6145 is moving toward us along the LOS with respect to the intergalactic medium, although the HI shape is inconsistent with this scenario, as discussed in Section 3.1. In this scenario, the gradually changing velocity in the HI filament can be naturally explained by the LOS stripping of a rotating HI disk. In well-studied galaxies with ongoing ram-pressure stripping (Kenney et al., 2004; Chung et al., 2009), the kinematic features of HI tails vary from case to case, and depend on the strength and direction of stripping, inclination and HI distribution of stripped galaxy. In a similar case, NGC 4522 (Kenney et al., 2004) is a nearly edge-on galaxy that is experiencing ongoing ram-pressure stripping. The direction of stripping is nearly perpendicular to the stellar disk, as inferred from the projected image. The velocity of extra-planar gas in NGC 4522 gradually changes along the direction of the disk, which is mainly due to the rotation of the galaxy. In our case, the gradually changing velocity in the HI filament of NGC 6145 can be explained by the combined effect of ram-pressure stripping and rotation, suggesting that the stripping effect is stronger in NGC 6145 than in NGC 4522.
We note that tidal stripping and interaction are also able to cause the gradually changing velocity in HI tidal tails and bridges, such as Arp 84 (Kaufman et al., 1999) and UGC 12815 in WHISP survey (Swaters et al., 2002), due to the strong tidal forces or gas accretion from close companions, although the HI distribution of NGC 6145 does not support these two origins, as discussed in Section 3.1.
3.4. Star formation histories along the slit
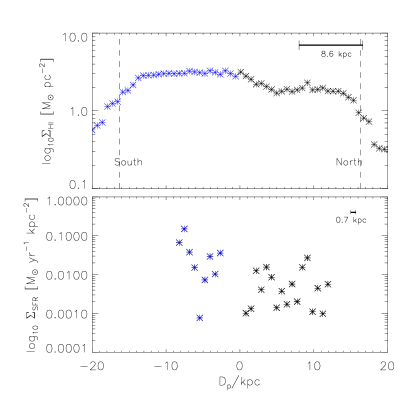
Based on the long-slit spectra, we estimated the SFR surface density ( in units of M⊙yr-1kpc-2) of NGC 6145 along its major axis with Equation 2 in Section 2.3. The bottom panel of Figure 5 shows the base-10 logarithm of as a function of projected distance to the galactic center. H or H fluxes with SNRs less than 3 were excluded as before. In the upper panel of Figure 5, we show the HI mass surface density ( in units of M⊙pc-2) profile along the major axis. In both panels, we labeled the resolution scale of and in the top-right corner.
As shown in the bottom panel of Figure 5, varies significantly along the major axis (by about two orders of magnitude). The star formation regions are discretely distributed, consistent with the fact that the H emission regions are usually in clumps. In the central region ( kpc), is considerably lower than in the outer regions. This probably explains why the SFR from MPA-JHU catalog is 0.5 dex lower than SFR determined by Chang et al. (2015). Note that no data points are seen in the bottom panel beyond 12 kpc. We have visually inspected the spectra beyond kpc by visually inspection, and did not find any prominent H emission.
The profile shows an almost flat shape (2.5 M⊙pc-2) within D kpc, and starts to drop beyond D15 kpc (slightly less than the g-band R25) on each side. Wang et al. (2016) found a uniform characteristic HI surface mass density () of 5.07 M⊙pc-2 for almost all nearby dwarf and spiral galaxies, measured within the radius where the azimuthally averaged HI reaches 1 M⊙pc-2. The of NGC 6145 is lower than by almost 0.3 dex, which is comparable to the scatter in the HI surface mass densities of nearby dwarf and spiral galaxies, thereby raising the possibility that the HI gas in the filament originated from NGC 6145. By comparing (or ) on the two sides, we find, on average, the southern regions have a higher and higher than the northern regions.
We used the 4000 Å break (Dn(4000)), HA absorption index (EW(HA)) and H emission line equivalent width (EW(H)) to trace the recent star formation history (Bruzual & Charlot, 2003; Kauffmann et al., 2003; Li et al., 2015). Dn(4000) has been commonly used as an indicator of the mean stellar age for stellar populations younger than 1-2 Gyr, HA index indicates the star formation that occurred 0.1-1.0 Gyr ago, and EW(H) traces the strength of very recent (within 50 Myr) or ongoing star formation.
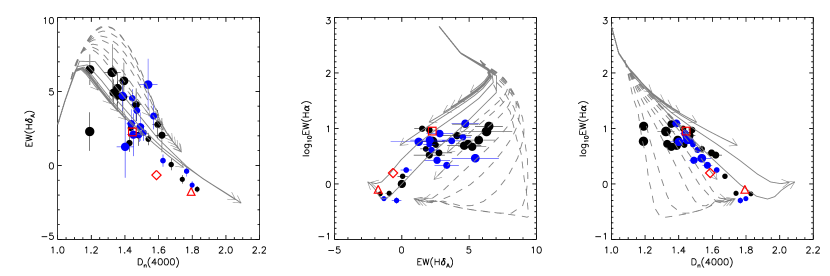
Different regions along the major axis of NGC 6145 are plotted on the planes of Dn(4000) vs. EW(HA) (left panel), EW(HA) vs. EW(H) (middle panel) and Dn(4000) vs. EW(H) (right panel), as shown in Figure 6. Symbol sizes represent projected distances to the galactic center, where larger symbols indicate larger distances. Similar to Figure 6, the blue data points represent the southern regions of NGC 6145 along its major axis, while black data points represent the northern regions of NGC 6145 (see Figure 1). We also plotted the MPA-JHU measurements of NGC 6145 on these planes (red triangles).
For comparison, we present Dn(4000), HA index and EW(H) values by applying the Bruzual & Charlot (2003) (BC03) models of solar metallicity with exponentially declining star formation histories (). The gray solid lines represent the continuous star formation models with yr, and the gray dashed lines represent the star formation bursts with yr. Different lines represent the different characteristic timescales . The H luminosity was computed by converting Lyman continuum photons to H flux following Hunter & Elmegreen (2004, see equations B2-B4 in their appendix), and taking the recombination coefficients and flux ratio of H/H from Hummer & Storey (1987).
As shown in Figure 6, Dn(4000) EW(HA) and EW(H) derived from the SDSS 3-arcsec fiber spectrum are consistent with the measurements based on the long-slit spectra at galactic center. The central region of NGC 6145 shows very weak or no star formation activities, whose Dn(4000) is about 1.8 and EW(H) is less than 1 Å. In contrast to the central region, the outer regions are actively forming stars, since many outer regions have smaller 4000 Å break values (Dn(4000)1.4) and stronger H emission (EW(H)2 Å) .
In addition, some data points are located in the starburst region according to the BC03 models, as shown in the three diagrams in Figure 6. In a parallel paper, we found that almost all regions of galaxies strictly follow the continuous star formation models (BC03) based on the MaNGA (Bundy et al., 2015) data. This result is attained regardless of stellar mass and quenching status of the galaxy, indicating that starburst activities are rare in galaxies with regular morphologies (Wang et al. 2017, in preparation). However, some outer regions of NGC 6145 are obviously star-bursting, as indicated by all three diagrams.
NGC 6147 and MCG +07-34-022 are also plotted on the diagrams as red diamonds and squares. As noted above, MCG +07-34-022 is a star-forming galaxy with no HI emission, suggesting that it experienced recent gas removal. NGC 6147 has very weak star formation activities (sSFR12.6), and appears to have a small piece of HI distribution (smaller than the beam size) near its optical counterpart, which is likely a noise peak. We infer that the cold gas of NGC 6147 has probably been removed by external processes (Peng et al., 2010), such as ram-pressure stripping. Subsequently, the star formation activity could not be sustained without enough cold gas.
We note that the H emission is due to HII regions throughout NGC 6145, at least along its major axis. In particular, there is no evidence of shock-excited gas or AGN-excited gas, which can be traced by strong [OIII]5007 emission lines (Dopita, 1977). In addition, the flux ratios of [NII]/H, [OII]/H or [OI]/H are too weak to classify it as the shock-excited type (Dopita et al., 1984; Dopita & Sutherland, 1995). Our long-slit spectra show no or very weak [OIII]5007 emission along the whole slit (see two spectral examples in Figure 1).
4. Summary and Discussion
By using the HI datacube from the “Bluedisk” project (Wang et al., 2013), we presented and studied the peculiar HI morphology of the galaxy NGC 6145, which has an HI morphology that is not obviously induced by tidal or ram-pressure stripping. The optical long-slit spectra of NGC 6145 orientated along its major axis obtained with WHT (Carton et al., 2015) were also investigated.
The HI morphology of NGC 6145 is rather asymmetric, with a 150 kpc HI filament located to the west. This filament consists of several HI clouds, as shown in Figure 2. We have compared the HI morphology with other one-sided HI distributions presented in the literature, and found the HI distribution is different to the typical tidal or ram-pressure stripped HI shape, and it cannot be attributed to a pure accretion event. According to the HI distribution, we broadly separated the HI gas into five regions as shown in Figure 2. We found that the HI gas on the stellar disk (Cloud C) accounts for 29.8% of the total HI gas, while the Clouds A, B, D and E account for 11.2%, 7.7%, 12.7% and 19.4%, respectively. Furthermore, we analyzed the kinematics of the HI gas and found that Clouds A, B, D and E all have positive velocities with respect to NGC 6145. The velocity of the HI gas beyond the stellar disk gradually increases along the HI filament from Clouds A to E. To investigate the underlying physical mechanisms that account for the HI filament, we investigated the local environment of NGC 6145 and found three close companions at a similar redshift: NGC 6146, NGC 6147 and MCG +07-34-022. NGC 6147 and MCG +07-34-022 are much less massive than NGC 6145, while NGC 6146 is a more massive elliptical galaxy with extended radio emission. The direction of the radio jet roughly points to the HI gap between Clouds C and E in NGC 6145.
We also used the long-slit spectra of NGC 6145 along its major axis to study its star formation history. We radially binned our spectra with a bin size of 1.2 arcsec, and performed spectral fitting to derive the emission- and absorption-based parameters. We used the 4000Å break, H absorption index and H emission line equivalent width to trace the recent star formation histories (Bruzual & Charlot, 2003; Kauffmann et al., 2003). By investigating the diagrams of Dn(4000) vs. EW(HA), EW(HA) vs. EW(H) and Dn(4000) vs. EW(H), we found some outer regions along the major axis reside in the starburst region on the quenching diagnostic diagrams, while almost no star formation activities were found in galactic center (2 kpc).
There are some possible mechanisms that can account for the HI filament in NGC 6145, including accretion from nearby companions (NGC 6147 and MCG +07-34-022), tidal stripping by NGC 6146, ram-pressure stripping, the stripping by Jet NW and the combined effects of two or more processes.
The one-sided HI distribution in mergers or interactions usually hosts one or more companions, who trace the HI column density peaks (e.g. Phookun et al., 1992; Nordgren et al., 1997). However, in our case, two close companions of NGC 6145 do not reside in the HI filament, and they do not show disturbed features in SDSS image. This argues against the scenario that the HI filament formed only by the accretion from NGC 6147 and MCG +07-34-022. The shape of HI filament appears to be different to the typical tidal stripped HI tails, which are usually distributed roughly symmetrically on both sides of galaxy (Odenkirchen et al., 2001; Klimentowski et al., 2007; Rodruck et al., 2016), along with disturbed optical morphology and enhanced star formation in galactic center (Fujita, 1998; Li et al., 2008; Smith et al., 2010). NGC 6145 has enhanced star formation activities in the outer region, and not in the galactic center, which is inconsistent with the scenario that the HI filament is due to the tidal stripping by NGC 6146.
The positive LOS velocity of the filament with respect to NGC 6145 and the gradual change in the LOS velocity along the filament, can be naturally explained by the combined effects of ram-pressure stripping and rotation. Ram-pressure stripping is also able to produce the enhanced star formation activities seen in the stellar disk. However, the global HI distribution appears to be inconsistent with the ram-pressure stripping picture. Assuming that the HI filament is a ram-pressure stripped “tail”, the opening angle of the HI tail is nearly 180 degrees, measured with the vertex at the outer edge of the HI disk in the leading side. However, the opening angle of HI tail for typical ram-pressure stripped case is much narrower than seen here (e.g. Gavazzi et al., 1995; Kenney et al., 2004; Chung et al., 2009). It is also difficult to explain why Clouds A and E are more than 30 kpc away from the edge of stellar disk, along the direction perpendicular to the stripping direction.
An alternative explanation is that the formation of HI filament is due to the stripping by Jet NW from NGC 6146. It appears that the jet-stripping scenario works better in explaining the global HI shape than ram-pressure stripping scenario, although the direct evidence for jet-cold gas interaction has not yet been found in our data. One may doubt whether a narrow jet could produce the 150-kpc-scale HI distribution, and particularly Clouds A and B which do not lie along the jet axis. The HI filament may be produced under the jet stripping hypothesis if NGC 6145 has been going across the Jet NW from south to north, although this has not been demonstrated by hydrodynamic simulations. We note that there are some other HI gaps along the filament, and it is not known whether the jet-stripping picture could explain these gaps or not, as there is a lack of examples in the literature for a gas-rich disk galaxy being shot by an external narrow jet.
We also roughly estimated the energy required to produce the observed distortion in the HI distribution under the jet stripping scenario. Here for simplicity we just estimated the changes in the kinetic and gravitational energies of the stripped HI clouds under the following assumptions: 1) the velocity of the stripped gas perpendicular to the LOS is similar to its velocity along the LOS (180 km s-1 with respect to NGC 6145); 2) the stripped gas clouds originated from the nearest edges of the stellar disk of NGC 6145; and 3) the gravitational force on the stripped HI clouds is dominated by NGC 6145 instead of the other three companion galaxies. Thus the estimated total energy required is 61057 erg, which corresponds to a required power of 1042 erg s-1 by assuming an interaction timescale of 0.2 Gyr. The interaction timescale of 0.2 Gyr is estimated from the projected distance between the stripped HI clouds and the stellar disk, 40 kpc, and the velocity perpendicular to the LOS of 180 km s-1. This is consistent with the estimated jet power (), which indicates that the jet is strong enough to cause such an HI distribution.
In principle, a combination of early-time ram-pressure stripping of the HI gas from NGC 6147 and MCG +07-34-022, and subsequent accretion onto NGC 6145 could also explain the observed HI distribution, while this hypothesis could not be proved by our current observations.
The system we investigated is a good candidate for radio-jet and cold gas interaction. If the jet stripping scenario is true, this system provides an ideal laboratory to study the details of radio jet interactions with a gas-rich disk galaxy. However, more observations are needed to prove or disprove the jet-stripping scenario.
References
- Blanton et al. (2011) Blanton, M. R., Kazin, E., Muna, D., Weaver, B. A., & Price-Whelan, A. 2011, AJ, 142, 31
- Böhm et al. (2004) Böhm, A., Ziegler, B. L., Saglia, R. P., et al. 2004, A&A, 420, 97
- Bridle & Perley (1984) Bridle, A. H., & Perley, R. A. 1984, ARA&A, 22, 319
- Brinchmann et al. (2004) Brinchmann, J., Charlot, S., White, S. D. M., et al. 2004, MNRAS, 351, 1151
- Bruzual & Charlot (2003) Bruzual, G., & Charlot, S. 2003, MNRAS, 344, 1000
- Bundy et al. (2015) Bundy, K., Bershady, M. A., Law, D. R., et al. 2015, ApJ, 798, 7
- Calzetti et al. (2000) Calzetti, D., Armus, L., Bohlin, R. C., et al. 2000, ApJ, 533, 682
- Carton et al. (2015) Carton, D., Brinchmann, J., Wang, J., et al. 2015, MNRAS, 451, 210
- Cavagnolo et al. (2010) Cavagnolo, K. W., McNamara, B. R., Nulsen, P. E. J., et al. 2010, ApJ, 720, 1066
- Chang et al. (2015) Chang, Y.-Y., van der Wel, A., da Cunha, E., & Rix, H.-W. 2015, ApJS, 219, 8
- Chung et al. (2009) Chung, A., van Gorkom, J. H., Kenney, J. D. P., Crowl, H., & Vollmer, B. 2009, AJ, 138, 1741
- Clemens et al. (1999) Clemens, M. S., Baxter, K. M., Alexander, P., & Green, D. A. 1999, MNRAS, 308, 364
- den Heijer et al. (2015) den Heijer, M., Józsa, G. I. G., Kerp, J., et al. 2015, Astronomische Nachrichten, 336, 284
- Domínguez et al. (2013) Domínguez, A., Siana, B., Henry, A. L., et al. 2013, ApJ, 763, 145
- Dopita (1977) Dopita, M. A. 1977, ApJS, 33, 437
- Dopita et al. (1984) Dopita, M. A., Binette, L., Dodorico, S., & Benvenuti, P. 1984, ApJ, 276, 653
- Dopita & Sutherland (1995) Dopita, M. A., & Sutherland, R. S. 1995, ApJ, 455, 468
- Duc et al. (2000) Duc, P.-A., Brinks, E., Springel, V., et al. 2000, AJ, 120, 1238
- Fabian (2012) Fabian, A. C. 2012, ARA&A, 50, 455
- Farouki & Shapiro (1981) Farouki, R., & Shapiro, S. L. 1981, ApJ, 243, 32
- Fouqué et al. (2001) Fouqué, P., Solanes, J. M., Sanchis, T., & Balkowski, C. 2001, A&A, 375, 770
- Fraternali et al. (2002) Fraternali, F., van Moorsel, G., Sancisi, R., & Oosterloo, T. 2002, AJ, 123, 3124
- Fujita (1998) Fujita, Y. 1998, ApJ, 509, 587
- Fujita & Nagashima (1999) Fujita, Y., & Nagashima, M. 1999, ApJ, 516, 619
- Gavazzi et al. (1995) Gavazzi, G., Contursi, A., Carrasco, L., et al. 1995, A&A, 304, 325
- Ghisellini & Celotti (2001) Ghisellini, G., & Celotti, A. 2001, A&A, 379, L1
- Haynes et al. (2011) Haynes, M. P., Giovanelli, R., Martin, A. M., et al. 2011, AJ, 142, 170
- Henriksen et al. (1981) Henriksen, R. N., Vallee, J. P., & Bridle, A. H. 1981, ApJ, 249, 40
- Hibbard et al. (2000) Hibbard, J. E., Vacca, W. D., & Yun, M. S. 2000, AJ, 119, 1130
- Hibbard et al. (2001) Hibbard, J. E., van der Hulst, J. M., Barnes, J. E., & Rich, R. M. 2001, AJ, 122, 2969
- Hibbard & Yun (1999) Hibbard, J. E., & Yun, M. S. 1999, AJ, 118, 162
- Hummel et al. (1990) Hummel, E., van der Hulst, J. M., Kennicutt, R. C., & Keel, W. C. 1990, A&A, 236, 333
- Hummer & Storey (1987) Hummer, D. G., & Storey, P. J. 1987, MNRAS, 224, 801
- Hunter & Elmegreen (2004) Hunter, D. A., & Elmegreen, B. G. 2004, AJ, 128, 2170
- Icke (1985) Icke, V. 1985, A&A, 144, 115
- Irwin et al. (1987) Irwin, J. A., Seaquist, E. R., Taylor, A. R., & Duric, N. 1987, ApJ, 313, L91
- Kauffmann et al. (2003) Kauffmann, G., Heckman, T. M., White, S. D. M., et al. 2003, MNRAS, 341, 54
- Kaufman et al. (1999) Kaufman, M., Brinks, E., Elmegreen, B. G., et al. 1999, AJ, 118, 1577
- Kenney et al. (2004) Kenney, J. D. P., van Gorkom, J. H., & Vollmer, B. 2004, AJ, 127, 3361
- Kennicutt & Evans (2012) Kennicutt, R. C., & Evans, N. J. 2012, ARA&A, 50, 531
- Kennicutt (1989) Kennicutt, Jr., R. C. 1989, ApJ, 344, 685
- Klimentowski et al. (2007) Klimentowski, J., Łokas, E. L., Kazantzidis, S., et al. 2007, MNRAS, 378, 353
- Kormendy & Djorgovski (1989) Kormendy, J., & Djorgovski, S. 1989, ARA&A, 27, 235
- Kriek et al. (2011) Kriek, M., van Dokkum, P. G., Whitaker, K. E., et al. 2011, ApJ, 743, 168
- Lee & Chung (2015) Lee, B., & Chung, A. 2015, Publication of Korean Astronomical Society, 30, 491
- Li et al. (2008) Li, C., Kauffmann, G., Heckman, T. M., Jing, Y. P., & White, S. D. M. 2008, MNRAS, 385, 1903
- Li et al. (2005) Li, C., Wang, T.-G., Zhou, H.-Y., Dong, X.-B., & Cheng, F.-Z. 2005, AJ, 129, 669
- Li et al. (2015) Li, C., Wang, E., Lin, L., et al. 2015, ApJ, 804, 125
- Malphrus et al. (1997) Malphrus, B. K., Simpson, C. E., Gottesman, S. T., & Hawarden, T. G. 1997, AJ, 114, 1427
- Mayer et al. (2006) Mayer, L., Mastropietro, C., Wadsley, J., Stadel, J., & Moore, B. 2006, MNRAS, 369, 1021
- Moore et al. (1996) Moore, B., Katz, N., Lake, G., Dressler, A., & Oemler, A. 1996, Nature, 379, 613
- Nordgren et al. (1997) Nordgren, T. E., Chengalur, J. N., Salpeter, E. E., & Terzian, Y. 1997, AJ, 114, 913
- Odenkirchen et al. (2001) Odenkirchen, M., Grebel, E. K., Rockosi, C. M., et al. 2001, ApJ, 548, L165
- Okamoto et al. (2015) Okamoto, S., Arimoto, N., Ferguson, A. M. N., et al. 2015, ApJ, 809, L1
- Oosterloo et al. (2007) Oosterloo, T., Fraternali, F., & Sancisi, R. 2007, AJ, 134, 1019
- Peng et al. (2010) Peng, Y.-j., Lilly, S. J., Kovač, K., et al. 2010, ApJ, 721, 193
- Phookun & Mundy (1995) Phookun, B., & Mundy, L. G. 1995, ApJ, 453, 154
- Phookun et al. (1992) Phookun, B., Mundy, L. G., Teuben, P. J., & Wainscoat, R. J. 1992, ApJ, 400, 516
- Rodruck et al. (2016) Rodruck, M., Konstantopoulos, I., Knierman, K., et al. 2016, MNRAS, 461, 36
- Sault et al. (1995) Sault, R. J., Teuben, P. J., & Wright, M. C. H. 1995, in Astronomical Data Analysis Software and Systems IV, ed. R. A. Shaw, H. E. Payne, & J. J. E. Hayes, Vol. 77, 433
- Schneider et al. (1989) Schneider, S. E., Skrutskie, M. F., Hacking, P. B., et al. 1989, AJ, 97, 666
- Schombert (1988) Schombert, J. M. 1988, ApJ, 328, 475
- Serra et al. (2012) Serra, P., Jurek, R., & Flöer, L. 2012, PASA, 29, 296
- Shafi et al. (2015) Shafi, N., Oosterloo, T. A., Morganti, R., Colafrancesco, S., & Booth, R. 2015, MNRAS, 454, 1404
- Smith et al. (2010) Smith, R., Davies, J. I., & Nelson, A. H. 2010, MNRAS, 405, 1723
- Strom et al. (1983) Strom, R. G., Fanti, R., Parma, P., & Ekers, R. D. 1983, A&A, 122, 305
- Swaters et al. (2002) Swaters, R. A., van Albada, T. S., van der Hulst, J. M., & Sancisi, R. 2002, A&A, 390, 829
- Valluri & Jog (1990) Valluri, M., & Jog, C. J. 1990, ApJ, 357, 367
- van Gorkom et al. (2003) van Gorkom, J. H., Bravo-Alfaro, H., Dwarakanath, K. S., et al. 2003, Ap&SS, 285, 219
- Voges et al. (1999) Voges, W., Aschenbach, B., Boller, T., et al. 1999, A&A, 349, 389
- Wang et al. (2015) Wang, E., Wang, J., Kauffmann, G., Józsa, G. I. G., & Li, C. 2015, MNRAS, 449, 2010
- Wang et al. (2016) Wang, J., Koribalski, B. S., Serra, P., et al. 2016, MNRAS, 460, 2143
- Wang et al. (2013) Wang, J., Kauffmann, G., Józsa, G. I. G., et al. 2013, MNRAS, 433, 270
- Watkins et al. (2014) Watkins, A. E., Mihos, J. C., Harding, P., & Feldmeier, J. J. 2014, ApJ, 791, 38
- Wrobel et al. (1988) Wrobel, J. M., Harrison, B., Pedlar, A., & Unger, S. W. 1988, MNRAS, 235, 663
- Yang et al. (2007) Yang, X., Mo, H. J., van den Bosch, F. C., et al. 2007, ApJ, 671, 153
- Yun et al. (1994) Yun, M. S., Ho, P. T. P., & Lo, K. Y. 1994, Nature, 372, 530