Networks of Collaborations:
Hypergraph Modeling and Visualisation
Abstract
The acknowledged model for networks of collaborations is the hypergraph model. Nonetheless when it comes to be visualized hypergraphs are transformed into simple graphs. Very often, the transformation is made by clique expansion of the hyperedges resulting in a loss of information for the user and in artificially more complex graphs due to the high number of edges represented. The extra-node representation gives substantial improvement in the visualisation of hypergraphs and in the retrieval of information. This paper aims at showing qualitatively and quantitatively how the extra-node representation can improve the visualisation of hypergraphs without loss of information.
1 Introduction
Euler in 1736, with the Seven Bridges of Königsberg, was the first one to write a paper on a graph related problem. The word graph itself was introduced by Sylvester in 1878. A lot has been done since these days in particular theoretical developments during the first half of the twentieth century. With the increasing calculation power of computers, graphs have now taken an important practical place. The recent emergence of social networks as a means of retrieving information from data has boosted the use of graphs and hypergraphs. The rising of the Big Data era with its huge amount of data calls for powerful analytical and visualising tools. In addition to their modelisation and the identification of particular features, the study of such networks, including collaboration networks, has to address the retrieval of important information that can enrich the visual perception of the dataset.
The graph theory - the result of an extensive study of graphs over the years - provides the foundations for graph modeling. The first famous model was the random graph developed by Erdös and Renyi in 1959. It was followed by many others, such as the small-world model of Watts and Strogatz at the end of the 20th century, shown as being an illustration of the six handshakes lemma found by Karinthy in 1929 that stipulates that two persons in the world are no further away from any other people than six handshakes. In 2001, the work of Watts and Strogatz was enhanced by Albert and Barabasi in the modeling of scale-free networks.
At this point, the specifities of collaboration networks must be stressed. [New01] explains that collaborators of a publication have a -adic relationship - in the sense they are attached to the publication -, where is the number of collaborators in a collaboration. Nonetheless, this -adic relationship is approximated by a 2-adic relationship in between pairs of collaborators when it comes to be studied. The same approximation is made in many other studies such as [RDP04].
The reasons for this approximation are numerous. It enables the use of classical graphs techniques and properties when studying the different characteristics of collaboration networks, such as degree distribution, clustering coefficient, and when applying quantifying metrics. Today, many different techniques helping the retrieval of information from graphs are available. Amongst them, clustering techniques play an important role since they facilitate the extraction of information from networks. An efficient analysis algorithm that can be run on graphs is the Louvain’s algorithm introduced in [BGLL08], which is strongly based on the graph structure of the dataset; in this kind of algorithm the main issue is to give meaning to the resulting clusters.
This 2-adic relationship approximation has been developped in many articles, where even if the adic relationship of the data was pointed to be more pertinent, this -adic relationship was not used when getting to clustering. Since the end of the 2000s years, the limitations of the 2-adic approach is more and more challenged, as it leads to a partial loss of information contained in the -adic relationship. As a result, in [ERV05] the authors modelize complex networks by hypergraphs.
[Ber73] introduced hypergraphs as a means to generalize the graph approach. Hypergraphs preserve the -adic relationship becoming the natural modeling of collaboration networks. An hypergraph on a finite set of vertices (or nodes) is defined as a family of hyperedges where each hyperedge is a non-empty subset of and such that . This means that in an hypergraph, an hyperedge links one or more vertices. In [Bre13], this last hypothesis is relaxed to enable isolated vertices in hypergraphs, opening the use of hypergraphs in various collaboration networks. Actually, an hypergraph can also be seen as a set of sets.
Hypergraphs features are very similar to those of graphs with some arrangements to account for their differences in structure.
The order of the hypergraph is defined as .
The rank of an hypergraph is the maximum of the cardinalities of the hyperedges while the anti-rank corresponds to the minimum. An hypergraph is said simple if there’s no multiple hyperedges in between a set of nodes.
The node degree corresponds to the number of hyperedges that the node participates in. It is also designated as hyperdegree in some articles. The distance in between two nodes is the minimal number of hyperedges that connect the two nodes.
The incidence matrix of an hypergraph is the matrix whose rows represent the nodes and whose columns represent the hyperedges and where the coefficient when , and when .
The adjacency matrix of an hypergraph is a square matrix whose lines and rows represent the nodes and where the coefficient is the number of hyperedges where and are present together.
[ERV05] introduces particular features to characterize hypergraphs. The authors define the relationship between the adjacency and the incidence matrix as: where is the diagonal matrix containing vertex degrees. They evaluate the centrality of a node in a simple hypergraph, by orthogonalizing the adjacency matrix in , where is the diagonal matrix formed of the eigenvalues () of .
The sub-hypergraph centrality is defined as the sum of the closed walks of different lengths in the network, starting and ending at a given vertex.
The sub-hypergraph centrality can be calculated in a simple hypergraph as: .
They also define a clustering coefficient for an hypergraph as: where a hyper-triangle is defined as a sequence of three different vertices that are separated by three different hyperedges and a 2-path is a sequence
In [TCR10], the authors study the academic team formation using epistemic hypergraphs where hyperedges are subsets of unions of a set of agents and a set of concepts. They introduce new features to characterize the evolution of collaboration networks taking into account the hypergraphic nature of networks. This paper brings keystones in the study of a bidimensionnal hypergraph and show how the keeping of -adic relationships can help to gain in the understanding of the evolution of a network.
This paper aims at showing that network of collaborations have an efficient modelisation by hypergraphs and those hypergraphs have a suitable visualisation that enrich the data visualisation experience. It is to our knowledge the first time such an experimental comparison is made for hypergraphs visualisation. Section 2 a theoretical framework of collaboration networks viewed as hypergraphs. Section 3 provides a survey of the different representations of hypergraphs that can be done, the need of evaluation of such representations is pointed out. Finally Section 4 shows experimentally that efficient representation of such hypergraphs can be made to have a valuable visualisation that enhance the understanding of the underlying data.
2 Hypergraphs of Collaboration Networks
Different information such as authors and their affiliation to organisations can be retrieved from scientific publication metadata. Studying the relationships between authoring organisations helps having a better understanding of the world of science. This section aims at giving a theoretical framework of scientific collaboration networks.
Let consider that in a paper , there are organisations and countries where those organisations are seated. This group of organisations can be viewed as a set which is attached to paper as well as is the set of countries attached to .
Another revealing information contained in a publication is the keywords put by the authors, mentionned as author keywords. With the same approach, let be the set of the author keywords found in publication . , , constitute amongst other relevant information a multi-set of attributes from different dimensions found in publication . Performing a semantic search on a datastore for a particular topic will return a set of publications each having sets of authoring organisations, countries and keywords.
Some attributes are common to all or a part of the publications resulting from this search. For instance, from this set of papers, the set of cited organisations can be defined as . This set will form the set of nodes that will be represented in an hypergraph. The set of collaborations extracted from the paper can be viewed as an hyperedge. The same approach can be taken for countries or keywords, building two other uni-dimensional hypergraphs.
Of course this approach is transferable to any other relevant kind of attributes in an article such as city, journal categories,… Let be an attribute type that can be found in paper , in quantity. The set of attributes of type attached to this paper is . is the set of co-attributes instances.
As a consequence, attributes of type that are common to two papers and , are .
If a search is performed, then the set of values for the attributes of type in the results returned is . As there will be one set per paper, possibly empty, the search result for this attributes of type is a set of sets, written:
can be viewed as a set of nodes of attributes of type and as a set of hyperedges of coattributes of type .
The hypergraph
is the hypergraph of co- type attributes in the search . It is a representation of the collaborations of co- type attributes that are included in papers from search . There are as many hyperedges as the number of papers in which the team is involved. Also it can be valuable to set a weight to each different hyperedge with an initial value of 1. If there exist two hyperedges that are identical - that is two papers having the same set of attributes attached to it - then they can be merged into one hyperedge with a weight that is the sum of the weights of the two initial hyperedges. And the final hypergraph is a pondered hypergraph of teams of co- type attributes in the search S.
If an hypergraph corresponding to an other type is needed then the attributes of this type in the search S will lead to hypergraph Therefore, one can build a similar hypergraph for each attribute type in a publication metadata instance and create a set of typed hypergraphs each representing individual views on the multi-dimensional network and connected via subsets of paper metadata instances in .
This approach can be generalized to other datasets such as patents, allowing to view values of an attribute with a type common to different datasets into a single hypergraph. For instance, the hypergraph of authoring organisations for a search on patents and publications related a particular topic.
Ultimately, by building a multi-dimensional network organised around attribute types, one can retrieve very valuable information from combined data sources. This process can be extended to any number of data sources as long as they share one or more attribute types. If this is not the case, we will have unconnected networks that cannot be navigated accross.
3 Visualisation of Hypergraphs
Visualizing hypergraphs is an issue that can prevent their intensive use. In this Section a survey of existing hypergraph’s representations in litterature is done pointing out the issues raised and showing the need of comparison of the two main representations.
[ERV05] in an in-depth paper on hypergraphs have skimmed the subject of visualisation with only one kind of representation: the Venn’s diagram - a usual representation for sets - is relevant for small hypergraphs, but will be hard to use for large hypergraphs.
Based on the work of [Mak90], [Jun08] classifies the hypergraphs’ visualisations as the edge standard that makes connections between nodes of an hyperedge and the subset standard that makes closed curves encompassing these nodes. The Venn’s diagram is part of the subset standard.
In the edge standard, there are two main representations: the clique expansion and the extra- (or crux-) node representation. In the clique expansion, each node of an hyperedge is connected with all other nodes by an edge. Therefore an hyperedge of size is represented by edges. In the extra-node representation, only edges are needed. Though the potential gain is and is strictly positive above 3. These two views of one hyperedge are illustrated in Figure 1.
Nonetheless the gain in edges is only a potential gain. Some unfavorable case for extra-node representation can be easily exhibited as Figure 2 shows it. This implies to study carefully the distribution of hyperedges and the way they intersect. It outlines the need of deeper understanding of the pertinence of such an approach.
| Clique view | extra-node view |
|---|---|
| In this case: 10 edges, 5 nodes | In this case: 11 edges, 5 nodes and 3 extra-nodes |
[Jun08] focuses on the drawing of hyperedges so that they don’t intersect cluster groups, giving a solution based on force attraction/repulsion drawing of hyperedges. The author provides an interesting synthesis on the cognitive load of such representation. Nonetheless no systematic comparison between the clique and extra-node representation is made.
Some other hypergraphs’ representations exist such as the pie-chart node approach presented in [PT11], which is relevant for hypergraphs when hyperedges are not too intersecting one another. There is also the radial approach presented in [KJ13], which is surely valuable in the case of small order hypergraphs, but will be hard to implement for large hypergraphs. Some other techniques derived from set representations could be of interest. The interesting reader can refer to [AMA*16].
The rest of this study will focus on the two main views of an hypergraph: the clique view and the extra-node view. One can debate on the pertinence of each to represent collaboration networks. In the clique view, collaborations are seen as 2-adic interactions and the information on the meso-structure is lost, as shown in [TCR10]. In the extra-node view the -adic interactions preserve the information on individual collaborations. Keeping this -adic relationship is interesting for many reasons.
4 Experimental Approach
Prevalently, people and organisations are not working alone, they collaborate in teams that appear as co-authors in publications. The extra-node view preserves this information since different individual collaborations are represented as separate hyperedges enabling a direct visualisation of the contribution of individual collaborators into different collaborations which is clearly not possible with the clique view as shown on the Figure 2. Furthermore, large collaborations tend to be over-emphasized in the clique view which artificially enhances the visual perception of the relative importance of these collaborations in their respective clusters to the detriment of smaller collaborations with more activity (more co-publications, with less collaborators).
All these arguments show the importance of a detailed study, including statistics on potential gain and achieved gain as well as quantitative and qualitative comparison of the clique and extra-node view. This is presented in this section.
The study is conducted on a large collection of publications – about 45 M records of metadata instances - that has been processed to build a multidimensional network and store it in [Neo4j] a graph database. Cypher - the associated query language with Neo4j - is used to retrieve the values of vertex attributes of two types: organisation and keyword.
The first part of the study addresses the potential gain in edges with respect to all the organisations and authors keywords collaborations contained in the database in order to obtain a maximum value for this gain. This work has been done using 63 different semantic searches on topics of importance for particle physics. The second part evaluates quantitatively and qualitatively the gain obtained when toggling between the clique and the extra-node views. It aims to show that an enhanced visual perception is obtained through the extra-node view.
A laboratory environment has been developed to process all the organisation and keyword collaborations found in publications from individual search results and store them as hypergraphs that are then used to retrieve statistics and build both views. Before completing the rendering of individual views the Louvain clustering algorithm based on the work of [BGLL08] is performed on collaborations followed by a cluster visual positioning algorithm, ForceAtlas2 as exposed in [JVHB14] that calculates the coordinates of clusters using an energy-based mechanism. For facilitating comparisons between the two views of the same hypergraph, either ForceAtlas2 was performed on the clique view and transposed to the extra-node view or vice-versa.
4.1 Statistical approach
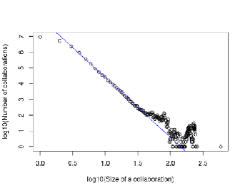
The distribution of collaborations for organisations amongst the collection of publication metadata records is shown in Figure 3 using log scales. In the linear part, the number of collaborations with size is given by: with a correlation coefficient of 0.9985. The average collaboration is 1.95.
The distribution of collaborations for author keywords is shown in Figure 4 using log scales. In the linear part, the number of collaborations with author keywords is given by: with a correlation coefficient of 0.9959. The average cardinality of co-(author keywords) set is 4.86.
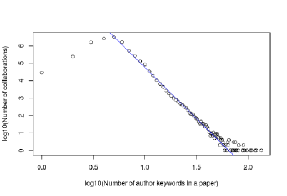
Table 1 shows the number of collaborations in the collection according to their size and the corresponding number of edges both in the clique and extra-node view. On average, the theoretical gain in edges - as defined in Section 4.3.1 - between the two views is nearly 3.
| 1 | 9,436,821 | x | x | x |
| 2 | 5,331,106 | 5,331,106 | 5,331,106 | 1 |
| 3 | 2,294,535 | 6,883,605 | 6,883,605 | 1 |
| 4 | 901,023 | 5,406,138 | 3,604,092 | 1.5 |
| 5 | 370,669 | 3,706,690 | 1,853,345 | 2 |
| 377,253 | 8,390,494 | 2,667,516 | 3.15 | |
| 74,102 | 3,572,175 | 616,380 | 5.80 | |
| 14,415 | 2,110,470 | 253,194 | 8.34 | |
| 10,776 | 4,617,743 | 309,694 | 14.91 | |
| 3,043 | 7,387,620 | 210,079 | 35.16 | |
| 920 | 17,637,388 | 175,739 | 100.36 | |
| Sum | 18,814,663 | 65,043,429 | 21,904,750 | 2.97 |
Table 2 shows the number of occurences according to the cardinal of the co-(author keywords) set and the corresponding number of edges both in the clique and extra-node view. On average, the theoretical gain in edges between the two views is nearly 2.2.
| 1 | 29,203 | x | x | x |
| 2 | 236,099 | 236,099 | 236,099 | 1 |
| 3 | 1,530,790 | 4,592,370 | 4,592,370 | 1 |
| 4 | 2,568,366 | 15,410,196 | 10,273,464 | 1.5 |
| 5 | 3,074,370 | 30,743,700 | 15,371,850 | 2 |
| 2,556,805 | 50,053,697 | 17,098,753 | 2.93 | |
| 73,330 | 4,929,632 | 883,074 | 5.58 | |
| 7,570 | 1,086,347 | 131,676 | 8.25 | |
| 3,243 | 1,079,835 | 83,424 | 12.94 | |
| 65 | 135,482 | 4,154 | 32.61 | |
| 5 | 34,075 | 584 | 58.35 | |
| Sum | 10,079,846 | 108,301,433 | 49,630,119 | 2.22 |
This is only a potential gain since it highly depends on how the hyperedges are intersecting one another. As a consequence, an experimental evaluation of the gain in edges has to be performed.
4.2 Qualitative approach
The qualitative approach consists in generating hypergraphs of organisations or keywords from a subset of the collections of publication metadata records. The aim is to have a human visual comparison of the hypergraphs visualized as clique and extra-node views and a methodology to perform such representations.
From the 63 searches performed, 22 gave very large data set results leading to extremely complicated graphs that are not directly exploitable for the comparisons between the two views. As a consequence the graphical comparison is made over a set of 41 searches. A typical example is given with a search on BGO - Bismuth Germanium Oxyde - crystals.
Table 3 gives statistics. The average size of collaborations are relatively similar for organisations and author keywords. Nonetheless the gain in edges is much greater for the representations of co-organisations than in the co-(author keywords’) ones ; this is due to the very variable size of collaborations of organisations while the number of author keywords is not so different from one publication to another.
| Organisations | Author keywords | |||
| Clique view | extra-node view | Clique view | extra-node view | |
| Number of collaborations | 169 | 193 | ||
| Average size of collaborations | 3.83 | 4.48 | ||
| Number of nodes | 349 | 439 | 597 | 783 |
| Number of edges | 2639 | 647 | 1699 | 864 |
| Gain in edges | 4.07 | 1.97 | ||
The benchmark program has been configured to transfer the coordinates calculated by ForceAtlas2’s algorithm from one hypergraph representation to the other.
This transfer was made two ways: either calculation of the coordinates on the clique view and transfer to the nodes of the extra-node view - the extra-node is always considered as the isobarycenter of the hyperedge - or reciprocally.
Sub-figure 5
(a): Clique representation: The coordinates of nodes are calculated
by ForceAtlas2 on the extra-node view and then transfered to this
view.
Sub-figure 5 (b): extra-node representation: The coordinates of nodes are calculated by ForceAtlas2 for this representation.
title:((bgo AND cryst*) OR (bgo AND calor*)) abstract:((bgo AND cryst*) OR (bgo AND calor*))
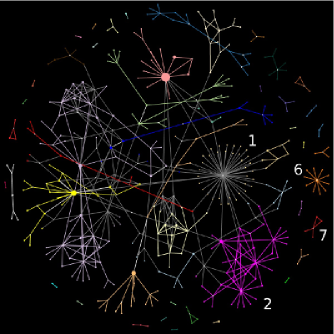
When transfering the coordinates from the extra-node representation to the clique view as shown on Figure 5, the nodes tend to be well distributed on the canvas. This phenomena finds its source in the fact that for the same hypergraph the extra-node representation is less linked than the clique representation. Also, when computing ForceAtlas2, the nodes tend to be more repulsed from the centrum.
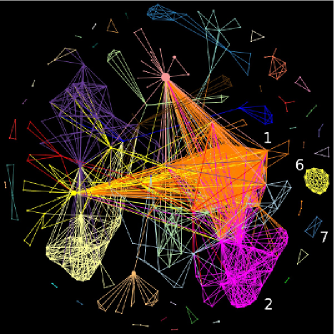
Transfering it the other way, as it is shown in Figure 6, lead to more gathered views, giving a better visual impact. This is the case for all the 41 searches, both for organisations hypergraphs and co-(author keywords) hypergraphs.
In Figure 6, it is interesting to see how the large collaboration numbered 1 expands into what looks like just a one shot collaboration, while, Group 2, which was seen as less important in the clique view appears to be a real network of collaborators in the extra-node view. In Groups 3, 4 and 5 some internal collaborations appear that couldn’t be seen in the clique representation.
In Figure 5, Group 6 is viewed as a single collaboration when it appears as extended in the extra-node view, while Group 7 is viewed as one collaboration in the clique view and in fact is represented as two collaborations in extra-node view.
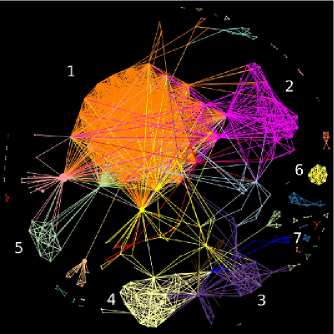
Sub-figure 6 (a): Clique representation view of the hypergraph: coordinates are calculated by ForceAtlas2 in this representation
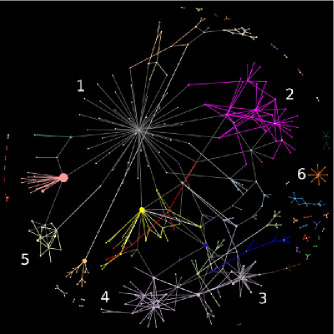
Sub-figure 6 (b): extra-node representation of the hypergraph: coordinates are calculated by ForceAtlas2 in the clique node representation and transfered to this one.
title:((bgo AND cryst*) OR (bgo AND calor*)) abstract:((bgo AND cryst*) OR (bgo AND calor*)): organisations
The same observation can be made for co-(author keywords) as shown in Figure 7 (a) and (b) where the coordinates are first calculated for the extra-node representation of the hypergraph by ForceAtlas2 and then transfered to the clique view. In these representations, the different peripheral hyperedges remain the same in both views, even though the representation is lighter in the extra-node view than in the clique view. The main improvement is in the central part of the hypergraph for intricated hyperedges. In this case, the extra-node view provides a good improvement of the visualisation perception.
In Figure 8 (a) and (b), the calculation of coordinates is made on the clique view and then transferred to the extra-node view. The same remarks than in Figure 7 apply. Nonetheless the computation of the coordinates by ForceAtlas2 on the clique view leads to improvements in the gathering of the nodes when it comes to the extra-node view. Hence again, the computation of the coordinates on the clique expansion of the hypergraph, and their transfer to the extra-node expansion gives better results for visualisation.
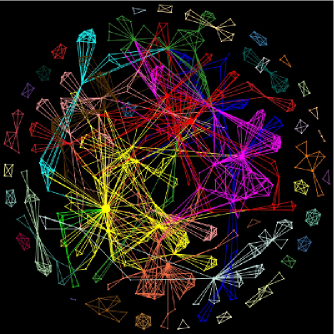
Figure 7 (a) Extension of the hypergraph by clique: nodes’ coordinates are calculated on the extra-node representation.
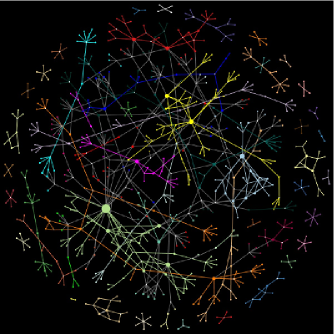
Figure 7 (b) Extension of the hypergraph by extra-node: nodes’ coordinates are generated by ForceAtlas2
title:((bgo AND cryst*) OR (bgo AND calor*)) abstract:((bgo AND cryst*) OR (bgo AND calor*))
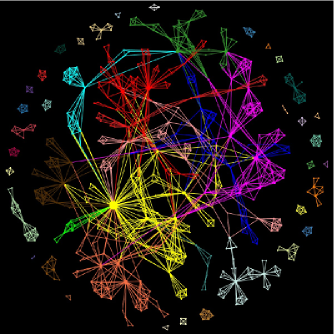
Figure 8 (a) Extension of the hypergraph by clique: coordinates are calculated by ForceAtlas2 directly.
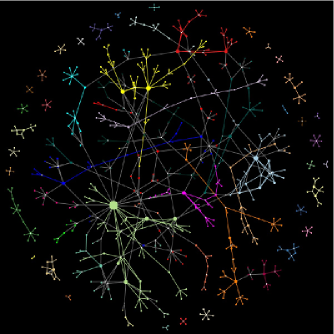
Figure 8 (b) Extension of the hypergraph by extra-node: coordinates are calculated on the clique graph extension.
title:((bgo AND cryst*) OR (bgo AND calor*)) abstract:((bgo AND cryst*) OR (bgo AND calor*))
In conclusion, the visual perception is significantly enhanced in the extra-node view. But in order to get better results, the nodes’ coordinates must be calculated taking into account the strength of individual hyperedges, as the transfer of coordinates in between the nodes between these two views leads to an enhanced visual perception.
In these examples the qualitative approach highlights some common facts. The extra-node views enhance the main connecting nodes as it is easier to visualize. The number of clusters is often greater in the extra-node than in the clique view. This can be explained by the smaller connectivity of the nodes. Large collaborations tend to crush all other collaborations in the clique view while they are given their right place in the extra-node views. For diffused hypergraphs, where there are a lot of connections between hyperedges, the extra-node view brings simplifications.
4.3 Quantitative approach
To help analysing the gain made in between the clique and extra-node views of hypergraphs, an objectivization of the approach by quantitative measures has been performed. The first feature that seems important is the gain in edges. The second aims at evaluating the gain in visual complexity of the graph. The third gives back information on the gain in information via the calculation of entropy.
4.3.1 Gain in edges
Potential gain in edges on the overall dataset for organisations can be computed. For this purpose, the size of each collaboration retrieved from the overall dataset has been measured. This case can be seen as the optimistic case and results has been presented in the Table 1, in which the gain in edge is defined by the formula:
where - resp. - is the number of edges in the clique view - resp. extra-node view - of the hypergraph.
Table 1 has shown a maximal theoretical ratio that can be obtained when the hypergraph’s representation changes from clique view to extra-node view for organisations. Nonetheless it is a maximal theoretical gain in edges as some hyperedge(s) can be included in larger hyperedge as it has been show in Figure 2. It is then of interest to know how the gain in edges behaves in function of the average size of collaborations in the hypergraphs.
Statistics have been performed to retrieve the real gain in edges on each of the 63 searches. The results have been grouped by kind of searches and the summary is presented in Table 4. is the first quartile, the second and the third one.
| Organisations | 4,54 | 14,27 | 0,98 | 1,13 | 1,47 | 34,9 % |
| Author keywords | 1,97 | 0,29 | 1,81 | 1,97 | 2,08 | 0 % |
This data in Table 4 shows that the gain in edges is always in favour of the extra-node approach in the case of the author keywords. For the organisations, the gain is still in favour of the extra-node approach. The average gain is much higher due to the fact that some searches returned very big collaborations, exploding the number of edges in the clique view. This is due to the high variability of size of collaboration in the case of organisations (up to 450 collaborators, with smooth distribution) compared to author keywords (up to 130, with more tightened distribution).
Figure 9 shows the gain in edges versus the average size of the hyperedges. The gain in edges increases in both cases when the average size of hyperedges increases. It shows that the gain for organisations, with hyperedges of average size less than 2.5 gives an increase in the number of edges. For the author keywords, the average size of the collaboration is bigger than in the average organisations case, and therefore leads to a higher gain in edges for all the hypergraphs of co-author keywords. As it can be seen on Figure 9a, there are some searches that are underfitting or overfitting the general tendency due to less or more intersecting collaborations.
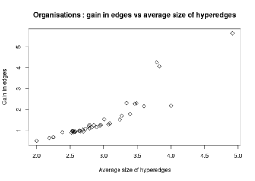 |
| Sub-figure a: Case of the organisations |
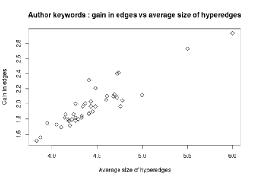 |
| Sub-figure b: Case of author keywords |
4.3.2 Gain in visual complexity
The purpose of this sub-section is to evaluate the gain in cognitive load of the hypergraphs represented. The hypothesis made is that for a given hypergraph where the coordinates of the nodes are similarly calculated represented with a black background, the more black pixels the image has, the better the contrast with the other colors will be and the clearer the representation will be. The hypothesis on similarly calculated is important otherwise the clearest view is a one coloured pixel graph, which is of no interest. The clarity of a graph is introduced as
Also each generated hypergraph view has been exported in a raster format, and the ratio of black pixels on the overall image has been computed. To compare both views the clarity gain is introduced as :
Table 5 shows the results for the 41 searches that were used in the qualitative approach.
| Force Atlas on: | extra-node graph | clique graph | |||||
|---|---|---|---|---|---|---|---|
| Number of images | 41 | 41 | |||||
| Average | 0.69 | 0.81 | 1.21 | 0.74 | 0.84 | 1.16 | |
| Standard deviation | 0.16 | 0.11 | 0.17 | 0.15 | 0.10 | 0.14 | |
| Q1 | 0.57 | 0.75 | 1.08 | 0.63 | 0.79 | 1.06 | |
| Q2 | 0.73 | 0.84 | 1.16 | 0.78 | 0.87 | 1.12 | |
| Q3 | 0.82 | 0.89 | 1.24 | 0.86 | 0.91 | 1.19 | |
Sub-table (a) Case of organisations
| Force Atlas on : | extra-node graph | clique graph | |||||
|---|---|---|---|---|---|---|---|
| Number of images | 41 | 41 | |||||
| Average | 0.54 | 0.71 | 1.35 | 0.64 | 0.78 | 1.25 | |
| Standard deviation | 0.12 | 0.11 | 0.13 | 0.12 | 0.09 | 0.11 | |
| Q1 | 0.44 | 0.65 | 1.28 | 0.55 | 0.73 | 1.17 | |
| Q2 | 0.53 | 0.73 | 1.37 | 0.65 | 0.81 | 1.24 | |
| Q3 | 0.60 | 0.77 | 1.43 | 0.72 | 0.83 | 1.31 | |
Sub-table (b) Case of author keywords
For organisations, the average clarity of the extra-node view is always better. The gain is better in extra-node coordinates’ computation, but the clarity remains lower than the one obtained in the clique coordinates’ computation in the extra-node view. This is the case for all the 41 searches in accordance with what was expected in the qualitative approach.
Similar results are obtained for author keywords; the best clarity is obtained for the extra-node view where coordinates have been calculated on applying ForceAtlas2 to the clique view and transfered to the extra-node view.
As a conclusion, this gain index confirms that the best clarity is obtained with the extra-node view, independently of the way of calculating the coordinates in most of the case for organisations and always for author keywords.
4.3.3 Entropy and gain in information
In this section the entropy of the images will be calculated to show that graphs generated with ForceAtlas2 on clique view and transfer to extra-node view are better organized.
The entropy is a good way to know the degree of organisation of an image. If a set of things is well organized then the entropy is low. On the other end, if things are not organized entropy is high. Entropy was first introduced by [Sha48].
The entropy is defined here as :
A uniform distribution of black pixels achieved when maximizes the entropy to a value of 1. The lower the entropy the more organized the rendering will appeared.
Table 6 shows the results for the 41 searches that were used in the qualitative approach.
| Force Atlas on: | extra-node graph | clique graph | |||
| Number of images | 41 | 41 | |||
| Average | 0.80 | 0.65 | 0.75 | 0.60 | |
| Standard deviation | 0.19 | 0.20 | 0.20 | 0.20 | |
| Q1 | 0.68 | 0.51 | 0.60 | 0.44 | |
| Q2 | 0.85 | 0.64 | 0.77 | 0.55 | |
| Q3 | 0.96 | 0.80 | 0.95 | 0.73 | |
Sub-table (a) Case of organisations
| Force Atlas on : | extra-node graph | clique graph | |||
| Number of images | 41 | 41 | |||
| Average | 0.95 | 0.82 | 0.90 | 0.71 | |
| Standard deviation | 0.08 | 0.16 | 0.11 | 0.17 | |
| Q1 | 0.937 | 0.772 | 0.858 | 0.660 | |
| Q2 | 0.980 | 0.837 | 0.934 | 0.703 | |
| Q3 | 0.996 | 0.935 | 0.990 | 0.843 | |
Sub-table (b) Case of author keywords
These results show in both cases - author keywords and organisations - that the entropy is the lowest in the extra-node view with coordinates calculated by the clique representation. It confirms that this representation of hypergraphs gives the best results in term of structured information.
4.3.4 Quantitative approach main teachings
Two indices have been built to help quantifying the gain both in visuality and in the number of edges. The clarity index is particularly relevant to quantify the quality of the final view of the hypergraph. This is confirmed by the entropy indicating how well structured the views are.
On the one hand this clarity index is used in comparison between the two views of the same hypergraph, and it is more the relative positioning and gain than the absolute value of this index that is important. On the other hand the entropy allows a global comparison.
Both clarity index and entropy show that the best approach for the visualisation for author keywords hypergraphs is nearly always in the extra-node view with coordinates calculated in ForceAtlas2 in clique view. Entropy confirms with more strength the results obtained by clarity by itself.
The gain in edges when switching from the clique view to the extra-node view is also often bigger, and in very large graphs it can be quite high. This can solve some problems of computability for large graphs with very large collaborations.
5 Conclusion
Hypergraphs allow a better rendering of the structure of publications, and retain in some kind the footprint of the article structure.
Hypergraphs rendering can bring a lot of visual information. The visual rendering of such hypergraphs is challenging, and was central to this research. The clique view approach allows the rendering of large hyperedges, but hides small colaborations in between players of large collaborations. These large collaborations are over emphasized even when occuring only once. This phenomena disappears in the extra-node view where each collaboration has the same visual impact potential, and can be viewed directly.
Nonetheless, the tied links of hyperedges which are expressed in the clique view allows the gathering of the nodes when it comes to place them. In the extra-node view, as the nodes are less linked, they tend to spread out all over the view. Therefore this study provides a way of setting coordinates to the nodes of the extra-node view taking into account hyperedges’ specificity through the calculation of coordinates via the clique view. Moreover the experimental part brings a positive answer to the usage of the extra-node view for visualisation of hypergraphs of collaborations. Using organisations and author keywords were the distribution of the cardinalities of hyperedges are very different allows to generalize this result. Furthermore this work highlights new indicators that can help evaluating the visual impact and gain in cognitive load of the chosen representation.
This work has shown that the extra-node view is a reliable way of showing hypergraphs where hyperedges’ structure is preserved. Hypergraphs are a useful model for collaborative network and their visualisation. Future work should include a study on other nodes’ placements using other rendering than the one of ForceAtlas2 to confirm the results obtained in this paper. This can be done by focusing on new layouts of hypergraphs that can enhanced the visual perception of the data set and the enrichment allowed by hypergraphs.
6 Acknowledgments
We are really thankful to all the team of Collaboration Spotting from CERN - supervised by Jean-Marie LE GOFF - for all the exchanges we had: Adam AGOCS, Dimitris DARDANIS, Dimitri PROIOS, and Tim HERWERCK.
This work was started during the master thesis of Xavier Ouvrard,
who is really thankful to Laurent PHILIPPE of University of Bourgogne
Franche-Comté for his supervision. This work is continued during the
PhD of Xavier OUVRARD, done at CERN in the Collaboration Spotting
project.
?refname?
- [AMA*16] B. ALSALLAKH, L. MICALLEF, W. AIGNER, H. HAUSER, S. MIKSCH and P. RODGERS. The State-of-the-Art of Set visualisation. Computer Graphics, Volume 35 (2016), number 1 pp. 234-260. doi : 10.1111/cgf.12722. 2016.
- [Ber73] C. BERGE. Hypergraphs: Combinatories of finite sets. North-Holland Mathematical Library, Volume 45. 1973.
- [BGLL08] V.D. BLONDEL, J.L. GUILLAUME, R. LAMBIOTTE, E. LEFEBVRE. Fast unfolding of communities in large networks. Journal of Statistical Mechanics: Theory and Experiment 2008 (10), P10008 (12pp) doi : 10.1088/1742-5468/2008/10/P10008. 2008.
- [Bre13] A. BRETTO. Hypergraph Theory, An introduction. Springer. ISBN 978-3-319-00079-4. doi : 10.1007/978-3-319-00080-0. 2013.
- [CERN] CERN Collaboration spotting http://collspotting.web.cern.ch/
- [ERV05] E. ESTRADA, J. A. RODRIGUEZ-VELASQUEZ. Complex Networks as Hypergraphs. arXiv:physics/0505137v1. 2005.
- [JVHB14] M. JACOMY, A. VENTURINI, S. HEYMANN, M. BASTIAN. ForceAtlas2, a Continuous Graph Layout Algorithm for Handy Network Visualization Designed for the Gephi Software. PLoS ONE 9(6): e98679. doi: 10.1371/journal.pone.0098679. 2014
- [Jun08] M. JUNGHANS. Visualisation of Hyperedges in Fixed Graph Layouts. Diplomarbeit_Junghans. 2008
- [KJ13] A. KEREN, I. JUSUFI. A Novel Radial visualisation Approach for Undirected Hypergraphs. The Eurographics Association. doi : 10.2312/PE.EuroVisShort.EuroVisShort2013.025-029. 2013.
- [Mak90] E. MÄKINEN. How to Draw a Hypergraph. International Journal of Computer Mathematics, Volume 34, Issue 3-4. doi : 10.1080/00207169008803875. 1990.
- [Neo4j] https://neo4j.com/
- [New01] M.E.J. NEWMAN. Scientific collaboration networks. I. Network construction and fundamental results & II. Shortest paths, weighted networks, and centrality. Physical Review E, VOLUME 64, 016131 & 016132. doi : 10.1103/PhysRevE.64.016131 & doi : 10.1103/PhysRevE.64.016132. 2001.
- [PT11] J. PAQUETTE and T. TOKUYASU. Hypergraph visualisation and enrichment statistics: how the EGAN paradigm facilitates organic discovery from Big Data. Proceedings of the SPIE, Volume 7865, id. 78650E-78650E-18. doi : 10.1117/12.890220. 2011.
- [RDP04] J.J. RAMASCO, S. N. DOROGOVTSEV and R. PASTOR-SATORRAS. Self-organization of collaboration networks. Physical Review E 70 , 036106. doi : 10.1103/PhysRevE.70.036106. 2004.
- [Sha48] C.E. SHANNON. A Mathematical Theory of Communication. Bell System Technical Journal. 27 (3): 379–423. doi : 10.1002/j.1538-7305.1948.tb01338.x. 1948.
- [TCR10] C. TARAMASCO, J.P. COINTET, C. ROTH. Academic team formation as evolving hypergraphs. Scientometrics 85: 721. doi : 10.1007/s11192-010-0226-4. 2010.