Noise-induced Synchronization of Crystal Oscillators
Abstract
Experimental study on noise-induced synchronization of crystal oscillators is presented. Two types of circuits were constructed: one consists of two Pierce oscillators that were isolated from each other and received a common noise input, while the other is based on a single Pierce oscillator that received a same sequence of noise signal repeatedly. Due to frequency detuning between the two Pierce oscillators, the first circuit showed no clear sign of noise-induced synchronization. The second circuit, on the other hand, generated coherent waveforms between different trials of the same noise injection. The waveform coherence was, however, broken immediately after the noise injection was terminated. Stronger modulation such as the voltage resetting was finally shown to be effective to induce phase shifts, leading to phase–synchronization of the Pierce oscillator. Our study presents a guideline for synchronizing clocks of multiple CPU systems, distributed sensor networks, and other engineering devices.
pacs:
XXpacs:
05.45.Xt, 05.45.Tp, 82.40.NpI Introduction
Synchronization is a ubiquitous phenomenon of coupled nonlinear oscillators found in a diverse fields of science and engineering. During the last several decades, remarkable progress has been made in both theory and experiment on synchronization of limit cycle and chaotic oscillators Winfree (2001); Kuramoto (1984); Pikovsky et al. (2003). Although the most common situation presumes that the oscillators are directly coupled with each other, indirect interaction through commonly injected noise sources has been also known to synchronize uncoupled oscillators. It has been proven theoretically that a wide class of uncoupled limit-cycle oscillators can be in-phase synchronized by common weak white noise Teramae and Tanaka (2004). The theoretical framework has been extended to random impulses Arai and Nakao (2008a); Nagai and Nakao (2009), general, colored and non-Gaussian, noise Goldobin et al. (2010), and also in the presence of uncommon noise Nakao et al. (2007). Chaotic oscillators can be also synchronized by noise inputs Lai and Zhou (1998); Rim et al. (2000); Zhou and Kurths (2002); Yoshimura et al. (2007).
Experimental systems that show the noise-induced synchronization include neuronal systems Mainen and Sejnowski (1995); De La Rocha et al. (2007); Galán et al. (2006), circuit systems Nagai and Nakao (2009); Arai and Nakao (2008b); Yoshida et al. (2006) and laser systems Sunada et al. (2014); Tomiyama et al. (2018). Despite intensive studies on noise-induced synchronization in a scientific framework, its application to engineering problems remains open. Natural environmental sounds have been utilized as a noise source to synchronize simulated network of distributed sensors Yasuda and Hasegawa (2013). Numerical study showed that noise can synchronize spin torque oscillators to overcome the problem of low output power in their array Nakada et al. (2012).
In the present study, we apply the method of noise-induced synchronization to crystal oscillators Vittoz et al. (1988); Matthys (1983). The crystal oscillator is an electronic circuit composed of a piezoelectric resonator that determines the oscillation frequency. Because of its highly precise and stable oscillations, it has been widely used to provide clock signals to a variety of digital circuits and to stabilize frequencies of radio transmitters and receivers. The clock rate of a central processing unit (CPU) is also determined by the frequency of the crystal oscillator. Under these circumstances, synchronized operation of multiple clocks should be of significant importance in a future technology. For instance, to further accelerate the clock speed in CPUs, it is getting extremely difficult to integrate all the circuit elements into a single chip, because of the increased number of transistors, which should be located within a limited-size chip. Diving the CPU into multiple chips is inevitable, thereby synchronizing the clocks of the divided chips should be an essential requirement. As a source of the noise to synchronize the oscillators, utilization of the internal noise, which exists inherently within circuit itself, should be advantageous in terms of an economical recycling of the oscillation energy. A variety of further applications, e.g., synchronizing the clocks of distributed sensors and CPUs, should be found. Towards establishment of a basis for such technologies, we present here an experimental study on noise-induced synchronization of the crystal oscillators. Two types of circuits were constructed: (1) Two Pierce oscillators that were isolated from each other and received a common noise input; (2) A single Pierce oscillator that repeatedly received a same noise input. As the external input signals, white Gaussian noise, Poisson spike trains, and reseting signals were applied to the circuits. Our study may provide a guideline for synchronizing clocks of multiple CPU systems, distributed sensor networks, and other engineering devices.
The present paper is organized as follows. Section II briefly introduces the theoretical framework for noise-induced synchronization of limit cycle oscillators. Section III implements two isolated Pierce oscillator circuits, to which common noise inputs were applied. Section IV applies a same noise input repeatedly to a single Pierce oscillator circuit to examine whether coherence of the output waveforms is increased by the same noise injection. Section V examines the effect of voltage resetting on the phase dynamics of the Pierce circuit. The final Section is devoted to conclusions and discussions of this study.
II Theory of Noise-induced Synchronization
We consider two identical non-interacting limit cycle oscillators driven by a common noise
| (1) |
where are indices for the two oscillators and represents Gaussian white noise with and ( represents statistical average). It is assumed that the noise is applied only in the direction in the state space. By applying the phase reduction Kuramoto (1984), the oscillator dynamics is reduced to the following phase equation
| (2) |
where represents phase sensitivity function of the oscillator with respect to perturbation applied in the direction . Denoting the phase difference by , subtraction of the two phase equations yields
| (3) | |||||
where the phase sensitivity function was expanded as for sufficiently small phase difference . The logarithm of the absolute phase difference therefore obeys
| (4) |
Thus, growth rate of is determined by the mean Lyapunov exponent , which is statistically averaged over noise. For the Gaussian white noise, the Lyapunov exponent is calculated as , implying that shrinks on average and the oscillators get eventually synchronized with each other. This holds for arbitrary limit cycle oscillators regardless of the detailed dynamics as long as is differentiable Teramae and Tanaka (2004). The theoretical framework has been extended to random impulses Arai and Nakao (2008a); Nagai and Nakao (2009), general, colored and non-Gaussian, noise Goldobin et al. (2010), in the presence of uncommon noise Nakao et al. (2007), and also to chaotic oscillators Yoshimura et al. (2007).
The crystal circuit system generates limit cycle oscillations, which fall within the above theoretical framework. In the following Sections, we experimentally apply common noise inputs to the crystal oscillator system.
III Two Uncoupled Pierce Circuits
As the piezoelectric crystal oscillator circuits, two Pierce oscillators Pierce (1923), each of which was composed of a single digital inverter (Toshiba 74HCU04AP), one resistor, two capacitors, and one quartz crystal ( kHz, SII VT-200-F), were built as shown in Fig. 1 (a). The inverters ( and ) amplified oscillations of the crystals ( and ) with feedback resistors ( and ), while the capacitors (, , , and ) adjusted their oscillation frequencies. The output signals, denoted as and , respectively, were generated through the buffers ( and ). To isolate the two Pierce oscillators from each other, Schottky diodes ( and ) that rectified their inputs were inserted. The coupling capacitors ( and ) passed the alternating input signals, while the resistors ( and ) discharged them. Physical parameters of the electric components used in the present experiment are summarized in Table 1. To inject a common noise input, a function generator (Keysight 33500B), which generates various noise signals including white Gaussian noise and Poisson spike trains, was utilized. The output voltages (, ) were simultaneously observed by an oscilloscope (Keysight InfiniiVision DSOX2014A) and recorded into a data logger (Keyence NR-600 and NR-HA08) with a sampling frequency of kHz and with a data point of .
To quantify the level of synchronization between the two crystal oscillators, correlation coefficient between the two outputs, and , was computed. To study dependence of the synchronization on the noise strength, peak-to-peak voltage of the input noise was increased from 0 to 10 V. Fig. 1 (b) shows the results of applying Gaussian white noise. For each setting of the noise strength, measurements were repeatedly made with different realizations of the noise signals and their average was drawn with the standard deviation indicated by the error-bar. The correlation coefficient remains close to zero even if the noise strength is increased to the maximum level of 10 V. Fig. 1 (c), on the other hand, shows the results of applying Poisson spike trains with an average spike frequency of 32.768 kHz, which is close to the natural frequency of the crystal oscillator. Again, the correlation coefficient stays close to the zero line up to the maximum spike amplitude of 9 V. The results were the same for different setting of the spike frequency, which was varied as ??, with the peak-to-peak voltage set to 9 V (Fig. 1 (d)).
To visualize the inter–relationship between the two Pierce circuits, Lissajous plot of vs. was drawn for the Poisson spike input (amplitude: 9 V, average frequency: 32.768 kHz) in Fig. 1 (e). The phase plots, which filled the entire square region, showed no sign of coherence. This indicates that the noise-induced synchronization was not observed for the present two uncoupled crystal oscillator circuits. As shown in Yoshimura et al. (2007), noise-induced synchronization is, in a strict sense, not achievable in the presence of frequency detuning between the two limit cycle oscillators. To observe synchronization, frequency mismatch, which inevitably exists between the two crystal oscillators, should be largely reduced.
(a)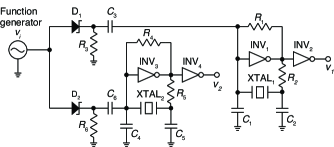 (b)
(b)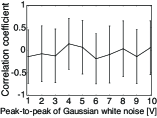 (c)
(c)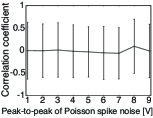 (d)
(d)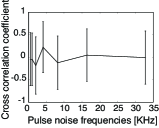 (e)
(e)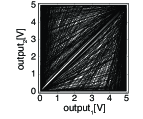
| Circuit elements of Pierce oscillators | |
|---|---|
| and | KHz |
| , , and | 74HCU04AP |
| and | M |
| , , and | pF |
| Unidirectional input paths | |
| and | BAT43 |
| and | k |
| and | pF |
IV Single Pierce Circuit with Repeated Noise Injection
In the previous Section, we have seen that the noise-induced synchronization was not observed for the two uncoupled crystal circuit systems. The frequency mismatch, which inherently exists between the two circuits, is considered as one of the primary causes that prevented the synchrony. In order to exclude such primary cause, here, we utilize a single Pierce oscillator circuit. By repeatedly injecting a same noise sequence to the circuit, we may measure the coherence of the circuit outputs between different trials. By considering that each trial output is generated from different circuit having exactly the same oscillator properties, noise-induced synchronization can be examined between identical oscillators that have no frequency mismatch, as demonstrated in Mainen and Sejnowski (1995).
To carry out the experiment described above, we implemented a single Pierce oscillator circuit, which has the same parameter setting as in the previous Section (see Fig. 2 (a) and Table 1). The function generator was composed of an embedded computer (Raspberry Pi 2 Model B) and a D/A converter (Sunhayato MM-5102), which is capable of generating a same sequence of white Gaussian noise or Poisson spike trains as an audio signal with a sampling rate of 192 kHz.
For each trial, output from the circuit and the noise signal were recorded simultaneously. To align the time sequences of different trials, the time shift that maximized the correlation coefficient between the noise signals was sought. By this alignment, all trials give rise to the same timing of noise inputs and thus the circuit outputs can be regarded as those receiving the same noise input simultaneously. Then, to quantify the level of synchrony, correlation coefficient between the circuit outputs of different trials was computed.
Fig. 2 (b) shows the results of applying Gaussian white noise. Peak-to-peak voltage of the noise signals was increased from 1.5 to 3 V. For each noise intensity, 10 trials with the same noise signal were repeatedly made. For 45 pairs of all possible combinations, the correlation coefficients between the circuit outputs were computed. Their average was drawn by the solid line, while the standard deviation was indicated by the error-bar. We see that the output coherence increases slightly as the noise intensity is increased. To compare with the case that no noise was injected, the correlation coefficient, which was computed in a similar manner between the circuit outputs before the noise was injected, was plotted by the dotted line. The significant difference (: -test, ) was detected for the noise intensity of 3 V, indicating that the observed increase in the level of output coherence was due to the common Gaussian white noise.
Fig. 2 (c), on the other hand, shows the results of applying Poisson spike trains (mean frequency: 20 kHz). Again, the correlation coefficient between the circuit outputs increased clearly as the noise intensity was increased. For the noise intensity of 2.5 V and 3 V, significant difference (: -test, ) from the control signals was detected, indicating that the oscillator outputs were highly correlated with each other due to the common spike inputs.
(a)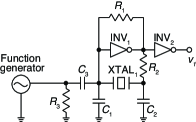 (b)
(b)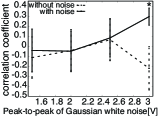 (c)
(c)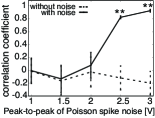
To see the post effect of the noise-induced coherence, the circuit outputs were further examined after the noise injection was terminated. For Poisson spike trains (mean frequency: 20 kHz, spike voltage: 3 V), the output signals () were drawn simultaneously for 10 different trials. Fig. 3 (a) and (b) correspond to the plots during and after the noise injection, respectively. Strongly correlated outputs discernible during the noise injection quickly disappeared after the noise injection. To quantitatively see the change in the correlation, Fig. 3(c) displays distribution of the 45 correlation coefficients computed for all pairs of the 10 trials during (stripe patterns) and after (gray patterns) the noise injection. The high correlation, which existed during the noise injection, disappeared after the noise injection was stopped. According to the Kolmogorov-Smirnov test, their difference was significant ().
These results suggest that, in our experiment of repeating the same noise injection to the single Pierce circuit, the noise input increased coherence of the oscillator outputs by modulating the circuit system. This noise perturbation was, however, not strong enough to induce phase shift of the crystal oscillators, since the coherence was lost instantly after the noise injection was stopped. To induce phase synchronization of limit cycle oscillators, the phase shift, which lasts permanently after the perturbation, is required Winfree (2001); Kuramoto (1984); Pikovsky et al. (2003). In this sense, the present experimental framework is not sufficient to realize noise-induced synchronization of the crystal oscillators.
(a)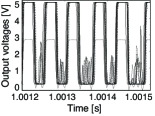 (b)
(b)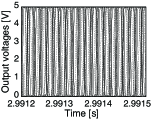 (c)
(c)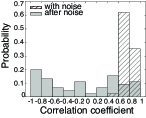
V Voltage Resetting as the Strongest Perturbation
Our experiment in the previous Section indicated that the repeated injection of the same noise to the single Pierce circuit was not strong enough to induce the real phase shift, which should last permanently after the noise input was terminated. As much stronger stimulus to induce such phase shift, we introduced a voltage resetting of the Pierce oscillator circuit through the nMOS transistor () as shown in Fig. 4 (a). The function generator, used in our previous experiment as Fig. 2 (a), transmitted a resetting signal of high voltage to the transistor . By this signal, the output voltage was reset from to 0 V, during the time when the transistor was turned on.
In our first experiment, the resetting time, during which the output voltage was reset to 0 V, was set to 2 ms. In each trial, a single resetting signal was injected to the Pierce circuit. Then, the resetting signal and the output signal were recorded simultaneously. This measurements were repeated for 10 times. As in our previous experiment, to align the time sequences of different trials, the time shift that maximized the correlation coefficient between the resetting signals was sought. By this alignment, all trials give rise to the same timing of resetting signals and thus the circuit outputs can be regarded as those simultaneously reset. Then, to quantify the level of synchrony, correlation coefficient between the circuit outputs of different trials was computed.
Fig. 4 (c) and (d) show simultaneous plots of the output signals () with 10 different trials. No clear difference is observed between the plots before (c) and after (d) the input of resetting signal. Fig. 4 (e) and (f), on the other hand, show the case that the resetting time was set to 0.8 s. The phase shifts were induced clearly after the resetting in (f), showing a sign of synchronization among the outputs of different trials. These phase shifts were not instantaneous but they lasted for a very long time after the voltage reset.
To quantify the level of synchrony, correlation coefficient between the circuit outputs of different trials was computed for all pairs of different trials. Fig. 4 (b) shows dependence of the averaged correlation coefficient on the resetting time duration. The dashed and solid lines represent the cases before and after the reset input, respectively. For resetting time longer than 0.2 s, significant increases (: , -test) in the correlation coefficient are recognized. Longer the resetting time is, more coherent the output signals become. This is reasonable because the resetting effect becomes stronger as the resetting time is extended, inducing a stronger level of synchrony in the Pierce oscillator circuit.
(a)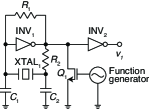 (b)
(b)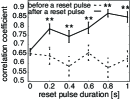 (c)
(c)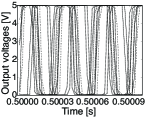 (d)
(d)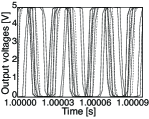 (e)
(e)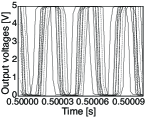 (f)
(f)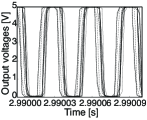
VI Discussions and Conclusions
The present study focused on the noise-induced synchronization of crystal oscillators. Two uncoupled Pierce circuits receiving a common noise input and a single Pierce circuit repeatedly forced by a same noise input were implemented in our hardware. Regardless of noise amplitude and noise types, synchronization was not achieved between the two uncoupled crystal oscillators. Then, to exclude the frequency mismatch of the oscillators as a primary cause of avoiding the synchrony, a same noise input was injected repeatedly to a single Pierce circuit. Although the coherence of the circuit outputs was increased during the noise injection, the output coherence disappeared immediately after the noise injection, implying that the noise was not strong enough to induce the real phase shifts. As the strongest perturbation, the voltage resetting was finally examined. As the resetting time was increased, a clear phase shift was induced, giving rise to synchronized outputs of the circuit oscillator. Taken together, our study indicated that the crystal oscillator was robust against eternal perturbations such as noise injections in the sense that its phase was not easily shifted. Much stronger perturbation such as the voltage resetting was needed to induce the phase shifts, leading to synchrony.
Recently, noise-induced synchronization has been applied to several engineering problems. For instance, simulation study examined environmental noise as a possible source for synchronizing wireless sensor networks Yasuda and Hasegawa (2013, 2016). Noise-induced synchronization has been also utilized in a simulated array of spin torque oscillators to overcome their low output power Nakada et al. (2012). Along the line of these works, synchronization of the crystal oscillators would provide a rich technological basis for unifying multiple CPUs, sensor networks, and other distributed clock devices. Towards such applications, our study provides a guideline for realizing noise-induced synchronization of the crystal oscillators, where design of a very strong signal is needed to achieve their synchrony. In our present experiment, a single resetting pulse has been applied to the crystal oscillator. The important future study would be to apply multiple resetting pulses Tass (2007); Fukuda et al. (2013) with a short resetting time to induce more efficient phase shifts, leading to noise-induced synchronization of crystal oscillators.
Acknowledgements
The authors would like to thank Dr. Yoji Kawamura for stimulating discussions. This work was partially supported by the Grant-in-Aid for Scientific Research (No. 17K14685, No. 16K00343, No. 16K06154, No. 26286086) from Japan Society for the Promotion of Science (JSPS).
References
- Winfree (2001) A. T. Winfree, The geometry of biological time (Springer, New York, 2001).
- Kuramoto (1984) Y. Kuramoto, Chemical oscillations, waves, and turbulence (Springer, Berlin, 1984).
- Pikovsky et al. (2003) A. Pikovsky, M. Rosenblum, and J. Kurths, Synchronization: a universal concept in nonlinear sciences, Vol. 12 (Cambridge university press, 2003).
- Teramae and Tanaka (2004) J.-n. Teramae and D. Tanaka, Physical Review Letters 93, 204103 (2004).
- Arai and Nakao (2008a) K. Arai and H. Nakao, Physical Review E 78, 066220 (2008a).
- Nagai and Nakao (2009) K. Nagai and H. Nakao, Physical Review E 79, , (2009).
- Goldobin et al. (2010) D. S. Goldobin, J.-n. Teramae, H. Nakao, and G. B. Ermentrout, Physical Review Letters 105, 154101 (2010).
- Nakao et al. (2007) H. Nakao, K. Arai, and Y. Kawamura, Physical review letters 98, 184101 (2007).
- Lai and Zhou (1998) C.-H. Lai and C. Zhou, EPL (Europhysics Letters) 43, 376 (1998).
- Rim et al. (2000) S. Rim, D.-U. Hwang, I. Kim, and C.-M. Kim, Physical review letters 85, 2304 (2000).
- Zhou and Kurths (2002) C. Zhou and J. Kurths, Physical review letters 88, 230602 (2002).
- Yoshimura et al. (2007) K. Yoshimura, I. Valiusaityte, and P. Davis, Physical Review E 75, 026208 (2007).
- Mainen and Sejnowski (1995) Z. F. Mainen and T. J. Sejnowski, Science 268, 1503 (1995).
- De La Rocha et al. (2007) J. De La Rocha, B. Doiron, E. Shea-Brown, K. Josić, and A. Reyes, Nature 448, 802 (2007).
- Galán et al. (2006) R. F. Galán, N. Fourcaud-Trocmé, G. B. Ermentrout, and N. N. Urban, The Journal of neuroscience 26, 3646 (2006).
- Arai and Nakao (2008b) K. Arai and H. Nakao, Physical Review E 77, 036218 (2008b).
- Yoshida et al. (2006) K. Yoshida, K. Sato, and A. Sugamata, Journal of sound and vibration 290, 34 (2006).
- Sunada et al. (2014) S. Sunada, K. Arai, K. Yoshimura, and M. Adachi, Physical Review Letters 112, 204101 (2014).
- Tomiyama et al. (2018) M. Tomiyama, K. Yamasaki, K. Arai, M. Inubushi, K. Yoshimura, and A. Uchida, Optics express 26, 13521 (2018).
- Yasuda and Hasegawa (2013) H. Yasuda and M. Hasegawa, IEICE Transactions on Communications 96, 2749 (2013).
- Nakada et al. (2012) K. Nakada, S. Yakata, and T. Kimura, Journal of Applied Physics 111, 07C920 (2012).
- Vittoz et al. (1988) E. A. Vittoz, M. G. Degrauwe, and S. Bitz, IEEE Journal of Solid-State Circuits 23, 774 (1988).
- Matthys (1983) R. J. Matthys, New York, Wiley-Interscience, 1983, 244 p. 1 (1983).
- Pierce (1923) G. W. Pierce, in Proceedings of the American Academy of Arts and Sciences, Vol. 59 (JSTOR, 1923) pp. 81–106.
- Yasuda and Hasegawa (2016) H. Yasuda and M. Hasegawa, Journal of Signal Processing 20, 129 (2016).
- Tass (2007) P. A. Tass, Phase resetting in medicine and biology: stochastic modelling and data analysis (Springer Science & Business Media, 2007).
- Fukuda et al. (2013) H. Fukuda, H. Murase, and I. T. Tokuda, Scientific Reports 3, 1533 (2013).