Quasi-Periodic Radio Bursts Associated with Fast-mode Waves near a Magnetic Null Point
Abstract
This paper presents an observation of quasi-periodic rapidly-propagating waves observed in the AIA 171/193 Å channels during the impulsive phase of an M1.9 flare occurred on 7 May 2012. The instant period was found to decrease from 240 s to 120 s, the speed of the wave fronts was in the range of 664–1416 km s-1. Almost simultaneously, quasi-periodic bursts with similar instant periods, 70 s and 140 s, occur in the microwave emission and in decimetric type IV, and type III radio bursts, and in the soft X-ray emission. The magnetic field configuration of the flare site was consistent with a breakout topology, i.e., a quadrupolar field along with a magnetic null point. The quasi-periodic rapidly-propagating wavefronts of the EUV emission are interpreted as a fast magnetoacoustic wave train. The observations suggest that the fast-mode waves are generated during the quasi-periodic magnetic reconnection in the cusp-region above the flare arcade loops. For the first time, we provide the evidence of a tadpole wavelet signature at about 70–140 s in decimetric (245/610 MHz) radio bursts, along with the direct observation of a coronal fast-mode wave train in EUV. In addition, at AIA 131/193 Å we observed quasi-periodic EUV disturbances with the periods of 95 s and 240 s propagating downward at the apparent speed of 172–273 km s-1. The nature of these downward propagating disturbances is not revealed, but they could be connected with magnetoacoustic waves or periodically shrinking loops.
Subject headings:
Sun: flares—Sun: corona—Sun: oscillations—Sun: UV radiation—Sun: radio radiation1. INTRODUCTION
Rapidly propagating quasi-periodic EUV disturbances moving approximately at the Alfvén speed have been theoretically predicted as impulsively generated fast magnetoacoustic waves (the fast mode), which are guided by high-density plasma structures of the solar corona (e.g., loops) serving as a waveguide (Roberts et al., 1983, 1984). The quasi-periodic pattern develops because of the geometrical dispersion caused by a transverse non-uniformity of the fast speed. Fast-mode wave trains may be excited by impulsive energy releases in solar flares. Fast-mode wave trains are important for understanding magnetic connectivity channels, quasi-periodic energy release, particle acceleration, and plasma heating in solar flares.
Possibly the first evidence of fast-mode wave trains was found in the solar corona during eclipses. Williams et al. (2001, 2002) discovered a 6-s oscillation propagating at the speed of 2100 km s-1 in an active-region loop observed with the Solar Eclipse Corona Imaging System (SECIS), and interpreted it as an impulsively generated fast magnetoacoustic wave train. Nakariakov et al. (2004) numerically modelled the characteristic time-evolution of these short-period fast wave trains along a coronal loop. They found that these wave trains have a characteristic tadpole wavelet signature where a narrowband tail precedes a broadband head. An important feature of the wave train signature is the decrease in the oscillation period in time, which is connected with the decrease in the phase and group speeds of fast magnetoacoustic modes of a field-aligned plasma waveguide with the wave number (Nakariakov et al., 2004). In other words, fast modes with longer periods propagate faster than the shorter period modes. A similar tadpole feature was detected in the wavelet power spectrum of the signal observed with SECIS, which supported the interpretation in terms of guided fast-mode wave trains. Further modelling of the dispersive evolution of broadband fast wave trains includes the study of this effect in cylindrical waveguides (Oliver et al., 2015; Shestov et al., 2015), consideration of the finite-beta effects (Chen et al., 2016), and effects of the transverse profile of the fast magnetoacoustic speed (Yu et al., 2017).
More recently, fast-mode wave trains were discovered in the high-resolution SDO/AIA images. Using SDO/AIA 171 and 193 Å observations, Liu et al. (2011, 2012) reported the direct imaging of quasi-periodic fast propagating waves at the speed 2000 km s-1and period of 2–3 min. Kumar & Manoharan (2013) detected fast-wave fronts with a three minute periodicity, propagating at the speed 1000 km s-1 along open structures in an active region behind a primary fast shock wave. These wave trains were shown to be consistent with periodically excited fast magnetoacoustic waves (Ofman et al., 2011). Nisticò et al. (2014) observed fast wave trains (speed of 1000 km s-1, period 1 min) along two different structures in an active region, and demonstrated the similarity between the detected wave patterns and the results of numerical modelling of the evolution of a broadband fast magnetoacoustic pulse (see also Pascoe et al., 2013a; Yu et al., 2016). Similar propagating fast wave trains have also been detected in other flare events (Shen et al., 2013; Yuan et al., 2013; Kumar & Cho, 2014; Kumar et al., 2016). These fast-mode wave trains are closely associated with flare quasi-periodic energy releases, and generally detected behind the coronal mass ejection (CME) front. Zhang et al. (2015) presented the first simultaneous observation of fast and slow waves propagating along the same coronal structure, interpreted as co-existing fast and slow magnetoacoustic waves generated by different mechanisms.
Evidence of similar fast-mode wave trains was also found in the radio band. The non-thermal electrons trapped in the flare loops generally produce microwave bursts (Benz, 2017). The hard X-ray/radio observations have shown that the particle acceleration sites are generally located in the reconnection region (i.e., the cusp) above the soft X-ray flare loop. The non-thermal electrons moving in the upward direction from the reconnection region produce type III (metric) radio bursts, whereas the downward electrons produce reverse-slope (RS) and decimetric (DCIM) bursts (Aschwanden, 2004). Mészárosová et al. (2009a, b) reported drifting tadpoles in the wavelet power spectra of DCIM type IV radio bursts produced by a flare, and suggested that the drifting tadpoles are produced by a propagating fast wave train guided by the flare loop. In the event analysed by Mészárosová et al. (2009a) the wavelet tadpoles with the mean period of about 80 s were detected at all DCIM frequencies (1.1–4.5 GHz). Another event (Mészárosová et al., 2009b) was found to have a similar drifting wavelet tadpole with a period of 70.9 s at 1.60–1.78 GHz. If the heads of the tadpole wavelet feature at different frequencies of the 1.1–4.5 GHz band are fixed, the emission mechanism is expected to be gyrosynchrotron (Mészárosová et al., 2009b), which is modulated by a compressive wave train. But, if there is a frequency drift in the fiber burst (-6.8 MHz s-1 at 1.60–1.78 GHz), the emission mechanism is supposed to be the plasma emission (Mészárosová et al., 2009a), which is modulated by a compressive wave train propagating through a low density plasma. Furthermore, using the Giant Metrewave Radio Telescope (GMRT) observations, Mészárosová et al. (2013) reported similar tadpoles, with the mean period of 10–83 s, at metric/decimetric frequencies (244/611 MHz), and interpreted it as an evidence of a fast-mode wave train propagating in a fan structure above a coronal null point. Note that Mészárosová et al. (2009a, b) could not observe any wave train in the EUV images, because of the insufficient time resolution of available EUV imagers.
Kumar & Innes (2015) reported an interesting observation of fast-mode waves generated by an impulsive flare at one of the footpoints of the flare’s arcade loops, where one front was trapped within the arcade loop and reflected back from the opposite footpoint of the loop, while another front (i.e., shock) moved radially outward at the speed 1000 km s-1, and produced a metric type II radio burst. Recently, Goddard et al. (2016) detected a fast wave train (speed of 1200 km s-1, period of 1.7 min) in the EUV emission, and linked this phenomenon with quasi-periodic radio sparks observed at the 40–100 MHz frequency (1.7 min period) ahead of a metric type II radio burst. The origin of this fast wave train, and its association with the radio bursts is not well understood yet, and needs further investigations.
Despite several confident detections, observations of rapidly-propagating quasi-periodic waves remain rare, i.e., only several events have been reported in the literature so far. Therefore, the addition of a new observation is valuable for understanding their origin/properties and theoretical modelling. In this paper, we report a new observation of a coronal rapidly-propagating quasi-periodic wave train of the EUV emission variation, associated with quasi-periodic radio bursts (metric, decimetric, and microwave), which occurred during a long duration M1.9 flare in active region NOAA 11471 on 7 May 2012. In Section 2, we present the observations, and in the last section, we discuss and summarise the results.


2. OBSERVATIONS AND RESULTS
The Atmospheric Image Assembly (AIA; Lemen et al. 2012) onboard the Solar Dynamics Observatory (SDO) records full disk images of the Sun (field-of-view 1.3 R⊙) with a spatial resolution of 1.5 (0.6 pixel-1) and a cadence of 12 s. For the present study, we utilized AIA 171 Å (Fe IX, the temperature MK), 94 Å (Fe X, Fe XVIII, i.e., MK, MK), 131 Å (Fe VIII, Fe XXI, Fe XXIII, i.e., , 10, 16 MK, respectively), 1600 Å (C IV + continuum, MK), 335 Å (Fe XVI, T2.5 MK) and AIA 193 Å (Fe XII, Fe XXIV, i.e., MK and MK) images. We also used the Helioseismic and Magnetic Imager (HMI; Schou et al. 2012) magnetogram to infer the magnetic topology of the active region. We utilised the Reuven Ramaty High-Energy Solar Spectroscopic Imager (RHESSI; Lin et al. 2002) and Nançay radioheliograph (NRH;Kerdraon & Delouis 1997) observations to investigate the hard X-ray (HXR) and radio emissions in different energy bands. NRH provides observations at nine frequencies, i.e., 150, 173, 228, 270, 298, 327, 408, 432 and 445 MHz. We analysed NRH 10-s cadence data.
On 7 May 2012 the NOAA active region 11471 (the magnetic configuration, S19W50) was located close to the western limb. The wave train, reported here (Section 2.1), was associated with an M1.9 flare that started at 14:03 UT, peaked at 14:31 UT and ended at 14:52 UT. The upward propagating wave train was observed in EUV at 14:06–14:26 UT, for about 20 minutes.
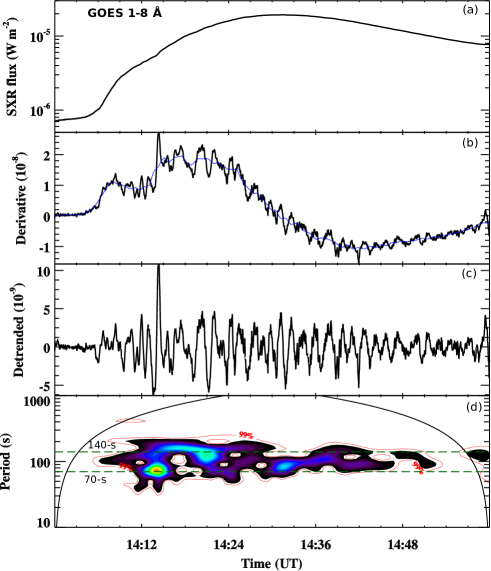
Figure 1(a-b) displays the 2-s cadence GOES soft X-ray (SXR) flux profile in 1–8 Å and its time derivative. Unfortunately, RHESSI did not observe the impulsive phase of the flare. We used the Lagrangian interpolation technique (three-point numerical differentiation) to estimate the time derivative of the GOES soft X-ray flux. The SXR derivative profile is smoothed by 8-s. We subtracted a 124-s smoothed curve (blue) to detrend the signal (Figure 1(b)), and decomposed it using the Morelet wavelet technique (Torrence & Compo, 1998). The wavelet power spectrum reveals the presence of statistically significant periodicities, with the periods of 70 s and 140 s being above the 99% significance level.
2.1. Upward propagating wave train and eruption
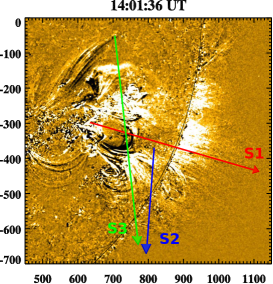
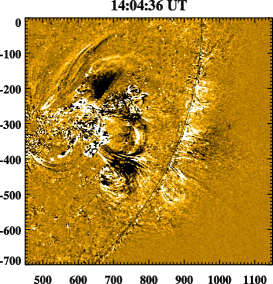
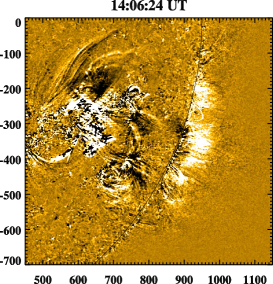
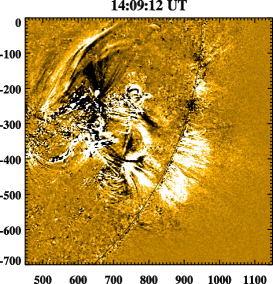
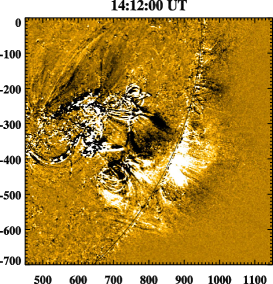
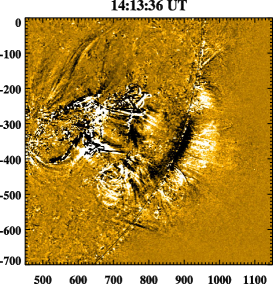
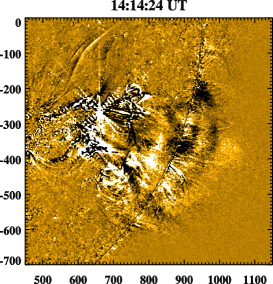
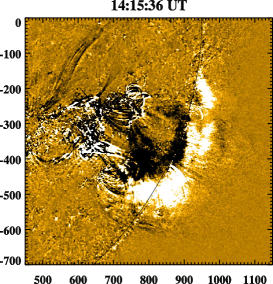
We analysed the time sequence of AIA 171 Å images taken during the flare to investigate the quasi-periodic propagating EUV wavefronts (i.e., a wave train). The wave train was best observed in the AIA 171 Å channel. Figure 2 displays selected AIA 171 Å running-difference images showing multiple wavefronts during the impulsive phase of the M1.9 flare. At 14:01 UT, we notice a radially outward expanding CME frontal loop and an associated EUV brightening near the limb. The first EUV wavefront (behind the CME frontal loop) was observed at 14:06 UT. The AIA 171 Å movie clearly shows a train of rapidly-propagating quasi-periodic wavefronts near the limb at 14:06 UT onward, in the direction indicated by arrow S1 in Figure 2, lasting till 14:26 UT. The wavefronts are seen to move radially outward from the flare site. The wavefronts are of a quite large scale, having a semi-circular convex arc shape, of the size of 300 while reaching the limb. Another wave train-like feature is seen to propagate in the southward direction along the arcade loop, in the direction indicated by arrow S2 in Figure 2. In addition, there are quasi-periodic disturbances propagating downwards from the same site (Section 2.5).
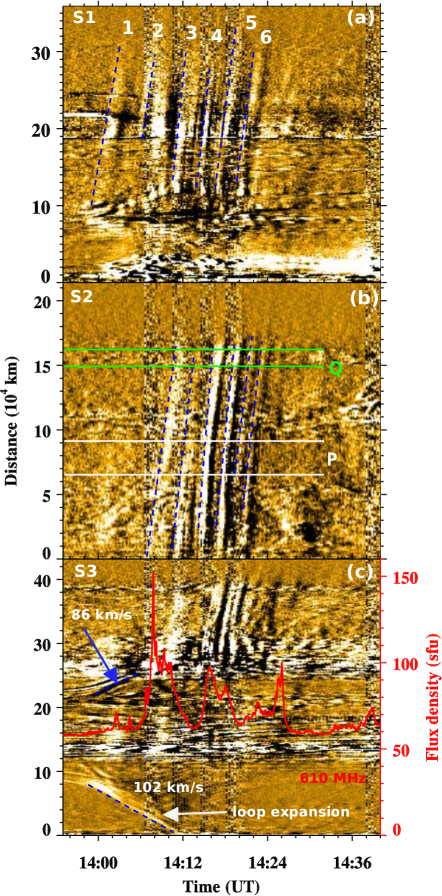
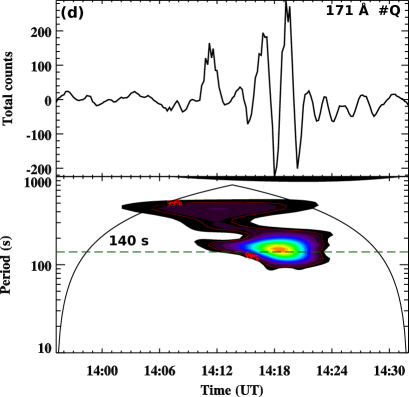
To determine the speed of the wavefronts and associated loop eruption, we created time–distance intensity (running difference) plots along slices S1, S2, and S3 during 13:55–14:40 UT (Figure 4). Slice S1 (red) is chosen to estimate the speed of the wave fronts going in the westward direction, whereas S2 (blue) for the laterally moving fronts in the southward direction. Slice S3 (green) is selected to investigate the CME frontal loop expansion during the flare onset. The speeds of wavefronts are estimated using a linear fit to the data points of each visually tracked propagating wavefront that appears as a diagonal feature in the time–distance plot. The speeds of individual wavefronts along slice S1 are 85080, 102652, 1482176, 141646, 119256, and 1147214 km s-1, respectively. The speeds of individual wavefronts along slice S2 are 66476, 81042, 1140288, 910170, 72685, and 790110 km s-1, respectively. The speed of the southward moving fronts is lower than that of the westward (radially outward) moving fronts, which may be attributed either to the line-of-sight projection effect or to the difference in the local fast speed or other properties of the corresponding waveguides. The speed of the wavefronts is found to be close to the expected Alfvén speed in coronal active regions (Mann et al., 1999, 2003; Warmuth & Mann, 2005). Therefore, the rapidly-propagating compressive disturbances are interpreted as quasi-periodic propagating fast-mode waves. The wavefronts are seen to follow each other quasi-periodically, with the period decreasing from about 240 s to about 120 s, which is best seen in panel (b). According to the wavelet spectrum shown in Figure 9(d), the main power of quasi-oscillatory patten (the wavelet tadpole “head”) is situated near the period of 140 s.
The multiple EUV fronts were mostly observed behind the erupting CME frontal loop. However, one front was observed ahead of the expanding CME frontal loop in the northward direction. This is similar to a “classical" (single-pulse) EUV wave (e.g., Kumar et al. 2013; Warmuth 2015) in front of the expanding CME flanks. Panel (c) reveals the lateral expansion of CME flanks in the 171 Å channel, with the speed of 86–120 km s-1 (14:00–14:12 UT).
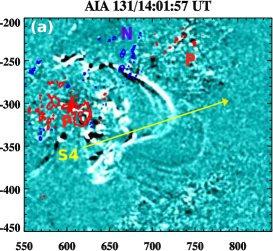
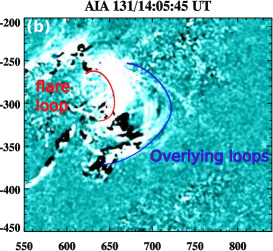
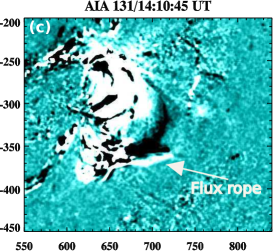
Figure 3 shows AIA 131, 335, and 193 Å running difference images of the field of interest. The AIA 131 Å image at 14:01 UT reveals the appearance of bright loops. The HMI magnetogram contours of positive (red) and negative (blue) polarity regions indicate the magnetic configuration of the active region (the magnetic polarities of the loops’ footpoints). During 14:05–14:11 UT we see the simultaneous formation of the underlying flare loop (the red curve) and overlying loop systems (the blue curve). This could be a signature of magnetic reconnection associated with the formation of the hot flux rope. The AIA 131 Å movie clearly shows a clockwise rotation of a small filament close to the southern leg of the flux rope. The filament rotation suggests the existence of a right-handed twist of the flux rope (e.g., see Kumar & Cho 2014). It should be noted that the untwisting filament (marked by an arrow) was also observed in the cool channels (i.e., AIA 304 Å images). However the other part of the flux rope is seen in the hot channel (i.e., AIA 131 Å) only.
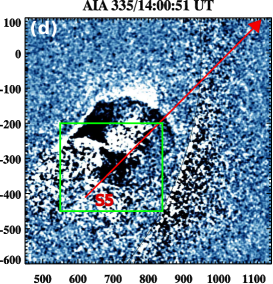
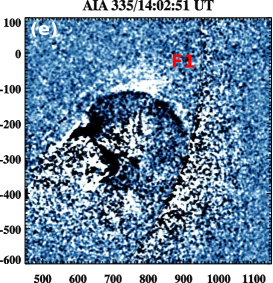
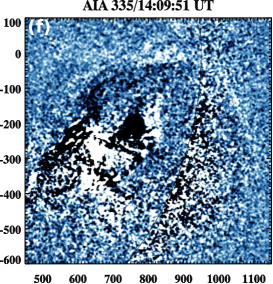
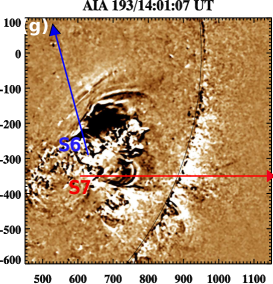
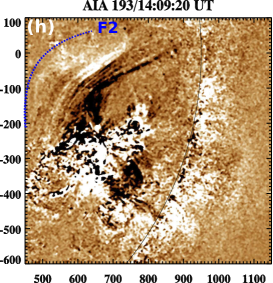
The AIA 335 Å running-difference images (Figure 3(d-f)) reveal a large-scale expanding front (F1) moving in the northwest direction. The bright front appeared at 14:00 UT, and was observed until 14:11 UT (see the AIA 335 Å movie). Apart from this front, we observe a faint wavefront (F2) moving in the north direction (refer to the AIA 335 Å movie).
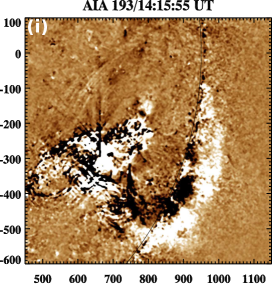
The quasi-periodic wave train was also detected in the AIA 193 Å channel (Figure 3(g-i)). The AIA 193 Å movie shows a wave train observed during 14:00–14:30 UT, similar to the train seen in AIA 171 Å images. We also see the expanding front (F2) in the north direction at 193 Å.
To investigate the kinematics of the loop eruption and wavefronts, we selected slices S4, S5, S6, and S7 to create the time–distance intensity plots using AIA 131, 335, and 193 Å running difference images (Figure 4(c-f)) during 13:55–14:30 UT. The AIA 131 Å time–distance plot shows a bright loop (i.e., a flux rope) eruption with a speed of 200 km s-1 at 14:08 UT (Figure 4(d)). We fitted a second order polynomial function (, where is the distance, is the time, and , and are constant coefficients) to the time–distance profile of the expanding front (F1) observed in the AIA 335 Å channel in the northwest direction (Figure 4(e)). Initially, the front shows a slow-rising motion, until 14:05 UT, and then reveals a fast rise during 14:06–14:16 UT. The estimated speed of the front F1 is 64–472 km s-1.
The AIA 193 Å time–distance plot made along S6 reveals another fast wavefront (F2) moving in the north direction (Figure 4(f)). The estimated speed of F2 is 65722 km s-1. The time–distance plot made along slice S7 (Figure 4(g)) reveals a quasi-periodic rapidly-propagating wave train similar to the wave train observed in the AIA 171 Å channel. We also plotted the GOES SXR flux time derivative to see the association of the wave train with the quasi-periodic flare energy release. The quasi-periodic energy release starts at 14:06 UT onward at the same time of the appearance of the EUV wave train.
The initial speed of front F1 (64 km s-1) observed in the AIA 335 Å is comparable to the speed of the lateral expansion of the loop (86–102 km s-1) observed at AIA 171 Å (Figure 4(c)). In addition, the start time of F1 closely matches the lateral expansion of the 171 Å loop. Front F1 initially reveals slow rise until 14:01 UT and an acceleration in the later phase. This type of slow acceleration is not expected in the case of primary fast-mode waves ahead of a CME piston. The piston driven fast-mode waves generally shows deceleration after decoupling from the piston. Therefore, front F1 is interpreted as a lateral expansion of the CME flank (i.e., a pseudo wave). The AIA 335 Å running difference images do not show any decoupling from F1. Front F2 (14:06 UT) is fast enough to be interpreted as a fast-mode wave. At 171 and 193 Å we also see a co-temporal fast EUV front (14:01 UT) that propagates outward along S1/S2/S7 at the speed higher than 1000 km s-1. This could be a part of the wave train too.
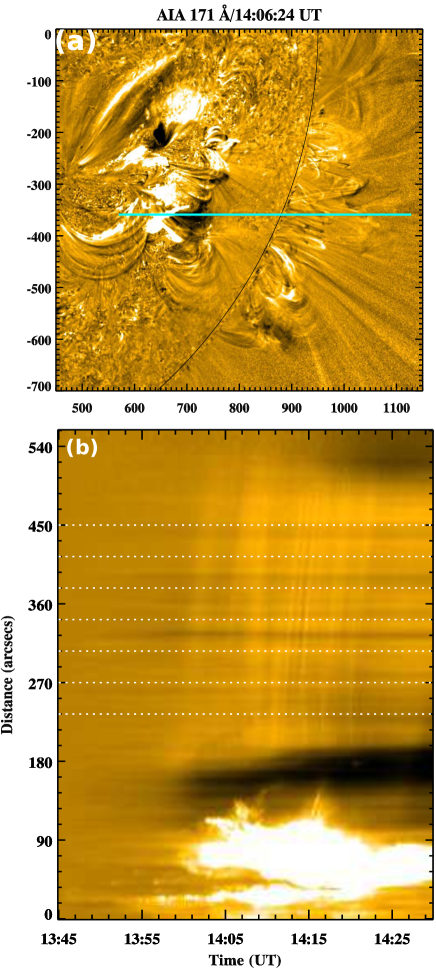
To determine the relative intensity and amplitude profiles (e.g., for linear/nonlinear behaviour, Warmuth & Mann 2011; Muhr et al. 2014,) of the wave train, we analysed AIA 171 Å base ratio images ((I-I0)/I0, where I0 is an image before the flare at 13:45 UT). Figure 5 (b) displays the time-distance intensity plot along a slice cut (cyan) marked in Figure 5 (a). We chose the cut along the radial direction of the outwards propagating wave train, where the fronts are more clear. Figure 5(c) displays the relative intensity of outward propagating multiple wavefronts at different distances (arcsecs) along the horizontal dotted line marked in the time-distance intensity plot (panel (b)). The measurement of the relative amplitude of the wave trains, i.e. the ratio of the maximum amplitude of the intensity to the unperturbed intensity, is under 5. Such an amplitude corresponds to a rather linear behaviour. Even for larger amplitude, the wave train should not show a signature of the nonlinear evolution, as the nonlinear steepening is suppressed by the waveguide dispersion. However, this effect would require a dedicated theoretical analysis.
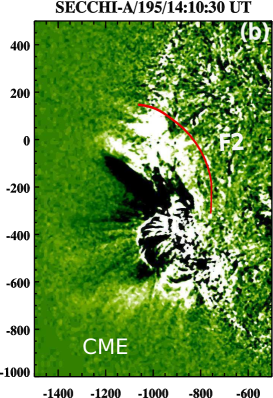
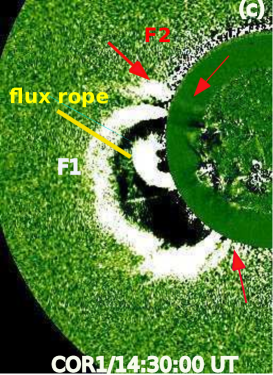
The Solar Terrestrial Relations Observatory (STEREO-A; Kaiser et al. 2008) Sun Earth Connection Coronal and Heliospheric Investigation (SECCHI; Howard et al. 2008) observed the same active region near the eastern limb. We used the extreme-ultraviolet imager (EUVI) 195 Å (up to 1.7 R⊙) and white-light coronagraph COR1 (1.5–4 R⊙) running difference images (5-min cadence) to determine the low-coronal eruption and associated CME. Figure 6 displays AIA 193 Å and EUVI 195 Å images to see the eruption from a different viewing angle. The EUVI 195 Å movie clearly shows the lateral expansion of the CME and associated dimming during the eruption. COR1 images reveal the flux rope structure of the CME. To determine the CME speed in the COR1 field of view (1.5–4 R⊙), we visually tracked the leading edge of the CME during 14:15–15:00 UT. Using a linear fit to the height–time dependence of the leading edge, the estimated speed of the CME was found to be 718 km s-1. According to the COR2 catalogue, the CME speed in the COR2 field of view (2.5–15 R⊙) was 665 km s-1. Therefore, the CME speed is almost comparable in both COR1 and COR2. We carefully compared the CME structure with the low coronal eruptions observed with AIA and EUVI. Front F1 observed with AIA showed a parabolic path in the kinematic plot, which corresponds to the acceleration from 64 km s-1 to 472 km s-1, suggesting a loop eruption rather than an EUV wave. Therefore, F1 is interpreted as an expanding CME frontal loop, which we observed later with COR1. Behind the CME frontal loop, we observed an erupting flux rope in the AIA 131 Å channel. COR1 images clearly show a flux rope behind the CME frontal loop. The COR1 image reveals the separation of two EUV fronts (north and south, red arrows) from the CME flanks. The front in the north direction (F2) was observed in the EUV images (193 Å) during the lateral expansion of the CME flank.
2.2. Quasi-periodic radio bursts
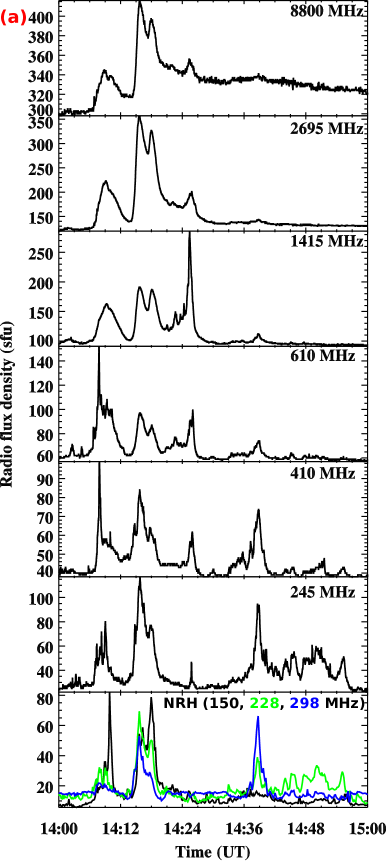
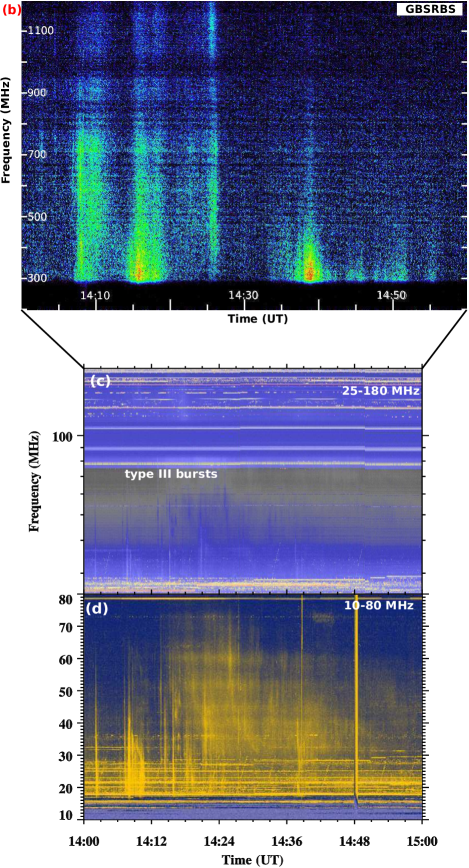
Figure 7(a) shows the radio flux density profiles at 245, 410, 610, 1415, 2695, and 8800 MHz observed at the Sagamore Hill station of the Radio Solar Telescope Network (RSTN) with a 1-s cadence. The bottom panel shows the NRH 10-s integrated radio flux profiles in 150, 228 (green), amd 298 (blue) MHz frequencies. Figure 7(b) displays the dynamic radio spectrum observed by Green Bank Solar Radio Burst Spectrometer (GBSRBS; White et al. 2005) in the 300–1200 MHz frequency band during 14:00–15:00 UT. The high-quality dynamic radio spectra are generated by GBSRBS with the time resolution of 1-s. High frequency type III radio bursts are seen during 14:02–14:05 UT. We see repetitive intense type III and type IV radio bursts (at 300–1200 MHz) at 14:06 UT onward, that continue until 14:40 UT. Low-frequency radio bursts (300–400 MHz) were detected until 15:00 UT. The low-frequency (metric, decametric) bursts are shown in the dynamic radio spectra observed at San-Vito (25–180 MHz) and the Nançay Decametric Array (NDA; Lecacheux, 2000) in 10-80 MHz. We see a series of type III radio bursts in the 20–60 MHz frequency band during 14:02–14:42 UT in Sanvito spectrum. However, the type-III radio bursts were observed until 15:00 UT in the Nançay Decametric Array dynamic spectrum.
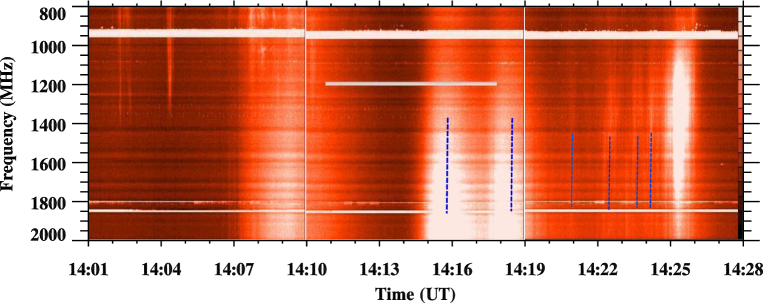
Figure 8 shows the Ondrejov dynamic radio spectrum (800–1200 MHz, Jiricka et al. 1993) for 14:01–14:28 UT. Note that the Ondrejov dynamic radio spectrum has better resolution than GBSRBS, therefore, it is useful for studying a fine structure of the burst.
The repeated radio bursts were observed in the decametric, metric, decimetric, and microwave emissions. The microwave emission (2.6 and 8.8 GHz) was observed almost until 14:27 UT. The emissions at 245 and 610 MHz show quasi-periodic bursts for up to almost one hour (i.e., 14:00–15:00 UT).
Figure 8 demonstrates the high-resolution dynamic spectrum of the decimetric radio emission during 14:01–14:28 UT. From 14:15 UT, there are quasi-periodic pulsations of the emission intensity, seen as the vertical lanes, with a time scale decreasing from 170 s to 30 s. Note that the AIA 171/193 Å time–distance intensity plot reveals diffuse wavefronts (more clearly seen in 193 Å, Figure 4(g)) during 14:22–14:26 UT. Therefore, these burst are associated with the rapidly propagating EUV waves.
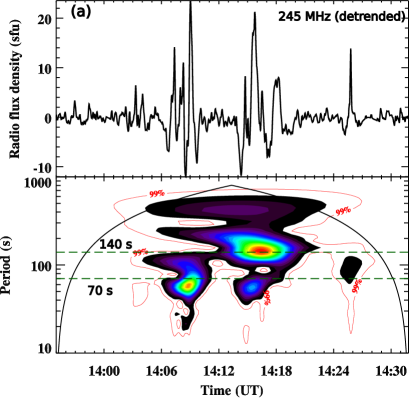
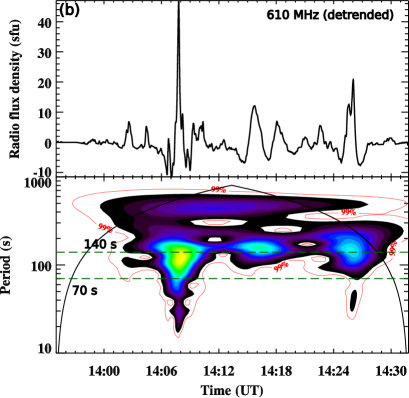
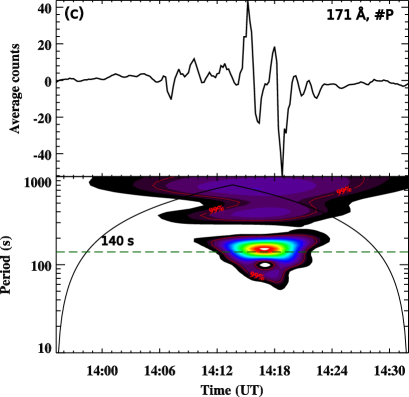
To determine the periodicity in the metric/decimetric emission, we selected 245 and 610 MHz flux profiles during the impulsive/maximum phase of the flare (13:55–14:32 UT). The original signal was smoothed by 6 s and then a 150 s smoothed curve was subtracted to detrend the light curve. Figure 9(a, b) shows the wavelet power spectra of the detrended light curves at 245 and 610 MHz. The 245 MHz power spectrum reveals two periods, of 70 and 140 s. The 610 MHz power spectrum also shows a 140 s periodicity. These periods are consistent with the periods detected in the GOES soft X-ray flux time derivative profile.
2.3. Magnetic configuration of the flare site
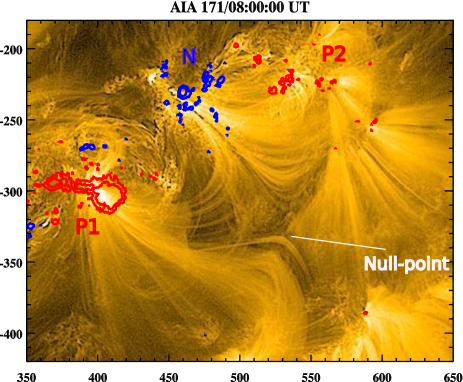
To determine the magnetic topology of the flare site, we show the AIA 171 Å intensity image taken one day before the studied event, on 6 May 2012 (Figure 10 left panel). The image is overlaid by HMI contours of positive (red) and negative (blue) polarities. This could be the best way to avoid the projection effect, allowing for the correct identification of the magnetic polarities, since it was more difficult to obtain this information on 7 May 2012 when the active region was lying closer to the west limb. The AIA 171 Å image shows the connectivity of the active region loops. The active region has a negative polarity region (N) surrounded by positive polarity regions on both sides (P1, P2). We see the EUV loops connecting regions P1/P2 with region N. In addition, we see open plasma structures emanating from P1 and P2. A cusp-shaped structure is also evident. The magnetic field configuration is quite similar to the topology needed for the magnetic breakout reconnection (Antiochos, 1998; Antiochos et al., 1999; Karpen et al., 2012) along with a magnetic null point. The right panel of Figure 10 shows a sketch demonstrating the possible magnetic configuration derived from the AIA 171 Å and HMI magnetogram images. The eruption starts with the expansion of the southward loop system connecting P1 and N. The flux rope eruption originated from the polarity inversion line between P1 and N. Later, most of the post-flare arcade loops were formed between P1 and N. We also observed a remote ribbon (R3, discussed below) at P2 during the flare.


2.4. X-ray and radio sources
Figure 11(a) shows the RHESSI X-ray flux profile in the 3–6, 6–12, 12–25, 25–50 keV energy bands. RHESSI missed the impulsive phase of the M1.9 flare. However, initiation and decay phases of the flare were observed. We utilised the RHESSI images in the 6–12 and 12–25 keV channels during the flare initiation and decay phase. We selected detectors # 3–9, and used the ‘CLEAN’ algorithm (Hurford et al., 2002) for image reconstruction with an integration time of 30-s.
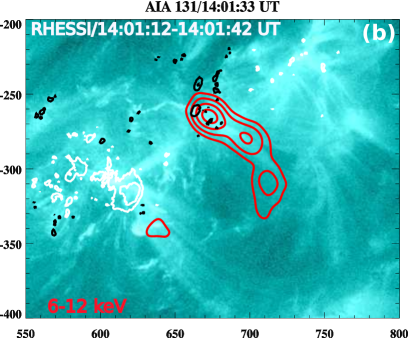
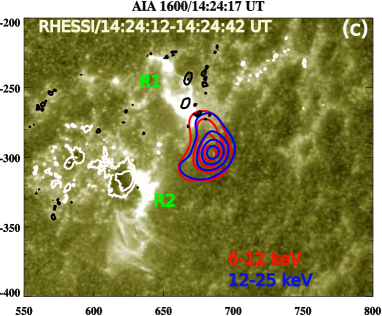
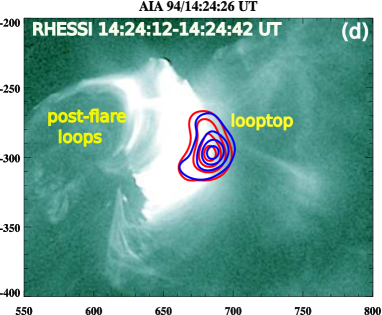
Figure 11(b) shows the AIA 131 Å image overlaid by RHESSI 6–12 keV contours during the flare initiation (14:01 UT). We see a loop-like structure in 6–12 keV channel, connecting N and P1. This is the site where the flare was triggered, associated with the eruption of the hot plasma (i.e., the flux rope seen at AIA 131 Å) and a frontal loop system (335 Å). During the flare decay phase (14:24 UT), we observe a loop-top source at 6–12 (red) and 12–25 keV (blue), flare ribbons (R1 and R2, AIA 1600 Å), and associated post-flare loops at AIA 94 Å (Figure 11(c,d)).
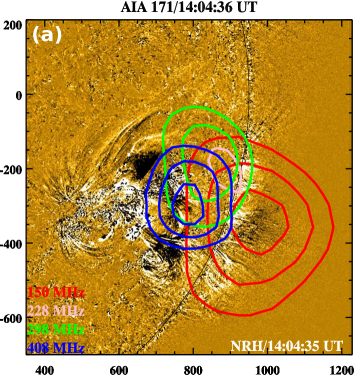
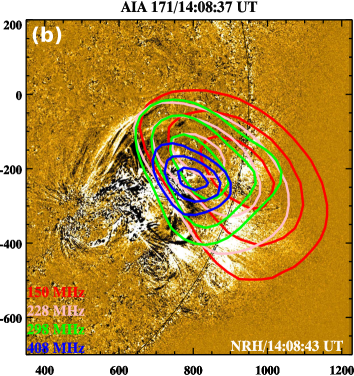
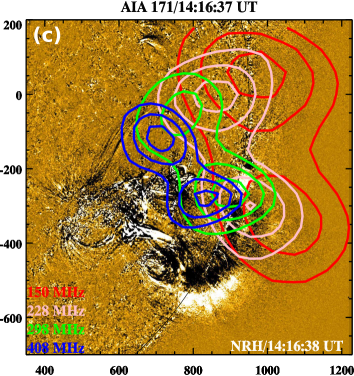
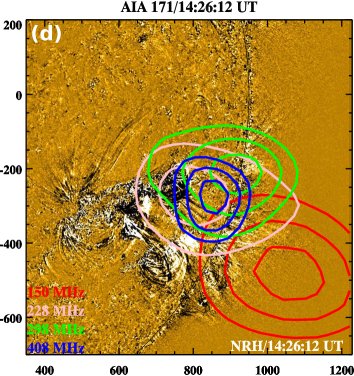
The quasi-periodic energy release during the solar flare was associated with the acceleration of nonthermal electrons in the solar corona, producing multiple radio bursts (e.g., type III, metric, decimetric and microwave emission, see Section 2.2). To identify the particle acceleration sites in the corona, we analysed 10-s cadence radio imaging data obtained with NRH at the 150, 228, 298, 408 MHz frequencies. We correlated the radio sources in time and frequency with the NRH 10-s integrated flux profiles (e.g., 150 MHz, 208, 298 MHz). The flux profiles are shown in the bottom panel of Figure 7(a). Figures 12(a-d) display NRH radio contours overlaid on the AIA 171 running difference (t=1 min) images. These contours are selected almost at the peak time of each metric/decimetric burst during 14:04–14:26 UT. The radio emission is basically the plasma emission depending on the local electron density (, where is the electron concentration). The radio sources are seen to appear approximately at/above the cusp. The evolution of the radio sources can be seen in the movie available online. We see a single radio source during the flare initiation (14:04 UT onward). Later on, at 14:16 UT, a double component/source was observed, which extends northward. Simultaneously, we observed an intense decimetric/microwave emission in the dynamic radio spectrum (14:16 UT) and 1-s cadence RSTN flux density profile ( Section 2.2). It seems to be produced in a broad acceleration region behind the erupting CME frontal loop observed at AIA 335 Å. A single source was observed at 14:20 UT onward.
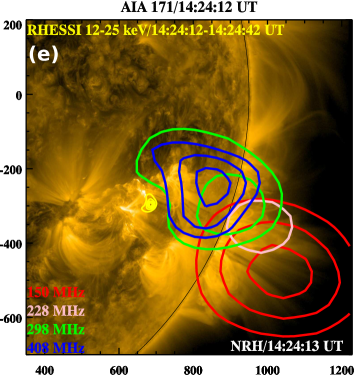
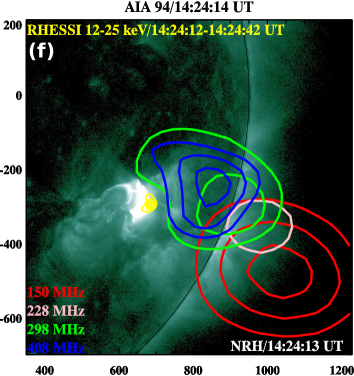
Figures 12(d-e) show the AIA 171 and 94 Å intensity images along with NRH/RHESSI contours at 14:24 UT. The 12–25 keV source is located above the hot arcade loops seen at 94 Å. The AIA 171 Å image shows a system of two loops, as well as open structures in the flaring active region. The metric type III emission is likely to be excited by the electron beam propagating along the open structures. The particle acceleration site should be somewhere between the X-ray loop-top and the NRH sources, which matches approximately the location of the cusp region (the null point) in the figure. Interestingly, multiple radio bursts and wave fronts originate at the same site, suggesting a common origin and common injection site for HXR and metric/decimetric emissions (e.g. Vilmer et al., 2002).
2.5. Quasi-periodic downward propagating disturbances
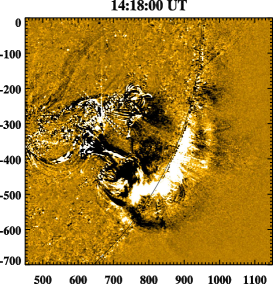
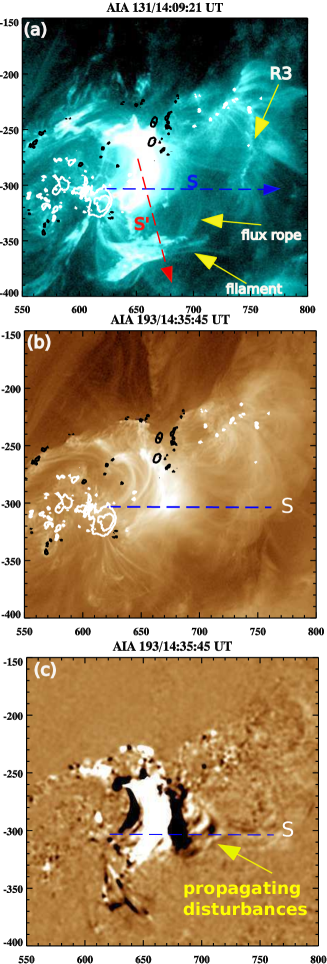
At 14:14–15:00 UT, in AIA 193 and 131 Å images, we observed another long duration quasi-periodic propagating pattern. After the escape of the flux rope, we see quasi-periodic disturbances that propagate apparently downwards, towards the flare arcade. These quasi-periodic downward propagating disturbances (QPDPD) are rather persistent, occurring during the impulsive, maximum, and decay phases of the flare. An AIA 131 Å image shows the formation of underlying flare loops associated with the eruption of the hot flux rope (marked by the arrow) and rotating filament near the southern footpoint of the flux rope (Figure 13(a)). Panels (b,c) show snapshots of the 193 Å intensity and its running difference at 14:35:45 UT. The location of the QPDPD coincides approximately with the source of the RHESSI 12–25 keV emission.
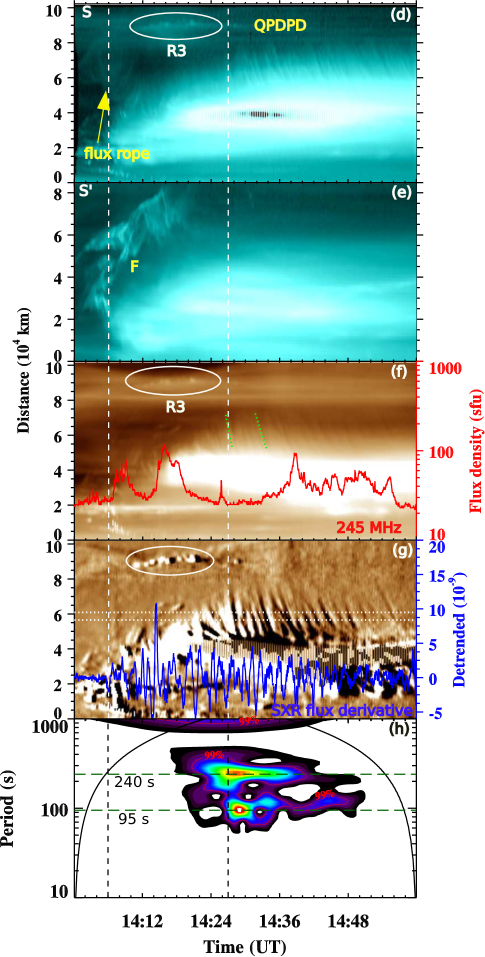
The QPDPD fronts have a concave (bent inwards) horseshoe shape, and thus resemble shrinking loops in a cusp-shaped structure above the flare arcade. To estimate the speed and temporal evolution of these QPDPD, we selected a slice S (eastward direction) to create the time–distance intensity plots (Figure 13(d, f)) and a running difference plot (Figure 13(g)) during 14:00–15:00 UT. Another cut, S’, was chosen in the southward direction to show the rotating filament during the flux rope eruption. The time–distance plots show the occurrence of QPDPD in both the AIA 131 and 193 Å channels. Note that the AIA 193 Å bandpass includes the emission of the Fe XXIV line (T20 MK), indicating that the QPDPD are likely to be disturbances of the emission of a hot plasma with a temperature of 10–20 MK. Figure 13(e) shows the rotating filament along slice S’. Also, we included a 245 MHz radio flux profile (red curve, Figure 13(f), c.f. Figure 9) to show the repeated type-III radio bursts during the flare quasi-periodic energy release. Two vertical white dashed lines indicate the timing (14:06–14:27 UT) of the fast wave train propagating upwards, discussed in Section 2.1. The typical apparent propagation speeds of QPDPD, tracked along the two dotted lines (Figure 13(f)) were 172–27315) km s-1, which is much lower than the speed of the upward propagating wave train (664–1615 km s-1). A remote ribbon (R3) was also observed during 14:10–14:22 UT. It is evident that the fast wave train propagating upwards was detected during the rise of the flux rope, occurrence of the rotating filament F, the appearance of remote brightening R3, and the beginning of the QPDPD. On the other hand, we see the QPDPD for a much longer time interval, 14:14–15:00 UT.
We took the average running difference intensity extracted between two horizontal dotted lines in Figure 13(g) to determine the periodicity of the QPDPD with the wavelet transform (Figure 13(h)). Interestingly, the QPDPD have periods of 95 s and 240 s with the significance level of 99%. These periods are not exactly the same as observed simultaneously in the SXR flux time derivative (70–140 s), and in the upward rapidly-propagating wave train (decreasing from 240 s to 120 s). However, the periods are sufficiently close to each other to indicate that they may have the same origin.
3. DISCUSSION AND CONCLUSION
We presented multi-wavelength observations of a long duration M1.9 eruptive flare with quasi-periodic processes. The main findings of this study are as follows:
(1) We detected a quasi-periodic pulsation (QPP) in the GOES SXR flux time derivative with periods of 70 s and 140 s during the flare impulsive phase (14:06–14:27 UT), and 100 s after the flare maximum (14:30–15:00 UT). A similar periodicity (140 s) was detected in the metric/decimetric radio bursts (i.e., 245/610 MHz) during 14:06–14:27 UT.
(2) A quasi-periodic wave train propagating rapidly upward was detected in the AIA 171 and 193 Å channels during the flare impulsive phase (14:06–14:27 UT). The wave front consists of a sequence of multiple wavefronts (6–7) propagating outwards from the apparent energy-release site in the corona. The speeds of the fronts range in 664–1416 km s-1, and the instant period decreasing from 240 s to 120 s. This value of the period is close to the period of the metric/decimetric radio bursts and SXR flux time derivative, suggesting their common origin.
(3) The flare started at 14:00 UT with a lateral/radial expansion of the overlying active region loops. The speed of the lateral expansion of the CME (F1) in the low corona was 64–472 km s-1 (as seen at 171/335 Å). In addition, a fast EUV wavefront (F2, 657 km s-1) was also detected ahead of the CME frontal loops (F1), which may be interpreted as a piston-driven EUV fast-mode wave. The COR-1 image shows the front F2 ahead of the CME flanks (north and south), suggesting the presence of EUV wave. However, no type-II radio burst was observed during the eruption. The AIA 131 Å images reveal the formation/eruption of a hot flux rope structure with a speed of 200 km s-1, which is linked to the core of the CME observed by STEREO COR1.
(4) The magnetic field configuration of the flare site was similar to a breakout topology. AIA 171 Å images clearly show a cusp structure (a possible magnetic null point) and underlying closed loops well before the flare. RHESSI images reveal a loop-top source above the flare arcade, whereas NRH images show the metric/decimetric type III sources almost above the cusp. Therefore, the particle acceleration site is likely to be in the cusp region between the NRH source and the RHESSI loop-top source. The type III radio sources (NRH) and the EUV quasi-periodic rapidly-propagating wave train originate nearly at the same region.
(5) We observed a filament (F) rotating in the clockwise direction near the southern footpoint of the flux rope. The flux rope eruption and filament rotation were seen to be associated with the formation of a remote ribbon R3. It is likely that the erupting flux rope interacts with the cusp region or the null point, causing reconnection. The particle acceleration during the reconnection may produce R3 by a downward electron beam that follows the magnetic field with the footpoint at R3. Likewise, the metric/decimetric type III radio bursts are produced by the corresponding upward electron beam during the flare impulsive phase. Note that quasi-periodic upward propagating wave train of the EUV emission was detected during the flux rope eruption and formation of the remote ribbon (R3), suggesting their close connection.
(6) In addition to the upward propagating wave train, we see quasi-periodic downward propagating EUV intensity disturbances, QPDPD. The disturbances consist of multiple propagating fronts too, and last from about 14:14 UT till about 15:00 UT, during both the impulsive and decay phases of the flare. The QPDPD have two periodicities, 95 s and 240 s. The wave fronts propagate at the speed of 172–273 km s-1. The wave fronts have the concave horseshoe shape, which is different from the convex shape of the wave fronts in the upward propagating wave train. The disturbances are seen in the 131 Å and 193Å channels of SDO, and hence occur in the hot plasma of the supra-arcade of the flaring site.
(7) We observed tadpole-like structures in the wavelet power spectra of metric/decimetric bursts (245, 610 MHz). The periods of the multiple quasi-periodic radio bursts was found to be 70 s, 140 s.
Thus, the time sequence of the main phenomena detected in this flare is as follows:
| 14:00 | The flare begins. |
|---|---|
| 14:06–14:27 | Quasi-periodic variations of the SXR emission with the periods of about 70 s and 140 s. |
| 14:06–14:27 | Quasi-periodic variations of the radio signals at 245/610 MHz with the period of about 140 s. |
| 14:06–14:27 | Quasi-periodic wave train with the period decreasing from 240 s to 120 s, rapidly propagating upward at the speed 664–1416 km s-1, in 171 Å and 193 Å. |
| 14:10–14:22 | Remote ribbon forms. |
| 14:14–15:00 | CME is tracked. |
| 14:14–15:00 | Quasi-periodic downward propagating disturbances with the periods of 95 s and 240 s at the speed ranging in 172–273 km s-1, at 131 Å and 193 Å. |
| 14:16–14:24 | Quasi-periodic pulsations at 800–2000 MHz, with the period decreasing from 170 s to 30 s. |
| 14:30–15:00 | Quasi-periodic variations of the SXR emission with a period of about 100 s. |
The QPP in SXR may also arise from a modulation of the source volume and density, resulting in a modulation of the emission measure.
The quasi-periodic variation of the thermal, e.g., SXR signal could be produced by the variation of the plasma density (and/or temperature) in a compressive wave, e.g. fast or slow magnetoacoustic wave, propagating through the emitting plasma.
This possibility is unlikely because in this case the quasi-periodic modulation of the nonthermal emission should not be present there. Since, we observed quasi-periodic nonthermal radio emission (metric/decimetric/microwave and coronal type-III bursts) during the QPP in SXR. Therefore, QPP in SXR (derivative) is a result of quasi-periodic energy release. In addition, the observation of QPDPD during the SXR QPP also supports the quasi-periodic energy release.
The quasi-periodic wave train of the EUV emission, which propagates upward at the speed exceeding 1000 km s-1is most likely another example of a coronal fast magnetoacoustic wave train, similar to those detected by Liu et al. (2011) and in the follow-up works. We see that the periodicity of the quasi-periodic EUV fronts is similar as the quasi-periodic variation of the SXR derivative and radio emissions. These quasi-periodic processes could be produced by quasi-periodic magnetic reconnection. Furthermore, a numerical model by Longcope & Priest (2007) states that fast-mode waves can be launched by non-stationary current-sheet reconnection. However, it is not clear whether the quasi-periodicity of the energy release is spontaneous, or the wave train induces the quasi-periodic energy release by the mechanism developed by Nakariakov et al. (2006). In the latter case, the wave train periodicity appears because of the geometrical dispersion of fast magnetoacoustic waves (e.g. Roberts et al., 1984; Nakariakov et al., 2004; Pascoe et al., 2013b). The apparent decrease in the period (observed in EUV and decimetric emission) is consistent with the dispersive evolution. Moreover, the observed difference of the instant periodicities of the quasi-periodic signals detected in different bands is also consistent with this scenario, as the different emissions may be quasi-periodically modulated by the fast wave trains in different phases of its dispersive evolution. Our results confirm that quasi-periodic pulsations of the metric/decimetric radio emission are associated with the quasi-periodic fast wave train, supporting the findings of Mészárosová et al. (2009a, b, 2013). To the best of our knowledge, the simultaneous observation of a coronal fast wave train and tadpoles in decimetric radio bursts has not been reported before.
It is more difficult to explain the concave horseshoe-shaped quasi-periodic EUV intensity disturbances that propagate apparently downward at the speed of 172–273 km s-1, QPDPD. These features are seen in the EUV emission of the hot plasma, beginning during/after the launch of the flux rope. On one hand, the apparent downward propagation and the appearance in the hot plasma of the supra-arcade of the flaring site suggest that QPDPD could be a manifestation of the supra-arcade downflows.
Supra-arcade dark lanes, sometimes called supra-arcade downflows are hot (T10 MK) features above the flare loops, moving apparently downward, often observed in long-duration eruptive flares. They have been interpreted as shrinking loops/flux tubes, voids behind retracting loops in a vertical current sheet, or the development of the Rayleigh–Taylor instability at the head of reconnection low-density jets (e.g. McKenzie & Hudson, 1999, and references therein), Savage et al. 2012, Innes et al. 2014. Supra-arcade dark lanes are found to correlate with repeated HXR bursts, and are hence linked with the magnetic reconnection high in the corona (Asai et al., 2004). An alternative interpretation based on seismological information provided by transverse oscillations of the dark lanes suggests that the plasma flows in the supra-arcade dark lanes are actually directed upward (e.g. Verwichte et al., 2005).
Independently of the actual nature of the supra-arcade dark lanes, the concave horseshoe shape of the propagating fronts seen at AIA 193 Å may indicate the sequence of shrinking loops that are shed quasi-periodically from the quasi-periodic reconnection site, and move downward from the cusp region. This interpretation is supported by the time coincidence of the occurrence of QPDPD and the quasi-periodic pulsations in the SXR time derivative. The numerical simulation of the breakout model (Karpen et al., 2012) revealed similar multiple wave fronts (propagating with Alfv́enic speed) associated with the bursty magnetic reconnection (i.e., along with plasmoids) in the current-sheet behind an erupting flux rope. However, a detail study of multiple, quasi-periodic wavefronts in a breakout topology has not been carried out yet. On the other hand, supra-arcade dark lanes are usually seen as narrow wiggly dark lanes extended in the radial direction, which are gradually apparently moving downwards. This picture does not correspond to the detected in our study.
Another possibility would be to interpret the QPDPD as the downward propagating counterpart of the quasi-periodic upward rapidly-propagating wave train. In this case the difference in the oscillation period could be attributed to the difference in the dispersive evolution of fast waves in the oppositely directed fast magnetoacoustic waveguides. In this scenario the concave horseshoe shape of the propagating fronts could be associated with the refraction determined by the non-uniformity of the fast speed. Indeed, the wavefront deformation was clearly seen in the numerical simulations of this phenomenon, see, e.g., the inverse-bent fast wave fronts in the internal part of the waveguiding loop in Fig. 5 of Nisticò et al. (2014). However, the relatively low apparent speed of QPDPD, which is rather in the slow magnetoacoustic range, contradicts this interpretation. Another question would be why the upward fast waves are seen during the impulsive phase only, while the downward waves of the same nature are seen for much longer. In principle, the discrepancy between the apparent speed (200 km s-1) and the expected fast speed (several hundred km s-1 at least) could be attributed to the line-of-sight projection effect.
The QPDPD could also be associated with the leakage of a sausage oscillation from a flaring loop (e.g. Nakariakov et al., 2012). It would naturally explain the concave horseshoe shape of the wave fronts, which resembles the shape of the oscillating loop. Also, the duration of the wave leakage could be much longer than the impulsive phase, and hence last till 15:00 UT. However, this interpretation has the same difficulty as the downward propagating fast magnetoacoustic wave train scenario, the low apparent phase speed. Moreover, the typical periods of sausage oscillations are usually estimated as a few tens of seconds maximum, which is about one order of magnitude shorter than the observed periodicity.
It is also possible that QPDPD are slow magnetoacoustic waves that travel downward from the reconnection site along the magnetic field of the supra-arcade. In this case the observation is similar to a number of observations of slow magnetoacoustic waves in magnetic fan structures above sunspots (e.g. De Moortel & Nakariakov, 2012), with the only difference that this time these waves are seen to propagate downward. The apparent phase speed is determined by the high temperature of the emitting plasma and by the line-of-sight projection effect. The shape of the wave fronts, similarly to the slow waves in coronal active region fans, is determined by the timing of the excitation of the waves in different magnetic flux tubes, and the local tube speed in each flux tube, and also possibly by the local values of the plasma downflows or upflows. This scenario is also consistent with the time coincidence of the occurrence of QPDPD and the quasi-periodic pulsations in the soft X-ray time derivative. Unfortunately, the available set of observational data, and the lack of relevant modelling do not allow us to discriminate among the above-mentioned interpretations of QPDPD. Our study indicates the need for a dedicated study of this phenomenon. Possibly, a combination of imaging and spectral data would allow one to discriminate between different interpretation of this phenomenon.
References
- Antiochos (1998) Antiochos, S. K. 1998, ApJ, 502, L181
- Antiochos et al. (1999) Antiochos, S. K., DeVore, C. R., & Klimchuk, J. A. 1999, ApJ, 510, 485
- Asai et al. (2004) Asai, A., Yokoyama, T., Shimojo, M., & Shibata, K. 2004, ApJ, 605, L77
- Aschwanden (2004) Aschwanden, M. J. 2004, Physics of the Solar Corona. An Introduction (Praxis Publishing Ltd)
- Benz (2017) Benz, A. O. 2017, Living Reviews in Solar Physics, 14, 2
- Chen et al. (2016) Chen, S.-X., Li, B., Xiong, M., Yu, H., & Guo, M.-Z. 2016, ApJ, 833, 114
- De Moortel & Nakariakov (2012) De Moortel, I., & Nakariakov, V. M. 2012, Royal Society of London Philosophical Transactions Series A, 370, 3193
- Goddard et al. (2016) Goddard, C. R., Nisticò, G., Nakariakov, V. M., Zimovets, I. V., & White, S. M. 2016, A&A, 594, A96
- Howard et al. (2008) Howard, R. A., et al. 2008, Space Sci. Rev., 136, 67
- Hurford et al. (2002) Hurford, G. J., et al. 2002, Sol. Phys., 210, 61
- Innes et al. (2014) Innes, D. E., Guo, L.-J., Bhattacharjee, A., Huang, Y.-M., & Schmit, D. 2014, ApJ, 796, 27
- Jiricka et al. (1993) Jiricka, K., Karlicky, M., Kepka, O., & Tlamicha, A. 1993, Sol. Phys., 147, 203
- Kaiser et al. (2008) Kaiser, M. L., Kucera, T. A., Davila, J. M., St. Cyr, O. C., Guhathakurta, M., & Christian, E. 2008, Space Sci. Rev., 136, 5
- Karpen et al. (2012) Karpen, J. T., Antiochos, S. K., & DeVore, C. R. 2012, ApJ, 760, 81
- Kerdraon & Delouis (1997) Kerdraon, A., & Delouis, J.-M. 1997, in Lecture Notes in Physics, Berlin Springer Verlag, Vol. 483, Coronal Physics from Radio and Space Observations, ed. G. Trottet, 192
- Kumar & Cho (2014) Kumar, P., & Cho, K.-S. 2014, A&A, 572, A83
- Kumar et al. (2013) Kumar, P., Cho, K.-S., Chen, P. F., Bong, S.-C., & Park, S.-H. 2013, Sol. Phys., 282, 523
- Kumar & Innes (2015) Kumar, P., & Innes, D. E. 2015, ApJ, 803, L23
- Kumar & Manoharan (2013) Kumar, P., & Manoharan, P. K. 2013, A&A, 553, A109
- Kumar et al. (2016) Kumar, P., Nakariakov, V. M., & Cho, K.-S. 2016, ApJ, 822, 7
- Lecacheux (2000) Lecacheux, A. 2000, Washington DC American Geophysical Union Geophysical Monograph Series, 119, 321
- Lemen et al. (2012) Lemen, J. R., et al. 2012, Sol. Phys., 275, 17
- Lin et al. (2002) Lin, R. P., et al. 2002, Sol. Phys., 210, 3
- Liu et al. (2012) Liu, W., Ofman, L., Nitta, N. V., Aschwanden, M. J., Schrijver, C. J., Title, A. M., & Tarbell, T. D. 2012, ApJ, 753, 52
- Liu et al. (2011) Liu, W., Title, A. M., Zhao, J., Ofman, L., Schrijver, C. J., Aschwanden, M. J., De Pontieu, B., & Tarbell, T. D. 2011, ApJ, 736, L13
- Longcope & Priest (2007) Longcope, D. W., & Priest, E. R. 2007, Physics of Plasmas, 14, 122905
- Mann et al. (1999) Mann, G., Aurass, H., Klassen, A., Estel, C., & Thompson, B. J. 1999, in ESA Special Publication, Vol. 446, 8th SOHO Workshop: Plasma Dynamics and Diagnostics in the Solar Transition Region and Corona, ed. J.-C. Vial & B. Kaldeich-Schü, 477
- Mann et al. (2003) Mann, G., Klassen, A., Aurass, H., & Classen, H.-T. 2003, A&A, 400, 329
- McKenzie & Hudson (1999) McKenzie, D. E., & Hudson, H. S. 1999, ApJ, 519, L93
- Mészárosová et al. (2013) Mészárosová, H., Dudík, J., Karlický, M., Madsen, F. R. H., & Sawant, H. S. 2013, Sol. Phys., 283, 473
- Mészárosová et al. (2009a) Mészárosová, H., Karlický, M., Rybák, J., & Jiřička, K. 2009a, A&A, 502, L13
- Mészárosová et al. (2009b) Mészárosová, H., Karlický, M., Rybák, J., & Jiřička, K. 2009b, ApJ, 697, L108
- Muhr et al. (2014) Muhr, N., Veronig, A. M., Kienreich, I. W., Vršnak, B., Temmer, M., & Bein, B. M. 2014, Sol. Phys., 289, 4563
- Nakariakov et al. (2004) Nakariakov, V. M., Arber, T. D., Ault, C. E., Katsiyannis, A. C., Williams, D. R., & Keenan, F. P. 2004, MNRAS, 349, 705
- Nakariakov et al. (2006) Nakariakov, V. M., Foullon, C., Verwichte, E., & Young, N. P. 2006, A&A, 452, 343
- Nakariakov et al. (2012) Nakariakov, V. M., Hornsey, C., & Melnikov, V. F. 2012, ApJ, 761, 134
- Nisticò et al. (2014) Nisticò, G., Pascoe, D. J., & Nakariakov, V. M. 2014, A&A, 569, A12
- Ofman et al. (2011) Ofman, L., Liu, W., Title, A., & Aschwanden, M. 2011, ApJ, 740, L33
- Oliver et al. (2015) Oliver, R., Ruderman, M. S., & Terradas, J. 2015, ApJ, 806, 56
- Pascoe et al. (2013a) Pascoe, D. J., Nakariakov, V. M., & Kupriyanova, E. G. 2013a, A&A, 560, A97
- Pascoe et al. (2013b) Pascoe, D. J., Nakariakov, V. M., & Kupriyanova, E. G. 2013b, A&A, 560, A97
- Roberts et al. (1983) Roberts, B., Edwin, P. M., & Benz, A. O. 1983, Nature, 305, 688
- Roberts et al. (1984) Roberts, B., Edwin, P. M., & Benz, A. O. 1984, ApJ, 279, 857
- Savage et al. (2012) Savage, S. L., McKenzie, D. E., & Reeves, K. K. 2012, ApJ, 747, L40
- Schou et al. (2012) Schou, J., et al. 2012, Sol. Phys., 275, 229
- Shen et al. (2013) Shen, Y.-D., Liu, Y., Su, J.-T., Li, H., Zhang, X.-F., Tian, Z.-J., Zhao, R.-J., & Elmhamdi, A. 2013, Sol. Phys., 288, 585
- Shestov et al. (2015) Shestov, S., Nakariakov, V. M., & Kuzin, S. 2015, ApJ, 814, 135
- Torrence & Compo (1998) Torrence, C., & Compo, G. P. 1998, Bulletin of the American Meteorological Society, 79, 61
- Verwichte et al. (2005) Verwichte, E., Nakariakov, V. M., & Cooper, F. C. 2005, A&A, 430, L65
- Vilmer et al. (2002) Vilmer, N., Krucker, S., Lin, R. P., & Rhessi Team. 2002, Sol. Phys., 210, 261
- Warmuth (2015) Warmuth, A. 2015, Living Reviews in Solar Physics, 12, 3
- Warmuth & Mann (2005) Warmuth, A., & Mann, G. 2005, A&A, 435, 1123
- Warmuth & Mann (2011) Warmuth, A., & Mann, G. 2011, A&A, 532, A151
- White et al. (2005) White, S. M., Bastian, T. S., Bradley, R., Parashare, C., & Wye, L. 2005, in Astronomical Society of the Pacific Conference Series, Vol. 345, From Clark Lake to the Long Wavelength Array: Bill Erickson’s Radio Science, ed. N. Kassim, M. Perez, W. Junor, & P. Henning, 176
- Williams et al. (2002) Williams, D. R., Mathioudakis, M., Gallagher, P. T., Phillips, K. J. H., McAteer, R. T. J., Keenan, F. P., Rudawy, P., & Katsiyannis, A. C. 2002, MNRAS, 336, 747
- Williams et al. (2001) Williams, D. R., et al. 2001, MNRAS, 326, 428
- Yu et al. (2016) Yu, H., Li, B., Chen, S.-X., Xiong, M., & Guo, M.-Z. 2016, ApJ, 833, 51
- Yu et al. (2017) Yu, H., Li, B., Chen, S.-X., Xiong, M., & Guo, M.-Z. 2017, ApJ, 836, 1
- Yuan et al. (2013) Yuan, D., Shen, Y., Liu, Y., Nakariakov, V. M., Tan, B., & Huang, J. 2013, A&A, 554, A144
- Zhang et al. (2015) Zhang, Y., Zhang, J., Wang, J., & Nakariakov, V. M. 2015, A&A, 581, A78