Galaxy Formation Through Filamentary Accretion at
Abstract
We present ALMA observations of the dust continuum and [C II] 158m line emission from the Lyman Break Galaxy WMH5. These observations at spatial resolution show a compact ( kpc) main galaxy in dust and [C II] emission, with a ‘tail’ of emission extending to the east by about 5 kpc (in projection). The [C II] tail is comprised predominantly of two distinct sub-components in velocity, separated from the core by and km s -1, with narrow intrinsic widths of about 80 km s-1, which we call ‘sub-galaxies’. The sub-galaxies themselves are extended east-west by about kpc in individual channel images. The [C II] tail joins smoothly into the main galaxy velocity field. The [C II] line to continuum ratios are comparable for the main and sub-galaxy positions, within a factor 2. In addition, these ratios are comparable to LBGs. We conjecture that the WMH5 system represents the early formation of a galaxy through the accretion of smaller satellite galaxies, embedded in a smoother gas distribution, along a possibly filamentary structure. The results are consistent with current cosmological simulations of early galaxy formation, and support the idea of very early enrichment with dust and heavy elements of the accreting material.
1 Introduction
The formation of the first galaxies in the Universe, those at , or within 1 Gyr of the Big Bang, is a forefront question in modern astronomy. How these galaxies accrete the gas that drives early star formation, and the relative dust attenuation, remains highly uncertain. These issues have attained new pertinence as constraints on the evolution of the neutral fraction of the intergalactic medium have solidified. Current observational constraints based on e.g. the cosmic microwave background (CMB), the Gunn-Peterson effect, and the effect of the neutral intergalactic medium (IGM) on Ly emission from early galaxies, suggest that the Universe was highly ionized at , and significantly neutral at , with a plausible neutral fraction of 50% at (Fan et al. 2006a; Robertson et al. 2015; Ota et al. 2017; Greig & Mesinger 2017). This evolution in the cosmic neutral fraction suggests substantial star formation at redshifts to 8, if the IGM is reionized by star forming galaxies (Fan et al. 2006b).
The Atacama Large Millimeter/submillimeter Array (ALMA) has opened a new window on the early Universe, with the sensitivity and resolution to perform detailed studies of the dust and cool gas in the earliest galaxies. Of particular interest are observations of the [C II] 158 m line at . This line is typically the brightest emission line from star forming galaxies at meter through FIR wavelengths, tracing both the cool and warm interstellar medium (ISM) in galaxies (e.g., Pineda et al. 2013; Carilli & Walter 2013). Observation of dust in the most distant galaxies provides key constraints on the extinction properties, while the [C II] line provides a means of tracing gas kinematics and obtaining information on the structure of the ISM. These quantities relate to the star formation rate of the galaxy.
Cosmological simulations of early galaxy formation have shown that the [C II] line can be used not only to study the ISM of these sources (Vallini et al. 2013, 2015; Pallottini et al. 2017), but it might also probe the overall galaxy dynamics, including supernova-driven outflows (Gallerani et al., 2016). In the local universe a well-established [C II]-star formation rate (SFR) relation holds for a wide range of galaxy types, from metal poor dwarf galaxies, to starbursts, ultra-luminous infrared galaxies, and active galactic nucleus (AGN) hosting galaxies (De Looze et al. 2014; Pineda et al. 2014; Herrera-Camus et al. 2015). However, many of the high- Lyman-Break Galaxies (LBGs) and Lyman- Emitting Galaxies (LAEs) deviate from this relation for yet unclear reasons, likely related to their different metallicity, ionization state, or more efficient supernova feedback (Capak et al., 2015).
The galaxy WMH5 at is a useful test-bed to investigate detailed processes in the formation of early galaxies. This galaxy was discovered in the LBG search of Willott et al. (2013) as one of the most luminous LBGs at (near-IR magnitude AB ), with detected Ly emission. Willott et al. (2015) discovered both thermal emission from dust, and [C II] line emission, from this galaxy in Cycle 2 ALMA observations at resolution. They presented a detailed analysis of the integrated spectral energy distribution (SED) of the galaxy from the optical through submm. The inferred SFR values are between 33 and 66 year-1, depending on the tracer, and the stellar mass is . The overall SED has dust attenuation of . However, the main component of the galaxy seen in the dust and [C II] is spatially offset west of the bright NIR component. The [C II] at the NIR position is also offset significantly in velocity relative to the main [C II] component (km s-1). Willott et al. (2015) suggest a merging galaxy system, however, the spatial resolution and sensitivity of these early ALMA observations were insufficient to determine the detailed structure of this complex system.
In this paper, we present subarcsecond angular resolution and high sensitivity observations of the [C II] and dust emission from WMH5 using ALMA in Cycle 3. These observations present a clear picture of the processes occurring in WMH5. We assume (,,h)=(0.692,0.308,0.678) (Planck Collaboration et al., 2016) throughout. At this distance, 1 arcsecond corresponds to 5.81 proper kpc at the redshift of WMH5 (=6.0695; Willott et al. 2015).
2 Observations
The [C II] 158 m and thermal dust emission from WMH5 were observed with ALMA in Cycle 3 in configuration C40-3 between 2016 August 3 and 7. Between 40 and 43 antennas were used for each observation. The total time was hours, out of which 4 hours were spent on source. A total bandwidth of 7.5 GHz was used, split into four 2 GHz sub-bands spanning 253 to 257 GHz and 268 to 272 GHz (ALMA band 6). One sub-band was centered on the [C II] emission, redshifted to GHz, while the other three were used to measure the rest frame m continuum emission. The Cycle 3 data were calibrated using the standard calibration script prepared by the Joint ALMA Observatory staff.
Using only the Cycle 3 data results in detections of both line and continuum emission. However, to improve the quality of the data, we combined these data with the Cycle 2 observations of Willott et al. (2015). In short, they observed in June 2014 with 29-32 antennas, 7.5 GHz of bandwidth, and had 95 minutes of on-source integration time.
An issue arose while combining the two datasets, based on the relative weights of the uv data. The definition of the weight factor as a function of channel width, integration time, and system temperature changed on September 4, 2014, when CASA updated from version 4.2.1 to 4.2.2111https://casa.nrao.edu/Memos/CASA-data-weights.pdf. Since the Cycle 2 observations were made before this time and the Cycle 3 observations after, the average weights differed by multiple orders of magnitude (i.e., for Cycle 2 and for Cycle 3). When using the CASA task clean to combine these two datasets, this caused the Cycle 3 data to completely dominate.
Two methods were tested to correct this. The first set all weights equal to one, so that all data are given equal weight. The other used the CASA task statwt, which resets weights based on the intrinsic scatter of the data. We compared images created using these approaches with the image made with the original weights. Both re-weighting methods resulted in images with lower rms noise levels than the original image, and similar channel maps. Since the statwt image had the lowest rms noise level and had weights based on properties of the data, we will use this weighting method for the following analysis.
While different visibility weighting schemes were applied to the data (i.e., Briggs weighting with robust parameters of 2.0, 1.5, 1.0), the best results were found for natural (robust 2.0) weighting. The synthesized beam was , with major axis position angle = . Using the three sub-bands that were not centered on the [C II] line, we created a continuum image with an RMS noise level of Jy beam-1. The remaining sub-band was used to create a line emission cube with km s-1 channels and an RMS noise level of 0.1 mJy beam-1.
3 Results
Figure 1 shows the [C II] channel images. We see emission from to km s-1, mostly going from west to east with increasing frequency (decreasing velocity). We also note that, in addition to this higher level emission, there is substantial (i.e., ) emission present to the east in select channels from to km s-1. We use these images and those that follow to define two positions. The centers of 2-dimensional Gaussian fits to a map using only channels where emission is concentrated in the west, named the “core” (2h26m27.0025s -52′38.4042′′), and of the map made using the channels where line emission extends to the east, named the “tail” (2h26m27.0208s -4∘52′38.4007′′). In this and subsequent analyses, we adopt zero velocity as [C II] emission redshifted to , consistent with Willott et al. (2015).
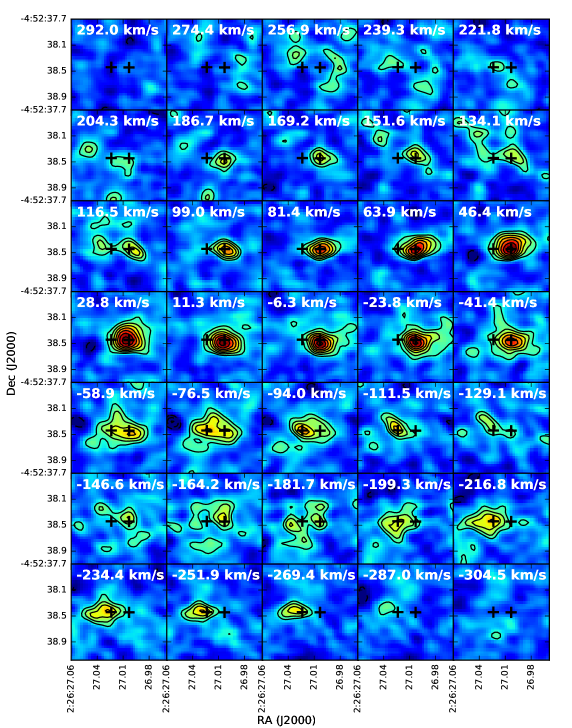
The channel images in Figure 1 show that most of the emission is concentrated in the core, but there are two distinct knots of emission in the tail to the east at and km s-1. These knots are more elongated east-west, extending EW by about in individual channels.
Figure 2 shows the integrated [C II] spectrum of the system and the spectra taken at the locations of the core and tail, over a single spatial pixel in the cleaned image. While the core is well fit by a single Gaussian, the tail is split into three different contributions: two narrow peaks, which we call SG-1 (or Sub-Galaxy-1) and SG-2, and a spectrally broad component, which we name “Diffuse”. We performed Gaussian fitting to the apparent three components of the tail. Figure 3 shows the resulting fits for the tail. Details of the Gaussian fits for the core and tail are given in Table 1.
| Source | Line Peak | Velocity | FWHM | Sv[CII] |
|---|---|---|---|---|
| [mJy beam-1] | [km s-1] | [km s-1] | [Jy beam-1km s-1] | |
| Core | ||||
| SG-1 | ||||
| SG-2 | ||||
| Diffuse |
The spectrally broad “Diffuse” component exhibits a similar centroid velocity as the core emission, suggesting that the diffuse emission is the spatial edge of the core emission. Alternatively, the Diffuse emission may originate from numerous discrete, spectrally narrow components that we cannot separate.
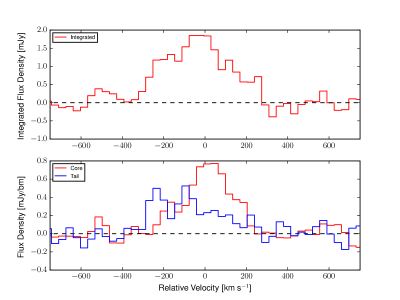
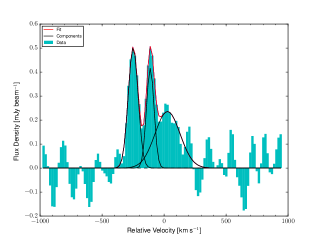
Figure 4 shows the velocity integrated (moment zero) [C II] emission contours overlaid on the ground-based near-IR image. A 2D Gaussian fit of the [C II] emission returns a deconvolved size of at , an integrated flux density of Jy km s-1, and a peak flux density of Jy beam-1 km s-1. However the [C II] emission is non-Gaussian in shape due to the multiple components already discussed. The centre of the near-IR emission is located close to the tail position, not at the peak of the core, as previously discussed by Willott et al. (2015). The spatial resolution of the near-IR image is insufficient to determine the fraction of flux coming from each region.
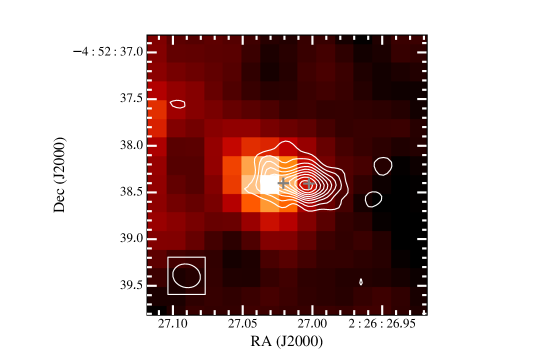
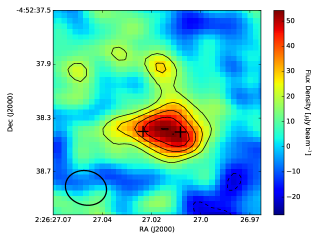
Figure 5 shows the m continuum emission. A Gaussian fit yields a deconvolved size of at , a peak flux density of Jy beam-1, an integrated flux density of mJy, and a central position of 2h26m27.0099s . The morphology is obviously different from the beam shape, with an extension to the east and a extension to the north. The peak of the continuum is located between the [C II] core and tail positions, but since this emission is a blend of the core and tail components, this is to be expected.
4 Analysis
4.1 [C II] Luminosities & SFRs
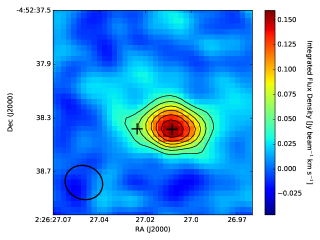
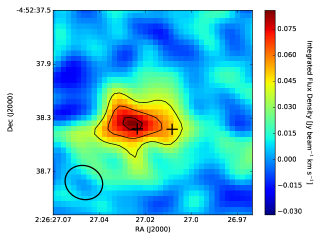
We first analyze the line emission, integrated over the velocity ranges corresponding predominantly to the core and sub-galaxies. The left side of Figure 6 shows the [C II] emission integrated over velocity ranges corresponding to the core galaxy (169 to -77 km s-1), while the right hand figure shows the [C II] emission integrated over the velocity range of the sub-galaxies (-94 to -305 km s-1). We then fit Gaussian models to the surface brightness distributions. We note that the spatial/spectral separation of the core and sub-galaxies is not completely clean, so the flux densities of the sub-galaxy complex may be overestimated.
The core moment zero image shows a higher peak, but is spatially more compact, with a deconvolved size of , and a velocity integrated flux density of Jy km s-1. The moment zero image of the sub-galaxies shows a larger spatial size, extending toward the core galaxy. The fit size is and the velocity integrated flux density is Jy km s-1. These [C II] line fluxes imply [C II] luminosities of: and .
While the combined flux densities of the tail components in Table 1 are considerably less than that of the core, these luminosities are comparable. This is reasonable, since these luminosities are derived from flux densities integrated over the entire emission area of each source, while the values in Table 1 represent only a single pixel. Since the tail emission is considerably more extended, its flux density at a given point will be less than that of the concentrated core, but the sum of each component may be comparable.
Using these luminosities, we can estimate the star formation rates, assuming the relationship given in equation 8 of Vallini et al. (2015) and a metallicity. Note that this relationship is based on the results of a cosmological simulation, where discrete values of metallicity (i.e., 1.0, 0.2, and 0.05 Z⊙) were assumed. This coarse sampling creates an inherent uncertainty in the relationship, which is exacerbated by additional assumptions (e.g., a Kennicutt-Schmidt power law index). Assuming a solar metallicity, the implied star formation rates for the core and sub-galaxies are year-1. If we assume a metallicity of , these values increase to year-1.
Equation 8 of Vallini et al. may also be used to solve for the metallicity of an object, given its SFR and [C II] luminosity. To find the total SFR of WMH5, we add SFRSED and SFRFIR of Willott et al. (2015), yielding M⊙ year-1. This addition is due to the fact that the core galaxy (their galaxy ‘A’) dominates the observed mm (rest-frame FIR) continuum emission, while the tail galaxies (their galaxy ‘B’) is the source of the observed NIR (rest-frame UV) emission. Since the sources of the mm and NIR emission are spatially separated, and the constructed SED is mainly shaped by the UV data, the addition of the two SFRs is required to find the total value for the galaxy complex.
We use the total SFR and our total [C II] luminosity of (, yielding for the system as a whole. However, due to the discrete metallicities probed by Vallini et al. (see their Figure 8), we only state a metallicity limit of .
4.2 [C II]-Continuum Ratio
At this high resolution, we are able to analyze separately the continuum and line surface brightness at the position of the core and sub-galaxies. The continuum surface brightnesses at the core and tail positions are Jy beam-1 and Jy beam-1, respectively.
For the line surface brightness, we use the spectral fitting results shown in Table 1. The core [C II] velocity integrated surface brightness is Jy beam-1 km s-1. For the tail position, the sum of the emission from the two sub-galaxies and the diffuse component gives: Jy beam-1 km s-1. The line to continuum ratio for the core is then: km s-1. The value for the tail is km s-1.
We compare these ratios to observations of other high redshift galaxies. In the sample of Capak et al. (2015), which consisted of main sequence galaxies observed in [C II], four galaxies were detected in rest-frame m continuum emission. These four give ratios of km s-1 (HZ4)222In Extended Table 1 of Capak et al. (2015), the [C II] flux of HZ4 should be Jy km s-1, km s-1 (HZ6), km s-1 (HZ9), and km s-1 (HZ10). Thus, the ratios of both segments of WMH5 fall within the scatter of the Capak et al. sample. Willott et al. (2015) show that the system as a whole has a [C II] line luminosity to FIR continuum luminosity ratio , which is larger than low redshift star forming galaxies by a factor of a few. They point out that such a large ratio: ‘…suggests extended star formation with low metallicity and an intense radiation field.’
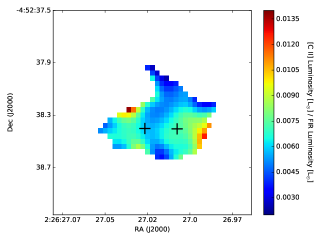
In addition to these two discrete locations, we may examine the ratio of [C II] to FIR luminosities over the source as a whole (see Figure 7). The integrated [C II] flux density was converted to a luminosity using equation 1 of Solomon et al. (1992). A greybody spectrum identical to that used by Willott et al. (2015) was adopted to convert our continuum flux density to a FIR luminosity (i.e., =30 K, , and a FIR range of to 122.5 m). Note that we assume that these parameters are uniform across the source.
This ratio plot shows that while the core and far-east tail areas behave similarly, there is a gap of low between them. A similar area of low [C II] emission is observed in the simulations of Pallottini et al. (2017). In their Section 3.3.3, they reason that this ‘middle ground’ contains diffuse (low ) molecular clouds, which only weakly emit [C II] (). In addition, the relatively high temperature of the CMB at ( K) diminishes the [C II] luminosity.
4.3 Velocity Behavior
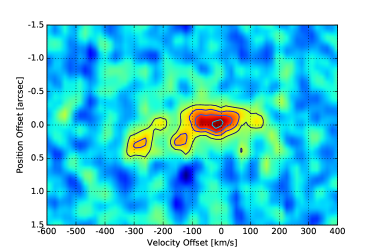
Figure 8 is a position-velocity (PV) plot. Again, in addition to the core emission at zero offset, two distinct tail components are evident, plus diffuse emission throughout. The spatial offset of the two tail components from the core is in projection, or about 1.4 kpc.
This PV plot is similar to Figure 6 of Willott et al. (2015), although at higher spatial resolution. While they detected SG-1 (their component ‘B’), we are able to separate their component ‘A’ into the core galaxy and SG-2. Both subgalaxies are clearly distinct from the core galaxy, and show similar positional offsets.
Our best-fit velocities (Table 1) and those of Willott et al. (2015) (their Figure 1) are also in agreement, with component ‘A’ (km s-1) and our ‘core’ (km s-1) in agreement. In addition, component ‘B’ (km s-1) and SG-1 (km s-1) agree.
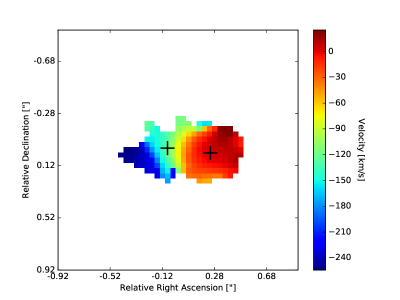
While the velocity of the tail components is multivalued, we may create a velocity weighted (moment 1) image of the core galaxy. The zero of velocity here is assumed to be the [C II] emission redshifted to . Figure 9 shows that the core galaxy is not highly reminiscent of either a solid-body rotator or a classic rotating disk, but does show an identifiable velocity gradient.
4.4 Dust Mass
By using equation 1 of Bianchi (2013), our m continuum flux density (mJy), and the dust temperature and emissivity index adopted by Willott et al. (2015), we find a dust mass of . For the dust absorption coefficient, we use of Wang et al. (2011), with m2 kg-1 at THz.
However, due to the weak constraints that we have on the assumed SED features, we additionally assume ranges for dust temperature and emissivity index of K and (Capak et al. 2015; Neeleman et al. 2017). This conservative range yields a range of possible dust masses of the WMH5 system of .
This range may be compared to other high redshift galaxies with similar SFRs (i.e., year-1). The gravitationally lensed object A2744-YD4 (; Laporte et al. 2017) exhibits a SFR year-1, but a small dust mass of . This relatively small amount of dust may be simply explained by the different ages of each object (WMH5 is observed 300 Myr later). This reflects differing amounts of past star formation activity that each object has undergone.
If the same assumptions are made to transform the m continuum flux densities of the Capak et al. (2015) objects to dust masses, we find a range of M⊙, which are similar to our estimates for WMH5.
5 Discussion
The merger interpretation emerging from the present observations is supported by recent AMR, zoomed simulations of high redshift galaxies with properties similar to WMH5. Pallottini et al. (2017) studied in detail Dahlia, a typical LBG with a SFR , and an effective stellar radius of kpc. This model galaxy has 14 satellites distributed over a distance of 100 kpc from it. The six largest ones have a dark matter halo mass in the range , three among these are located within 3 kpc from Dahlia’s center (whereas our sub-galaxies are kpc distant). The two most prominent among these satellites (at a distance of 12 and 15 kpc from the center) sustain considerable star formation rates of 30 and , and have a stellar mass of and . Their star formation history is relatively bursty and increases with time. They are also the oldest among the satellites, with an age at of 350 Myr. Compared to Dahlia () their stellar mass is 38% and 12% smaller, respectively. The satellites are mostly aligned along three main filaments connecting to the center (see Fig. 4 of Pallottini et al. 2017); they are also much more compact than Dahlia: the largest satellite within 3 kpc has an effective radius of 0.2 kpc, i.e. about 1/3 of that the central galaxy.
Interestingly, the three nearby satellites are clearly visible in the simulated [C II] maps, thus supporting the analogy with our observations. The satellites move at km s-1, i.e. about half the virial velocity of Dahlia. They have also very low metallicity, due to their relatively young age ( Myr). Compared to Dahlia, which has a metallicity equal to , the nearby satellites barely reach ; the two distant ones instead have and . If the dust content scales with metallicity, this should result in a substantially lower extinction. Thus, the comparison with theoretical models supports the idea that WMH5 features the build-up of a galaxy occurring via infall and merging of a number of star-forming satellite sub-galaxies.
Of course, we have to be aware that the comparison with observations is here performed only against a single, although very similar, simulated system. Thus, it is probably unsafe to push the comparison beyond the present analysis. Before drawing more robust conclusions one would need to extend the study to a larger sample of simulated galaxies which could inform us on the frequency of multiple/merger systems expected at these early redshifts. Nevertheless, the emerging scenario is one in which an intriguing resemblance between theoretical expectations and the data analysis certainly exists.
Our geometry is also akin to that found in Katz et al. (2016) (their Figure 20), in that we have a ‘filament’ of gas falling into a galaxy, with spatially separated [C II] and UV/Ly emission. Katz et al. interpret this geometry as being caused by the infalling galaxy causing new star formation at the interface of the filament and galaxy, while introducing relatively pristine (low metallicity) gas. This low- environment is weak in [C II] emission, but high in UV/Ly. Deeper inside the host galaxy, the environment is more processed (higher metallicity), so while the UV/Ly emission is obscured, [C II] emission may escape.
6 Conclusion
New ALMA observations of the dust continuum and [C II] 158 m emission from the LBG WMH5 show a compact main galaxy in dust and [C II] emission, with two, what we call, ‘sub-galaxies’ located along a filamentary tail extending about 5 kpc (in projection) to the east. These sub-galaxies are distinct in velocity, with narrow velocity dispersions of about 80 km s-1, and the tail joins smoothly into the main galaxy velocity field. The sub-galaxies themselves are extended east-west by about in individual channel images.
We conjecture that the WMH5 system represents the early formation of a galaxy through the accretion of smaller satellite galaxies embedded in a smoother gas distribution, along a filamentary structure. While we cannot rule-out outflow, we find that notion less likely, given the narrow velocity dispersion of the individual sub-galaxies. Such narrow velocity dispersion is more characteristic of gravitational or tidal features than strong outflows. Likewise, the significant dust masses and star formation rates suggest individual sub-galaxies, as might be expected in a coalescing galaxy system.
Our filamentary interpretation assumes a three-dimensional structure that we are unable to directly observe. However, the continuity of the velocity field from the core to each sub-galaxy, the small velocity widths of each sub-galaxy, the intrinsic E-W extension in channel images of the sub-galaxies themselves, and the similarity of these results to those found using three-dimensional cosmological simulations all provide circumstantial evidence supporting this conclusion, although the term filamentary remains presumptive.
These observations highlight the power of ALMA to image early galaxy formation. The results support the idea that early galaxies can be enriched in heavy elements and dust due to their very early history of star formation, including enrichment of the material that accretes onto main galaxy. The new Band 5 system of ALMA is currently being commissioned (163 GHZ to 211 GHz). This band will open the to 11 range for high resolution, sensitive observations of the [C II] 158 m line.
This paper makes use of the following ALMA data: ADS/JAO.ALMA #2013.1.00815.S and #2015.1.00834.S. ALMA is a partnership of ESO (representing its member states), NSF (USA) and NINS (Japan), together with NRC (Canada) and NSC and ASIAA (Taiwan), in co- operation with the Republic of Chile. The Joint ALMA Observatory is operated by ESO, AUI/NRAO and NAOJ. GCJ is grateful for support from NRAO through the Grote Reber Doctoral Fellowship Program. AF acknowledges support from the ERC Advanced Grant INTERSTELLAR H2020/740120.
References
- Bianchi (2013) Bianchi, S. 2013, A&A, 552, A89
- Capak et al. (2015) Capak, P. L., Carilli, C., Jones, G., et al. 2015, Nature, 522, 455
- Carilli & Walter (2013) Carilli, C. L., & Walter, F. 2013, ARA&A, 51, 105
- De Looze et al. (2014) De Looze, I., Cormier, D., Lebouteiller, V., et al. 2014, A&A, 568, A62
- Fan et al. (2006a) Fan, X., Strauss, M. A., Becker, R. H., et al. 2006, AJ, 132, 117
- Fan et al. (2006b) Fan, X., Carilli, C. L., & Keating, B. 2006, ARA&A, 44, 415
- Gallerani et al. (2016) Gallerani, S., Pallottini, A., Feruglio, C., et al. 2016, arXiv:1604.05714
- Greig & Mesinger (2017) Greig, B., & Mesinger, A. 2017, MNRAS, 465, 4838
- Herrera-Camus et al. (2015) Herrera-Camus, R., Bolatto, A. D., Wolfire, M. G., et al. 2015, ApJ, 800, 1
- Jarvis et al. (2013) Jarvis, M. J., Bonfield, D. G., Bruce, V. A., et al. 2013, MNRAS, 428, 1281
- Katz et al. (2016) Katz, H., Kimm, T., Sijacki, D., & Haehnelt, M. 2016, arXiv:1612.01786
- Laporte et al. (2017) Laporte, N., Ellis, R. S., Boone, F., et al. 2017, ApJ, 837, L21
- Neeleman et al. (2017) Neeleman, M., Kanekar, N., Prochaska, J. X., et al. 2017, Science, 355, 1285
- Ota et al. (2017) Ota, K., Iye, M., Kashikawa, N., et al. 2017, arXiv:1703.02501
- Pallottini et al. (2017) Pallottini, A., Ferrara, A., Gallerani, S., et al. 2017, MNRAS, 465, 2540
- Pineda et al. (2013) Pineda, J. L., Langer, W. D., Velusamy, T., & Goldsmith, P. F. 2013, A&A, 554, A103
- Pineda et al. (2014) Pineda, J. L., Langer, W. D., & Goldsmith, P. F. 2014, A&A, 570, A121
- Planck Collaboration et al. (2016) Planck Collaboration, Adam, R., Ade, P. A. R., et al. 2016, A&A, 594, A1
- Robertson et al. (2015) Robertson, B.E., Ellis, R.S., Furlanetto, S., Dunlop, J.S 2015, ApJ, 802, L19
- Solomon et al. (1992) Solomon, P. M., Downes, D., & Radford, S. J. E. 1992, ApJ, 398, L29
- Vallini et al. (2013) Vallini, L., Gallerani, S., Ferrara, A., & Baek, S. 2013, MNRAS, 433, 1567
- Vallini et al. (2015) Vallini, L., Gallerani, S., Ferrara, A., Pallottini, A., & Yue, B. 2015, ApJ, 813, 36
- Wang et al. (2011) Wang, R., Wagg, J., Carilli, C. L., et al. 2011, AJ, 142, 101
- Willott et al. (2013) Willott, C. J., McLure, R. J., Hibon, P., et al. 2013, AJ, 145, 4
- Willott et al. (2015) Willott, C. J., Carilli, C. L., Wagg, J., & Wang, R. 2015, ApJ, 807, 180