How do spiral arm contrasts relate to bars, disk breaks and other fundamental galaxy properties?
Abstract
We investigate how the properties of spiral arms relate to other fundamental galaxy properties, including bars and disc breaks. We use previously published measurements of those properties, and our own measurements of arm and bar contrasts for a large sample of galaxies, using images from the Spitzer Survey of Stellar Structure in Galaxies (S4G). Flocculent galaxies are clearly distinguished from other spiral arm classes, especially by their lower stellar mass and surface density. Multi-armed and grand-design galaxies are similar in most of their fundamental parameters, excluding some bar properties and the bulge-to-total ratio. Based on these results, we revisit the sequence of spiral arm classes, and discuss classical bulges as a necessary condition for standing spiral wave modes in grand-design galaxies. We find a strong correlation between bulge-to-total ratio and bar contrast, and a weaker correlation between arm and bar contrasts. Barred and unbarred galaxies exhibit similar arm contrasts, but the highest arm contrasts are found exclusively in barred galaxies. Interestingly, the bar contrast, and its increase from flocculent to grand-design galaxies, is systematically more significant than that of the arm contrast. We corroborate previous findings concerning a connection between bars and disc breaks. In particular, in grand-design galaxies the bar contrast correlates with the normalised disc break radius. This does not hold for other spiral arm classes or the arm contrast. Our measurements of arm and bar contrast and radial contrast profiles are publicly available.
keywords:
galaxies: structure – galaxies: evolution – galaxies: stellar content – galaxies: fundamental parameters – galaxies: spiral – galaxies: photometry1 Introduction
Spiral arms in disc galaxies show different geometrical properties, levels of symmetry and amplitudes. They can be classified visually in three distinct classes: flocculent, multi-armed and grand-design. Modern theories on the formation of spiral arms indicate different underlying physics for these three arm classes. Flocculent galaxies show short and patchy spiral arms without underlying density waves in the old stellar component (Elmegreen & Elmegreen, 1984; Buta et al., 2015). This indicates that the spiral arms of flocculent galaxies are mainly triggered by local gravitational instabilities concerning old stars (Julian & Toomre, 1966; Toomre & Kalnajs, 1991), gas (Goldreich & Lynden-Bell, 1965) and the resulting formation of new stars (e.g. Seiden & Gerola, 1979; Elmegreen, 1981; Elmegreen & Elmegreen, 1984). In addition, Elmegreen et al. (2011) find that only 15% of optically flocculent galaxies show a weak two-armed spiral pattern in near-IR observations. In contrast, grand-design galaxies show spiral arms with high symmetry on large scales. These spiral arms may be caused by spiral density waves as initially suggested by Lindblad (1959). Such density waves can be driven by bars or satellites (e.g. Athanassoula, 1980), or triggered by companions (e.g. Dobbs & Pringle, 2010), or form self-consistently as in the density wave theory of Lin & Shu (1964), or the swing amplification mechanism (Toomre 1981, see also Goldreich & Lynden-Bell 1965). An alternative theory for grand-design spirals is the manifold theory (e.g. Romero-Gómez et al., 2006; Athanassoula, 2012; Harsoula et al., 2016, and references therein) but this has so far been fully worked out only for grand-design spirals due to bars. For both theories, gas is compressed and shocked in the high density regions of these spirals. As a direct result of this process gas densities and star formation rates are enhanced turning the spiral arms bright in optical observations (Roberts, 1969). Multi-armed galaxies are believed to be an intermediate case between grand-design and flocculent galaxies. Elmegreen & Elmegreen (1984, 1995) find that the stellar spirals of multi-armed galaxies are regular in the central parts, but become more and more irregular at larger radii. For a general review of the observational properties of spirals and particularly of the theories that have strived to explain their properties and evolution see Athanassoula (1984) and Dobbs & Baba (2014).
A second fundamental structural component of disc galaxies is bars. It is well-known that the majority of disc galaxies ( 65%) in the local universe have a bar (e.g. Eskridge et al., 2000; Knapen et al., 2000; Whyte et al., 2002; Menéndez-Delmestre et al., 2007; Marinova & Jogee, 2007). Some bar properties depend strongly on the Hubble type of the galaxy. Early-type disc galaxies show the tendency to have long, high amplitude bars with flat radial surface brightness profiles. The amplitude of the corresponding spiral arms is radially decreasing. In contrast, late-type galaxies have short, low amplitude bars with an exponential profile and increasing arm amplitudes (Elmegreen & Elmegreen, 1985). Athanassoula & Misiriotis (2002) and Combes & Elmegreen (1993) have conducted N-body simulations of barred galaxies and conclude that flat bars emerge in galaxies with quickly increasing inner rotation curves, whereas exponential bars correlate with slowly rising rotation curves. The main difference between these two cases is the component dominating in the bar region. Therefore Athanassoula & Misiriotis (2002) introduce the nomenclature “MH” for the halo-dominated and “MD” for the disc-dominated case. Further studies (Athanassoula et al. 2009; see also Gadotti et al. 2007) conclude that the angular momentum redistribution in galaxies with flat bars is more efficient than in those with exponential bars. This could be connected to the findings of Elmegreen & Elmegreen (1985) that exponential bars mainly occur in multiple-arm and flocculent galaxies, whereas flat bars primarily emerge in symmetric, 2-armed spirals. Indeed, Athanassoula & Misiriotis (2002) showed with the help of N-body simulations that weaker bars should have exponential profiles, while stronger ones have flatter profiles. Another result of this observation is that strong bars show the tendency to have strong arms as well (Elmegreen & Elmegreen, 1985; Ann & Lee, 1987; Elmegreen et al., 2007; Salo et al., 2010) although other studies have showed the opposite (e.g. Seigar & James, 1998; Seigar et al., 2003; Durbala et al., 2009), while Buta et al. (2009) find only a weak trend with a correlation coefficient of 0.3. One possible physical explanation of this correlation is that the spiral structure is driven by the bar at the same pattern speed, or is linked to the bar via energy and angular momentum exchange at dynamical resonances (Tagger et al., 1987).
A third important property of disc galaxies is their radial surface brightness profile. Typically disc galaxies have been described with a single exponential profile (Type I) by e.g. Freeman (1970). However, Freeman (1970) and van der Kruit (1979) also showed that some of the discs have a break in their radial surface brightness profile in the outer parts of the discs. Recent observations of face-on as well as edge-on galaxies (Pohlen et al., 2002; Erwin et al., 2005; Pohlen & Trujillo, 2006; Erwin et al., 2008; Gutiérrez et al., 2011; Maltby et al., 2012; Muñoz-Mateos et al., 2013; Comerón et al., 2012; Martín-Navarro et al., 2012) indicate that in many cases the slope of the radial surface brightness profile changes abruptly. Therefore it is better to model these galaxies with two different exponential profiles - one for the inner and another for the outer part of the disc. The radius at which the change of the slope occurs is usually called the break radius. If the disc inner scale length is larger than the outer scale length, the galaxy has a down-bending (Type II) profile. An up-bending (Type III) profile refers to a disc with steeper inner and shallower outer profile (e.g. Pohlen et al., 2002; Erwin et al., 2005; Elmegreen & Hunter, 2006; Pohlen & Trujillo, 2006).
Recent studies indicate that an essential fraction of all disc galaxies requires modelling with a double exponential profile. The exact fraction of galaxies in each of these types is, however, still highly debated. Pohlen & Trujillo (2006) investigated the light profiles of late-type galaxies in the optical band. They conclude that 60% of the galaxies have Type II and 30% Type III profiles. Only 10% showed a single exponential profile. A similar study of early type disc galaxies indicates that the fraction of Type I, II and III profiles is 27%, 42% and 24%, respectively (Erwin et al., 2008). It is remarkable that the remaining 7% of the galaxies exhibit a combination of Type II and Type III discs. Hunter & Elmegreen (2006) studied the disc profiles in very late-type galaxies. They find that 22% of the galaxies have a down-bending and 8% an up-bending profile. The remaining galaxies in their sample are well fitted with a single exponential profile.
The physical origin of these disc breaks is not fully understood. In the last decades several theories about the origin of disc breaks were developed. van der Kruit (1987) proposed that the down-bending break is a result of the formation process of the galaxy itself. In this scenario the break is located at the radius of the maximum angular momentum of the original spheroidal cloud. Another theory is related to the density of the gas in the disc. Once this gas density falls below a certain threshold, stars cannot form with the same efficiency anymore and thus a break should develop at this point in the galactic disc (Kennicutt, 1989). Nevertheless, other processes such as turbulent compressions of the gas could trigger star formation in the outer parts of the galaxies despite the low gas densities. Elmegreen & Hunter (2006) suggest that these different boundary conditions of star formation could introduce a double exponential disc profile in the galactic disc as well. Further suggestions of Elmegreen & Parravano (1994) and Schaye (2004) connect the disc break to the transition between the cool and warm phases of the interstellar medium. Finally, non-axisymmetric features such as bars could play a major role in the development of Type II disc breaks. A number of N-body simulations (e.g. Sellwood, 1980; Athanassoula, 2003; Debattista et al., 2006) indicate that bars can strongly redistribute the angular momentum in galaxies. Therefore bars also influence the distribution of material in the disc and could trigger the formation of a double exponential profile. Foyle et al. (2008) simulated the development of single exponential discs neglecting cosmological influences such as interactions and accretion. They found that these exponential discs easily develop a down-bending disc break. It is remarkable that the inner disc profiles strongly evolve whereas the outer disc profiles remain in a similar state. This is probably due to the difference between the dynamical time scale of the inner and outer disc. Thus the density profiles in the outer parts could provide clues about the properties of the original disc profile.
In this paper we make use of a large dataset obtained by the Spitzer Survey of Stellar Structure in Galaxies (S4G) to investigate how the properties of galaxies, and of their bars and bulges, relate to the properties of their spiral arms. Our selection of suitable subsamples of S4G are described in Sect. 2.
We use three different approaches: Firstly, we connect fundamental physical properties of the galaxies and their structural components with their classical morphological arm classification (Sect. 3). Secondly, in order to quantify the amplitude of the spiral arms and bar, the strength of the arm and bar is parametrized by measuring the arm-interarm as well as bar-interbar contrasts. As a result, we provide these measurements for a large subsample of S4G galaxies. Section 4 describes the measurement of these contrasts and connects them to some fundamental parameters of the galaxies. Thirdly (Sect. 5), we explore differences in the break of Type II discs according to the arm classes, as well as the measured arm and bar contrasts. Furthermore features in the contrast profiles are connected to the break radius. Finally our conclusions are presented in Sect. 6.
2 Sample Selection and Data
2.1 Sample selection


The parent sample of our study is the Spitzer Survey of Stellar Structure in Galaxies (S4G) (Sheth et al., 2010). It is a volume- (d < ), magnitude- () and size-limited ( > ) survey of 2352 galaxies. The galactic latitude is constrained to , and the distance determined from HI redshifts. Each galaxy is observed at and and mapped to . In azimuthally averaged surface brightness profiles a depth of is reached, which corresponds to a stellar mass surface density of .
The galaxies are processed uniformly through the five S4G pipelines. Pipeline 1 (P1) produces science ready images from the two observations of each galaxy (Regan, 2013). In pipeline 2 (P2), masks for fore- and background objects are created. Pipeline 3 (P3) measures the local sky level, the surface brightness profiles, ellipticities and position angles based on IRAF ellipse fits (Muñoz-Mateos et al., 2015). Pipeline 4 (P4) decomposes the two-dimensional stellar distributions into subcomponents using GALFIT version 3 (Salo et al., 2015). Finally, pipeline 5 (P5) produces maps of the stellar mass distribution within each galaxy (Querejeta et al., 2015).
In our study we (i) connect fundamental physical parameters with the spiral arm class (Sect. 3), (ii) measure the arm-interarm as well as bar-interbar contrast (Sect. 4) and (iii) investigate the nature of down-bending disc breaks (Sect. 5). Therefore it is necessary to define three different subsamples that are suitable for the corresponding investigations. The selection of these three subsamples is described below.
Section 3 compares galaxy properties to their spiral arm class as defined by Buta et al. (2015). Therefore we constrain the parent sample to the galaxies classified in that paper and we are left with a subsample of 1074 galaxies. Some plots in that section may contain a smaller number of objects. For example, when analysing bulge properties, bulgeless galaxies, as defined from the decompositions of Salo et al. (2015), are of course not included.
In Sect. 4 we present the measurement of the arm-interarm and bar-interbar contrasts. This measurement requires additional constraints to our parent sample. To avoid excessive measurement errors caused by projection effects, the sample is limited to galaxies with inclinations lower than . When the determination of the coordinates of the galaxy centres, as provided by pipeline 3, is uncertain, problems arise in the transformation of the images to polar coordinates. Therefore those galaxies are removed from the sample. Since the bar-interbar contrast is measured from the bulge effective radius up to the bar semi-major axis and the arm-interarm contrast from the bar semi-major axis up to the radius at which the background noise gets dominant, only galaxies that fulfill the condition are chosen. Furthermore, we visually inspect all remaining objects to check the images for contamination by e.g. foreground stars, stray light and companion galaxies, excluding such cases from the sample. Finally, we exclude galaxies that are overly disturbed, have a non-axisymmetric disc or peculiar spiral structure, since these galaxies are not suitable for the measurement of the arm-interarm contrast. Thus the final subsample consists of 288 galaxies.
For a discussion of Type II disc breaks in Sect. 5 we use both the data provided by two-dimensional multicomponent decompositions of Kim et al. (2014) and azimuthally averaged radial profiles by Muñoz-Mateos et al. (2013). Kim et al. (2014) chose barred galaxies with Hubble types from S0 to Sdm and excluded disturbed, faint and irregular galaxies. They also excluded images which are contaminated by foreground stars or stray light and constrained the inclination to . Their subsample contains 144 galaxies. Muñoz-Mateos et al. (2013) uses galaxies with Hubble T-types in the numerical range and explicitly excludes Sdm and Sm galaxies due to their patchy and asymmetric morphology. Furthermore they constrain the inclination to and the total stellar mass to . They end up with a subsample of 218 galaxies. In order to obtain a larger sample for our investigations of disc breaks, both of their subsamples are used together. Since a number of galaxies are common to both subsamples, we obtain a sample of 278 galaxies.
To check how our samples compare with the full S4G sample we plot the distributions of total stellar masses (see Fig. 1a) and mid-IR Hubble T-types from Buta et al. (2015) (see Fig. 1b). The subsamples intended for use in the discussion of spiral arm classes (Sect. 3) as well as the measurements of the contrast profiles (Sect. 4) show only a small shift towards higher masses, compared to the full S4G sample. Only the subsample that is used for the investigation of disc breaks (Sect. 5) differs significantly. It lacks low-mass galaxies below and shows a higher fraction of galaxies with masses around . Considering the distribution of the Hubble T-types, the arm class subsample is slightly shifted towards late-types whereas the disc break subsample has earlier Hubble-types. In particular, the latter has fewer Hubble-types later than . These findings are consistent with the sample selection criteria of Kim et al. (2014) and Muñoz-Mateos et al. (2013) and will be addressed below.
2.2 Data
In this subsection we describe the datasets used for our investigations. Regardless of which subsample is used below, the data are based on the same sources. In this study we connect fundamental physical parameters of the galaxies with their spiral arm class. The latter are taken from a classical morphological analysis by Buta et al. (2015). General properties of the galaxies in the samples are adapted from the two-dimensional multi-component decompositions conducted in pipeline 4 of the S4G survey (Salo et al., 2015). Some of these decompositions provide two exponential disc profiles for the galaxies. Since it is not clear whether they refer to a disc break or replace another subcomponent with different underlying physics, such galaxies are not used in this study. Furthermore, the decompositions can contain an unresolved point source in the centre of the galaxies. We point out that this component does not necessarily refer to a structural component with distinct underlying physics (e.g. active galactic nuclei). In the following we will refer to this unresolved point source as a nucleus and also consider the nucleus-to-total ratio in our results. The decompositions also provide measurements of the nucleus, bulge, bar and disc-to-total ratio. These ratios refer to the fraction of the flux of the corresponding component to the total flux of all galaxy components together. Due to different inclinations and position angles of the galaxies, it is necessary to deproject the bar semi-major axis. Treating the bar as a one dimensional line, the deprojected bar length is given by
| (1) |
with the observed bar length , inclination and position angle (Gadotti et al., 2007; Martin, 1995). Furthermore, S4G provides the isophotal radius at a surface brightness level of . In the following we will refer to this radius as . The bar Sérsic index is taken from Kim et al. (2014) whereas disc breaks as well as the inner and outer scale lengths come from both Kim et al. (2014) and Muñoz-Mateos et al. (2013). Whenever possible, distances are based on the mean redshift-independent distances from the NASA Extragalactic Database (NED). If these are not available, distances are calculated from the radial velocity corrected for Virgo-centric infall as provided by the LEDA database. The mass represents the total stellar mass of the galaxy including all of its components. It is based on the absolute magnitude of the galaxy and converted to mass using the calibration of Eskew et al. (2012). Details of this calibration are also discussed in Muñoz-Mateos et al. (2013).
2.3 Plots
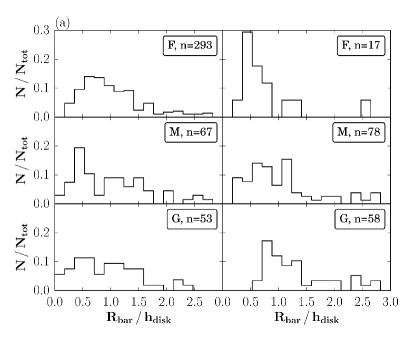
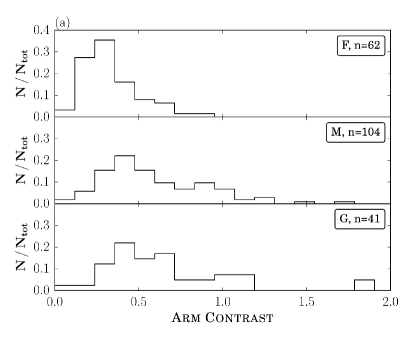
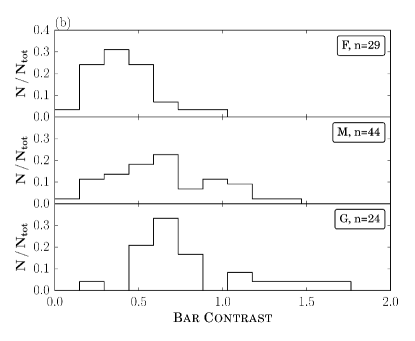
The plots in this paper are mostly designed in a uniform way. They are split in three normalized panels with the upper panel referring to flocculents (“F”), the central panel referring to multi-armed (“M”) and the lower panel referring to grand-design galaxies (“G”). This is also stated in the legends of the plots. In addition, the legend displays the total number of galaxies within each panel (“n”) and their portion of the total number of galaxies with this spiral arm class in Buta et al. (2015) (only in Sect. 3). The width of the bins corresponds to approximately 20% of the median of the particular distributions. Since a Student t-test is a widely accepted method to significantly distinguish distributions, we provide tables with the results of this statistical test for all presented plots (see Tables 1 to 4).
3 General galaxy properties
In the following, we compare some fundamental physical parameters between galaxies with different arm classes. These comparisons are shown in Figs. 2 to 7. In addition, the results of Student t-tests for all presented plots are provided in Table 1 and 2.
Since flocculent galaxies tend to be of lower mass and smaller size than multi-armed or grand-design galaxies, as discussed below, it is not straightforward to compare these spiral arm classes to each other (see Bosma, 1999). Thus, when we put forward differences between grand-design and flocculent galaxies, we are fully aware that these could be due to, or at least linked to, differences in the stellar masses of their host galaxies. To minimise this effect, this analysis was performed anew, dropping all galaxies beyond type Scd (type 6), since the later Hubble types (7 - 10) include mainly small galaxies, with a rotation velocity less than (see Bosma, 2016). Comparing the results obtained with and without this constraint, no significant differences are found. Thus we chose to conduct the following investigations for the full sample as presented in Sect. 2.
3.1 Results
| Name | Arm Cl. | T-statistic | P-value |
|---|---|---|---|
| Hubble types | F - M | ||
| (Fig. 2) | F - G | ||
| M - G | |||
| Stellar Mass | F - M | ||
| (Fig. 3a) | F - G | ||
| M - G | |||
| Surface density | F - M | ||
| (Fig. 3b) | F - G | ||
| M - G | |||
| Bulge eff. radius | F - M | ||
| (Fig. 4b) | F - G | ||
| M - G | |||
| Bulge Sérsic index | F - M | ||
| (Fig. 4c) | F - G | ||
| M - G | |||
| Bulge-to-total ratio | F - M | ||
| (Fig. 4d) | F - G | ||
| M - G | |||
| Nucleus-to-total ratio | F - M | ||
| (Fig. 5) | F - G | ||
| M - G | |||
| Bar axial ratio | F - M | ||
| (Fig. 6a) | F - G | ||
| M - G | |||
| Bar semi-major axis | F - M | ||
| (Fig. 6b) | F - G | ||
| M - G | |||
| Bar-to-total ratio | F - M | ||
| (Fig. 6c) | F - G | ||
| M - G | |||
| Bar Sérsic index | F - M | ||
| (Fig. 6d) | F - G | ||
| M - G |
| Name | Mass | Arm Cl. | T-statistic | P-value |
|---|---|---|---|---|
| F - M | ||||
| (Fig. 7a) | F - G | |||
| M - G | ||||
| F - M | ||||
| F - G | ||||
| M - G | ||||
| F - F | ||||
| M - M | ||||
| G - G | ||||
| F - M | ||||
| (Fig. 7b) | F - G | |||
| M - G | ||||
| F - M | ||||
| F - G | ||||
| M - G | ||||
| F - F | ||||
| M - M | ||||
| G - G |

The distributions of mid-IR Hubble T-types separated by arm class are displayed in Fig. 2. It clearly shows that grand-design galaxies tend to have earlier Hubble types, whereas most flocculents tend to have later Hubble types. Multi-armed galaxies are an intermediate case. However, a Student’s t-test indicates a significant difference between all three distributions.
The distributions of stellar mass and stellar mass surface density of the galaxies are presented in Fig. 3. In order to better illustrate the results, in these figures the width of the bins is not exactly 20% of the median of the distributions. The distributions of the total stellar mass show a high similarity between multi-armed and grand-design galaxies, whereas flocculent galaxies have significantly lower masses.
The galaxy stellar mass surface density is given by
| (2) |
with the total stellar mass of the galaxy and the disc exponential scale length . The distributions of the stellar mass surface density clearly show that flocculent galaxies have a lower galaxy surface density whereas multi-armed and grand-design galaxies are very similar. When using the isophotal radius instead of the disc exponential scale length for the calculation of the surface density, all distributions were shifted towards lower values while the differences between the spiral arm classes remained similar.


Moreover, the portion of models which require a bulge component as a function of the total stellar mass is presented in Fig. 4a. The fraction of bulge components in the decompositions increases with mass and, regarding multi-armed and grand-design galaxies, this fraction seems to reach 100% for high mass galaxies around . However, one should keep in mind that the number of galaxies with those high masses is very low in the chosen subsample. The fraction of flocculent galaxies that require a bulge component in the decompositions also increases with stellar mass but never reaches more than 60%. We point out that galaxies with stellar masses below are mostly bulgeless. In order to analyse the properties of the bulge in greater detail, the bulge effective radius is plotted in units of the isophotal radius separated by arm class (see Fig. 4b). The bulges of flocculent galaxies are larger relative to the size of the galaxy itself. The distributions for multi-armed and grand-design galaxies are similar and indicate that these galaxies have more compact bulge components. Furthermore, nearly all of the bulge Sérsic indices of flocculent galaxies are within a range from 0 to 2 (see Fig. 4c) whereas the Sérsic indices of multi-armed and grand-design galaxies are very similar to each other and extend to higher values. In addition, the bulge-to-total luminosity ratio increases from flocculent to grand-design galaxies (see Fig. 4d). Finally, the unresolved point source component in the decompositions (“nucleus”) is also considered. The fraction of decompositions that require this component in the models is approximately twice as high for multi-armed () and grand-design galaxies () than for flocculent galaxies (). In addition, the nucleus-to-total luminosity ratio of flocculents is, on average, lower than for the other spiral arm classes (see Fig. 5).


Figs. 6a and 6b show the bar axial ratio and bar semi-major axis in units of the isophotal radius . A Student t-test does not indicate a significant difference of the distributions. In addition, the bar-to-total luminosity ratio (see Fig. 6c) of grand-design galaxies is higher compared to multi-armed and flocculent galaxies which have similar distributions. The Sérsic index of the bar, as provided by Kim et al. (2014), is higher for flocculent galaxies (see Fig. 6d). Thus, the radial profile of their bars is more similar to an exponential profile even if their bar Sérsic index is not exactly unity. In contrast, multi-armed and grand-design galaxies have bar Sérsic indices around and therefore a flatter profile.
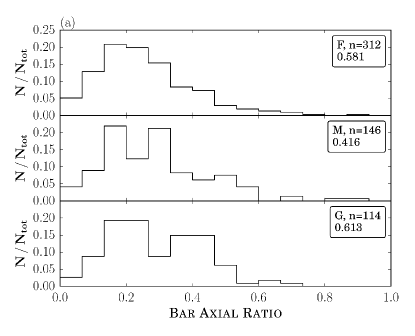
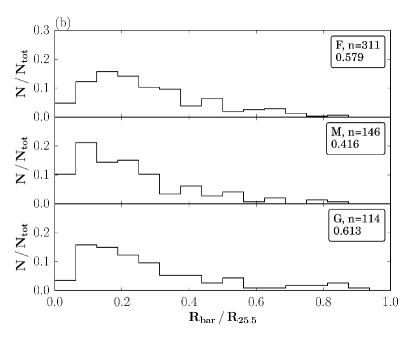
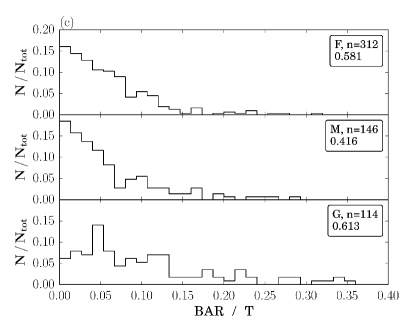

Fig. 7a shows the bar semi-major axis in units of the disc exponential scale length. In this plot we split the sample into two mass bins in order to investigate this parameter for a possible dependency on the total stellar mass. With the purpose of having a comparable number of galaxies in both bins, this separation in mass is made at . In the low mass range a Student’s t-test does not indicate a significant difference between the distributions. For galaxies with masses above , grand-design galaxies have, on average, longer bars as compared to flocculent galaxies. Moreover, a comparison of the distributions of the low and high mass range indicates that the distributions of flocculent and multi-armed galaxies are similar, whereas more massive grand-design galaxies have longer bars as compared to less massive grand-design galaxies. The same comparison is made for the bar semi-major axis in units of the isophotal radius and displayed in Fig. 7b. Considering the distributions in the low and high mass ranges respectively, our findings corroborate the previous results. Comparing the distributions of the low and high mass ranges, however, we now find a significant difference for flocculent but not for grand-design galaxies. In fact, more massive flocculents tend to have shorter bars as compared to less massive flocculents, when normalizing the bar radius by . However, the number of flocculents in the high mass range is small.

3.2 Discussion
3.2.1 General Remarks
Figure 3 presents the distributions of total stellar mass and stellar mass surface density of the galaxies. The stellar masses and surface densities of flocculent galaxies are nearly one order of magnitude lower than those of multi-armed and grand-design galaxies. In fact, this is not surprising since it is well-known that late-type galaxies have lower luminosities.
Figure 4 examines bulge properties of galaxies separated by arm class. Multi-armed and grand-design galaxies have higher bulge Sérsic indices (see Fig. 4c). In contrast, all bulge Sérsic indices of flocculent galaxies are lower than . It is widely accepted that most classical bulges (arguably built through violent processes such as mergers of individual galaxies, or of clumps in a protogalaxy) are best described by a Sérsic function with whereas disc-like bulges (i.e., those built through secularly evolving instabilities in the major disc), as well as boxy-peanut bulges/barlenses, tend to have (e.g. Fisher & Drory, 2008; Gadotti, 2009). Using a single criterion to distinguish between classical and disc-like bulges is prone to uncertainties. Firstly, there is no clear physical justification to use a Sérsic index of 2 to distinguish between classical and disc-like bulges. Secondly, the error in the determination of the Sérsic index is typically of the order of 0.5 which is large compared to a threshold value of 2 and the observed range from to . Thus, this criterion is prone to uncertainties but still widely accepted as a good first order approximation. It is difficult to access the impact of using a single criterion and this would require a full dedicated study (but see discussions in e.g. Gadotti, 2008, 2009; Fisher & Drory, 2016; Neumann et al., 2017). Interpreting our results in terms of the Sérsic index, all flocculents have disc-like bulges whereas multi-armed and grand-design galaxies have mainly classical bulges. However, only a small fraction ( 8%) of flocculents has a bulge at all whereas approximately 50% of multi-armed and grand-design galaxies are modelled with a bulge component in the decompositions. These clear distinctions in the bulge properties indicate different formation processes of the bulges and therewith evolutionary paths of the galaxies themselves.
Figure 4b shows that the bulges in flocculents are less compact than bulges in multi-armed or grand-design galaxies. Furthermore, the bulge-to-total luminosity ratio is investigated in Fig. 4d. This ratio increases from flocculent to grand-design galaxies. All these differences in the bulges of flocculent galaxies as compared to bulges in multi-armed and grand-design galaxies suggest that bulges in flocculent galaxies are predominantly disc-like bulges. Conversely, multi-armed and grand-design galaxies appear to have a higher fraction of classical bulges. The nucleus-to-total ratio also shows interesting characteristics. Flocculents have significantly lower nucleus-to-total ratios compared to the distributions of multi-armed and grand-design galaxies, which are similar. In addition, the fraction of decompositions that require a nuclear point source component is twice as high for multi-armed and grand-design galaxies as for flocculents. This is another indication that the formation scenario of the central regions of flocculent galaxies differ from those of galaxies with the other spiral arm classes.
In Fig. 4a we investigate the occurrence of bulges as function of the total stellar mass. The results indicate that bulges do not exist in galaxies with total stellar masses below for flocculents and for multi-armed and grand-design galaxies. The fraction of galaxies with bulges increases with mass for all arm classes. Flocculents reach a maximum bulge fraction of around whereas the fraction of galaxies with bulges in multi-armed and grand-design galaxies seems to converge towards 100% as the stellar mass increases.
The properties of bars separated by arm class are examined in Fig. 6, which shows the distributions of bar axial ratio, semi-major axis, bar-to-total ratio and Sérsic index. The three arm classes show similar distributions of bar axial ratio and semi-major axis, but less so of Sérsic index. Flocculents tend to show a bar Sérsic index that is close to unity, implying that the radial profile of their bars is (nearly) exponential. This is in contrast to the flat bars of multi-armed and grand-design galaxies. This result is in agreement with previous studies on the radial profiles of bars (e.g. Elmegreen & Elmegreen, 1985) and of simulated bars (Athanassoula & Misiriotis, 2002). However, it is remarkable that the fraction of galaxies that require a bar component in the decompositions is similar regardless of the spiral arm class.
Previous findings from Elmegreen & Elmegreen (1985) and Regan & Elmegreen (1997) indicate that early-type galaxies tend to have longer bars relative to the disc scale length. We check these results by plotting the bar semi-major axis in units of the disc exponential scale length (see Fig. 7a) and investigate this parameter for a possible dependency of the total stellar mass of the galaxy. Considering masses above , grand-design galaxies have significantly longer bars compared to flocculent galaxies. This result does not hold true for the low mass range. In Fig. 7b the bar semi-major axis is plotted in units of the isophotal radius , to explore a different normalization parameter for the bar size. This plot roughly supports our findings with the disc scale length as normalization parameter.
Thus, grand-design galaxies have significantly brighter (see Fig. 6c) and, in the high mass range, longer bars. Moreover, considering the bar length relative to the disc scale length, flocculent and multi-armed galaxies have similar bar sizes for both low and high stellar masses (see Fig. 7a). Theoretical results indicate that bars grow longer and stronger as galaxies evolve (see Athanassoula, 2013, for a review), which is consistent with the observational results in Kim et al. (2016). This could indicate that massive grand-design galaxies are older or evolved faster than their low-mass counterparts (see also Elmegreen et al., 2007). This effect could also be connected to differences in the gas content. Grand-design spirals are mainly early-types (see Fig. 2) and thus have on average less gas. Indeed, Athanassoula, Machado & Rodionov (2013) showed that an increased gas fraction leads to weaker and shorter bars and discussed this both in terms of the angular momentum exchange within the galaxy and of an increased central concentration. Note also that this is consistent with the more prominent appearance of bars in grand-design spirals (Elmegreen & Elmegreen, 1985; Elmegreen et al., 2011) and with the theoretical results that bars can drive spirals (e.g. Athanassoula, 1980). We emphasize that we can corroborate these studies only for galaxies with masses above .
Taking into account the bar length in units of the isophotal radius, different results are found. Firstly, the relative bar length of grand-design galaxies does not depend on their mass. Secondly, a Student’s t-test indicates that massive flocculents have shorter bars. Since this plot contains only 17 high mass but 295 low mass flocculents, the reliability of this result is questionable. However, the result may be significant, since the low-density discs of massive flocculent galaxies presumably cannot form a density wave or a strong bar.
Gadotti (2011) determines the normalized bar length of galaxies with masses above and based on SDSS data. He finds a median bar length of 1.5 disc scale lengths which is larger than disc scale lengths measured in this study. However, he states that his decompositions probably miss small bars with sizes around to due to the spatial resolution of the observations. This could explain the higher values of his measurement. In addition, he finds that no bar is longer than disc scale lengths and nearly all bars are shorter than (the isophotal radius at which the surface brightness in the r-band is ). Our results corroborate his findings.
3.2.2 The sequence of spiral arm classes
Previous studies on the different spiral arm classes indicate a clear difference between flocculent and grand-design galaxies. This distinction arises not only in the visible structure of the galaxies, but also, as the results above suggest, in the physical processes that drive their formation. Since multi-armed galaxies show regions with both regular and irregular morphologies, they are believed to be an intermediate case (Elmegreen & Elmegreen, 1984, 1995). In the following we discuss the position of multi-armed galaxies as an intermediate case between flocculent and grand-design galaxies.
Figure 2 shows clearly that flocculents, multi-armed and grand-design galaxies form a sequence from late to early-type galaxies. However, there are also several similarities between multi-armed and grand-design galaxies. For multi-armed and grand-design galaxies, the distribution of the total stellar mass as well as the stellar mass surface density is similar (see Figs. 3). For flocculents, however, the medians in the distribution of these properties are nearly one order of magnitude smaller. Considering the Sérsic indices of bulge and bar (see Fig. 6d), striking similarities between multi-armed and grand-design galaxies are obvious. Our results suggest that all flocculent galaxies have disc-like bulges and exponential bars whereas multi-armed and grand-design galaxies have mostly classical bulges and bars with flat luminosity profiles. Bars with flat profiles could be an indication that these bars are dynamically evolved (see e.g. Kim et al., 2015). Moreover, Fig. 4d indicates that multi-armed galaxies have a significantly lower bulge-to-total ratio as compared to grand-design galaxies. This exhibits one striking difference between the two spiral arm classes and is discussed below.
3.2.3 The connection between dense bulges and spiral waves
In Fig. 4 we investigated the effect of bulge properties separately for the three arm classes and found indications that galaxies with grand-design spirals tend to have classical bulges more often than flocculent spirals. A first explanation, put forward by some of the authors of this paper, is based on the theory of spiral wave modes. The spiral arms in galaxies with high symmetry may be caused by spiral density waves as initially suggested by Lindblad (1959) and advanced by Lin & Shu (1964). However, Toomre (1969) showed that these spiral waves have an inward group velocity so that they would wrap up. As solution to this problem, Lin (1970) and Mark (1976b) suggest that incoming waves are reflected off the central regions of the galaxies. This requires a region in the centre with a high Toomre Q parameter, as provided by a classical bulge, and produces a weak leading wave moving outwards. Thereupon this leading wave is amplified at corotation similar to the swing amplification theory proposed by Toomre (1981). Thus, a strong trailing wave is produced with inwards as well as outwards moving components. This feedback loop results in a growing standing spiral wave mode (see Mark, 1976a, c, 1977; Bertin, 1983; Lin & Bertin, 1985; Bertin et al., 1989a, b). We emphasize that a necessary condition for this process is the existence of a high-Q region in the centre which reflects the incoming wave before it reaches the Inner Lindblad Resonance (ILR) and is absorbed.
This theory is also consistent with recent work of Saha & Elmegreen (2016) who simulated galaxies in a sequence of increasing bulge masses. For intermediate bulge masses they find optimal conditions for a shielding of the ILR by the bulge. Using this configuration, a strong and persistent two-armed wave mode arises.
As we showed in Fig. 4, flocculent galaxies tend to have either weak or no bulges, extended bulges with low densities, or bulges with an exponential, disc-like profile, which are therefore not likely high-Q. Therefore the inner regions of flocculent galaxies are not expected to be able to reflect an incoming spiral wave and prevent it from being absorbed at the ILR. In contrast, most of the grand-design galaxies have dense bulges, many with a high bulge-to-total ratio so that these bulges are more suitable to reflect the incoming wave. In Sect. 3.2.2 the many similarities of fundamental parameters between multi-armed and grand-design galaxies are discussed. Considering the significantly lower bulge-to-total ratio of multi-armed galaxies, their bulges probably provide less shielding of the ILR so that we would expect, according to the theory reviewed above, a lower degree of symmetry in their spiral structure. Therefore it could be possible to reconcile the many similar fundamental parameters of multi-armed and grand-design galaxies with their difference in Hubble type.
Thus, our results are consistent with the theory presented above as well as with the simulations conducted by Saha & Elmegreen (2016). Using measurements of the pattern speed of the spiral structure, one could estimate the radius of the ILR and show if the bulges are indeed large enough to prevent the incoming wave from reaching the ILR. However, these measurements are beyond the scope of this paper.
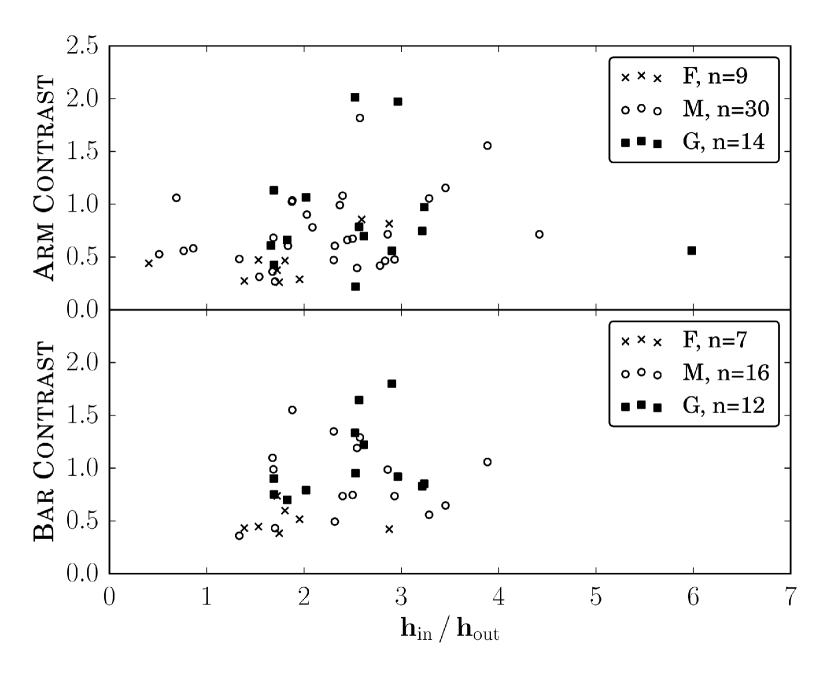
We point out that there are a number of caveats concerning the presented connection between bulges and persistent spiral wave modes. Firstly, 25/41 of the unbarred grand-design galaxies in our sample actually have bulges with a Sérsic index less than 2, and are thus presumably not classical bulges. This means that the theory above does not apply for the majority of the unbarred grand-design galaxies in our sample. Therefore, a reflection of the density wave off the bulge seems only possible for 16 of the 41 unbarred grand-design galaxies in our sample. To present a theory that may account for the majority of the grand-design spiral arms is beyond the scope of this paper. Secondly, if a reflection of the density wave on the classical bulge were indeed the explanation, one could reasonably expect to find a correlation between the bulge-to-total ratio and the arm-interarm contrast (see Sect. 4) for galaxies with grand-design spirals, and particularly for unbarred galaxies, in order for the reflection to be possible and efficient. We do find a trend in this direction in Fig. 8 for bulge-to-total ratios lower than , but then higher bulge-to-total ratios have a scatter in their spiral arm contrasts. More measurements are clearly necessary to verify these results. We speculate that perhaps galaxies with the highest bulge-to-total ratios, which are early-type galaxies, also have hotter discs and less gas so they cannot amplify the reflected spirals very well. This could account for the drop in the arm-interarm contrast at high bulge-to-total ratios. Furthermore, as will be discussed in Sect. 4.3, no correlation between arm-interarm contrast and either the bulge Sérsic index or its effective radius is found.

Thus a second, very straightforward explanation is proposed by another subgroup of the authors of this paper. As we showed in Figs. 2 and 3a, galaxies with grand-design spirals are in general more massive and of earlier types than the flocculent galaxies. It is, however, well known that early type massive spirals have generally strong classical bulges (e.g. Gadotti, 2009; Salo et al., 2015, and references therein). Thus grand-design spirals should be found more often in galaxies with strong classical bulges, than in galaxies with no such bulges, as we indeed showed in Fig. 4. In this very straightforward explanation the link between the classical bulge and the arm class is not a link of cause to effect. It is simply due to the fact that both are found preferably in massive early type disc galaxies, i.e. they are due to the mass of the parent galaxy and independent of the theory that explains the spiral structure. Indeed, the mass of a galaxy is often understood to be a crucial parameter, determining many of the galaxy properties.
4 Spiral arm and bar contrast measurements
In the following we quantify the visual classification of galaxies in the spiral arm classes. The strength of spiral arms can be parametrized by the arm-interarm contrast or by the relative Fourier intensity amplitudes, which give comparable results (Elmegreen et al., 2011). However, in this study we focus on measurements of the arm-interarm contrast. Therefore the intensity in the spiral arms as well as in the interarm regions is measured and the ratio of these two values computed. The same procedure is applied to measure the bar-interbar contrast.
A detailed description of this measurement is provided below. The automated procedure is applied to a suitable subsample of S4G as described in Sect. 2. Eventually, our pipeline produces images of all galaxies in polar coordinates. In those images the positions of the spiral arms and the measurement parameters are highlighted. Furthermore, we provide contrast profiles as a function of the radius as well as measurements of the bar and arm contrast. These data products and all input and output parameters of the measurement are publicly available.
4.1 Performing the contrast measurements
In this study, we make use of the images provided by pipeline 4 (P4) (Salo et al., 2015) of S4G. The images have a pixel scale of and a PSF FWHM of . The flux in this wavelength arises mainly from old stars and thus highlights the old stellar component of spiral galaxies. Nevertheless, 10 - 30% of the flux at still has its origin in dust emissions (Querejeta et al., 2015). Therefore we also examine the stellar mass maps provided by pipeline 5 (P5) (Querejeta et al., 2015) in which the light of the dust emissions is removed. A comparison of our measurements using both the P4 and P5 data indicates that the P4 data produces approximately 10% higher contrasts. This effect might be connected to emission from warm dust. No other systematic differences between the two datasets were found. Since the P4-sample is substantially larger, we chose to conduct the measurements on this dataset.
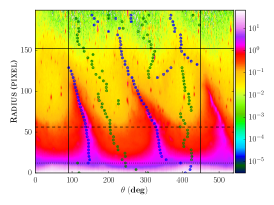
In the first step the images are converted into polar coordinates using an IRAF script of F.R. Chromey (1991). The x-axis of the resulting images shows the azimuthal angle with one pixel referring to one degree whereas the y-axis displays the radius in linear steps and keeps the pixel scale of . The contrast is measured in dependency of the radius. We use radial steps of 4 pixels corresponding to approximately twice the FWHM of the point spread function. For every radial step we obtain the intensity as a function of the azimuthal angle. In order to reliably detect the spiral arms, it is necessary to exclude any outliers in the intensity curve, e.g. globular clusters or areas with dust emission. To do so, we use two different methods. The first method (V1) replaces outliers in the intensity curve with the local median whereas the second method (V2) calculates the median in rectangles with a width of 10 azimuthal degrees and a height of 4 pixels. Here the width of 10 azimuthal degrees is chosen because no major structural changes are expected within the galaxy in this order of magnitude. A comparison of both versions indicates that method V2 produces approximately 10% higher values of the final contrasts. Apart from this, no systematic differences between the two methods are found. Due to the better physical justification of method V2, the measurements are conducted with this method.
The resulting intensity profile as a function of the azimuthal angle is smoothed using a Savitzky-Golay filter and used to determine the local extrema numerically. Local maxima indicate spiral arms whereas local minima indicate inter-arm regions. For the calculation of the arm-interarm contrast we compute the average of all detected maxima and minima, respectively. The resulting contrast is converted to a magnitude with the equation
| (3) |
as used by Elmegreen et al. (2011).
Based on the data of Salo et al. (2015) we distinguish between the bar and arm contrast. Here the bar-interbar contrast is measured from the bulge effective radius up to the bar semi-major axis and the arm-interarm contrast from the bar radius up to the maximum radius .
It is essential for the quality of the measurement to exclude the background, since a measurement of the background does not contain any physical information. The background levels were measured in pipeline 3 of S4G. Two adjacent annuli were used which surround the galaxy and are split in 45 boxes with 1000 unmasked pixels each. The median sky level and the local pixel-to-pixel noise was measured in each box (Muñoz-Mateos et al., 2015). Moreover, the small pixel values of the background region would cause unreasonably high values of the contrast if a measurement of background against background or galaxy against background would be done. In order to derive a reasonable maximum radius for our arm contrast measurements we use two different approaches. Firstly, the maximum radius is chosen to be a multiple of the disc exponential scale length. Since this method often includes a too large background region, a strong bias of highly inclined galaxies producing high arm contrasts is introduced. In the second method the measurement is stopped at the radius at which 10% of the pixel values are below 3 times the local pixel-to-pixel noise. We overplot all galaxy images with the corresponding maximum radius and check them visually. In the majority of the cases this estimate matches the size of the galaxy well. Nevertheless, for 11 galaxies it is necessary to increase the maximum radius to 2 times the local noise in order to improve the conformity between maximum radius and galaxy size. This method of the determination of the maximum radius has the advantage that it is related to the size of the galaxy itself, its inclination as well as the quality of the data. Only a very weak bias towards high inclination galaxies producing high arm-interarm contrasts is detected. Furthermore the contrast profile is expected to be smooth within the galaxy. Therefore the mean and median of the contrast are expected to be similar. The second method is in consistency with these prospects. Therefore we conclude that it is more reasonable to use the latter method for the determination of the maximum radius. Brighter bars are also expected to produce higher bar-interbar contrasts. In order to check the reliability of the measurement, the bar contrast is plotted as a function of the bar-to-total luminosity ratio. The plot (not shown here) indicates a clear correlation between both quantities and confirms thereby the functionality of the code. The Spearman Rank correlation coefficients are , and for the flocculent, multi-armed and grand-design galaxies, respectively.
Figure 9 shows an image of the galaxy NGC 986 and helps to illustrate how the contrast measurement is done. In addition, it shows the resulting contrast as a function of the radius. In the image, the vertical lines define a range of for the azimuthal angle from an arbitrary starting point. The dotted and dashed horizontal lines refer to the effective radius of the bulge and the bar semi-major axis , respectively. The solid horizontal line displays the maximum radius of the measurement. Blue and green points mark the positions of the maxima and minima, respectively, and therewith the positions of the spiral arms as well as the interarm regions.


4.2 Comparison with previous measurements
Our results are compared to previous measurements of the arm-interarm contrast. As a reference we use the measurements of Elmegreen et al. (2011) who investigated spiral arm properties of 46 galaxies based on the images of S4G. The two datasets have 18 galaxies in common. The comparison of these two studies is displayed in Fig. 10.

The black line represents a one-to-one correspondence whereas the grey lines refer to a deviation of 25%. Since the measurements strongly depend on the chosen set of maximum and minimum radius, we recalculate for this plot the arm-interarm contrast using the radii from Elmegreen et al. (2011), to be specific one bulge effective radius and as minimum and maximum radius, respectively.
The plot shows typical deviations of between the two studies. This discrepancy can easily be explained by the different measurement methods. Firstly, Elmegreen et al. (2011) measures the contrast in 1 pixel wide cuts in radial steps of . In contrast, this study uses radial steps of four pixels and computes the median of this four-pixel-wide cut. Secondly, Elmegreen et al. (2011) determined the maximum and minimum radii individually by hand whereas we connect the maximum radius to the background noise and the minimum radius to one bulge effective radius (for unbarred galaxies) or the bar semi-major axis (for barred galaxies), as determined by Salo et al. (2015). Since both studies conclude that the measurement strongly depends on the chosen radii, this produces differences in the measurements. In addition, the contrast profiles are compared to those of Elmegreen et al. (2011). For the majority of the galaxies these contrast profiles are similar in shape and the same features can easily be detected in the profiles of both studies. The main difference is that the arm-interarm contrasts, as measured by Elmegreen et al. (2011), have on average higher values. This shift can be explained by some differences in the measurement methods. Since Elmegreen et al. (2011) did all measurements by hand, they also detected and avoided foreground stars manually. In contrast, we compute the median in bins of 4 pixels in radius and 10 azimuthal degrees in order to exclude any outliers in the intensity curve. Furthermore, for every radial step a Savitzky-Golay filter is applied to improve the detection of spiral arms and interarm regions. This may slightly wash out any maxima and minima in the intensity profile and therefore lead to systematically lower values of the contrast. Considering the reasonable scatter in the plot, the different sets of maximum and minimum radii as well as the similarities of the contrast profiles, we conclude that our measurements are in agreement with the results of Elmegreen et al. (2011).
4.3 Results
| Name | Bar | Arm Cl. | T-statistic | P-value |
|---|---|---|---|---|
| Arm Cont. | F - M | |||
| (Fig. 11a) | F - G | |||
| M - G | ||||
| Bar Cont. | F - M | |||
| (Fig. 11b) | F - G | |||
| M - G | ||||
| Arm Cont. | SB | F - M | ||
| (Fig. 13) | F - G | |||
| M - G | ||||
| SA | F - M | |||
| F - G | ||||
| M - G | ||||
| SB | F - F | |||
| M - M | ||||
| SA | G - G |
The distributions of the arm and bar contrast separated by arm class are shown in Fig. 11. A Student’s t-test indicates for both the arm and bar contrast that flocculents have significantly lower contrasts whereas the distributions of multi-armed and grand-design galaxies are similar. Interestingly, the increase of the contrast from flocculent to grand-design galaxies is more striking for the bar-interbar contrast.
In Fig. 12a we examine the bar contrast as a function of the arm contrast. Galaxies with high bar contrasts tend to have high arm contrasts as well, but the correlation is quite weak with Spearman Rank correlation coefficients of , and for flocculent, multi-armed and grand-design galaxies, respectively.
In Fig. 12b the bar contrast as a function of the bulge-to-total luminosity ratio is presented. Galaxies with a high bulge-to-total ratio tend to have higher bar contrasts with Spearman Rank correlation coefficients for multi-armed and grand-design galaxies of and , respectively. Since this plot includes only one flocculent galaxy, a correlation coefficient for this spiral arm class cannot be calculated. This figure contains a substantially lower number of galaxies because multiple additional constraints apply to this plot (in contrast to e.g. Figs. 11, 12a and 13). In order to plot the bar contrast as a function of the bulge-to-total ratio, the plot is limited to galaxies which have contrast measurements and require a bulge as well as a bar component in the decompositions. In line with the correlations between the bar contrast and the bulge-to-total and bar-to-total ratios, an inverse correlation between the bar contrast and the disc-to-total luminosity ratio is found (not shown here).


We also compared arm and bar contrast to other fundamental galaxy properties. These included the bulge Sérsic index, bulge effective radius, the bar semi-major axis and axial ratio, the bar-to-total ratio, the disc-to-total ratio, the stellar mass surface density and nucleus-to-total ratio. For none of them a clear connection to the arm or bar contrast is found.
In Fig. 13 we investigate the distribution of the arm-interarm contrast for both barred (left panels) and unbarred galaxies (right panels). Flocculent galaxies have significantly lower arm contrasts for both barred and unbarred galaxies whereas the distributions of multi-armed and grand-design galaxies are similar. In addition, no significant differences between the distributions of barred and unbarred galaxies are found.

4.4 Discussion
The results of the arm and bar contrast measurements are presented in Fig. 11 which indicates that both the arm and bar contrasts of flocculent galaxies are lower compared to multi-armed and grand-design galaxies. This is in good agreement with the visual appearance of the different spiral arm classes. Nevertheless, we expected to find a more significant difference between the contrasts of multi-armed and grand-design galaxies, based on their visual appearance. In Sect. 3.2.3 we discussed that the spiral arms of grand-design galaxies possibly arise through a standing spiral wave mode. However, the corresponding theory does not make predictions about the amplitude of the spiral pattern, which implies that the arm-interarm contrast of grand-design galaxies does not necessarily need to be higher as compared to multi-armed galaxies. Instead, since the mode of the spiral wave is in this theoretical framework amplified most strongly in grand-design galaxies, grand-design galaxies are expected to show a higher degree of symmetry than multi-armed galaxies. This is in good agreement with our findings and the visual appearance of the different spiral arm classes. Nevertheless, we remind the reader of the caveats discussed in the second half of Sect. 3.2.3 with respect to this interpretation and of the existence of an alternative, simpler explanation.
The lack of a strong arm contrast difference between grand-design and multi-armed galaxies could be related to the differences in the techniques used to classify galaxies into the spiral arm classes. The visual impression of a galaxy is certainly connected to multiple factors beyond the amplitude of the spiral arms and the interarm regions. These aspects could include e.g. the length of the spiral arms and their symmetry. However, these factors are not considered in our measurement. Therewith they could generate differences between the visual classification of the galaxy and our quantitative measurements.
Furthermore, the plots indicate that the increase of the bar-interbar contrast from flocculent to grand-design galaxies is more striking compared to the increase of the arm-interarm contrast. This finding could indicate that bars are more important for the secular evolution of the galaxy and the development of spiral structure than the spiral arms themselves. Consistent with this idea is the fact that the bar contrasts are approximately 0.11 higher than the arm contrasts. This explains why linear theories can properly describe spiral arms but not bars. In order to analyse the relation of bars and spiral arms in more detail, Fig. 12a shows the bar contrast as a function of the arm contrast. Multi-armed and grand-design galaxies with high bar contrasts tend to have high arm contrasts as well. This result is consistent with previous findings of e.g. Elmegreen & Elmegreen (1985); Ann & Lee (1987); Elmegreen et al. (2007); Buta et al. (2009); Salo et al. (2010). However, this does not hold true for flocculent galaxies, as indicated by a correlation coefficient of , and indicates that their spiral structure is generated by local gravitational instabilities instead of being driven by a bar or a companion.
In connection to this result, the distributions of the arm contrast for barred and unbarred galaxies are analysed separately (see Fig. 13). Significant differences of the arm contrast are not obvious, regardless of the existence of a bar. This result points out that spiral arms, whether or not they arise from standing spiral wave modes, local gravitational instabilities or are triggered by tidal interactions or bars, have the capacity to reach similar arm-interarm contrasts. However, an existing bar supports spiral arms in the sense that stronger bars trigger spiral arms with higher amplitudes. This might also be true if the pattern speed of the spiral arms is lower than that of the bar itself, even if bar and spiral arms break and reconnect continuously (see Tagger et al., 1987; Sellwood & Sparke, 1988).
Furthermore, Fig. 12b indicates a clear correlation between the bulge-to-total luminosity ratio and the bar contrast for multi-armed and grand-design galaxies. It is remarkable that no other correlations of fundamental galaxy parameters with the bar contrast are obvious. This could indicate a strong connection between classical bulges and large bars in early-type disc galaxies. In Sect. 3.2 we found that the bulges of multi-armed and grand-design galaxies are mostly classical bulges. Within this framework the classical bulge forms through a merger of individual galaxies or of clumps in a protogalaxy. After the formation of a disc and a bar, the bulge supports the growth of the bar through the transfer of angular momentum from the bar to the bulge, as discussed by Athanassoula & Misiriotis (2002) and Athanassoula (2003). Thus, the existence of a classical bulge supports the growth of a strong bar.
5 disc breaks
An important property of disc galaxies is their radial surface brightness profile. Different observations suggest that the majority of all disc galaxies have double exponential profiles. In this section, we explore the properties of these disc breaks in galaxies with different arm classes. In addition, we connect disc breaks to the contrast measurement of Sect. 4. For this analysis only barred galaxies are considered, as the number of unbarred galaxies in the sample used here is small (see Sect. 2).
5.1 Results
| Name | Arm Class | T-statistic | P-value |
|---|---|---|---|
| F - M | |||
| (Fig. 14) | F - G | ||
| M - G | |||
| F - M | |||
| (Fig. 15a) | F - G | ||
| M - G | |||
| F - M | |||
| (Fig. 15b) | F - G | ||
| M - G |
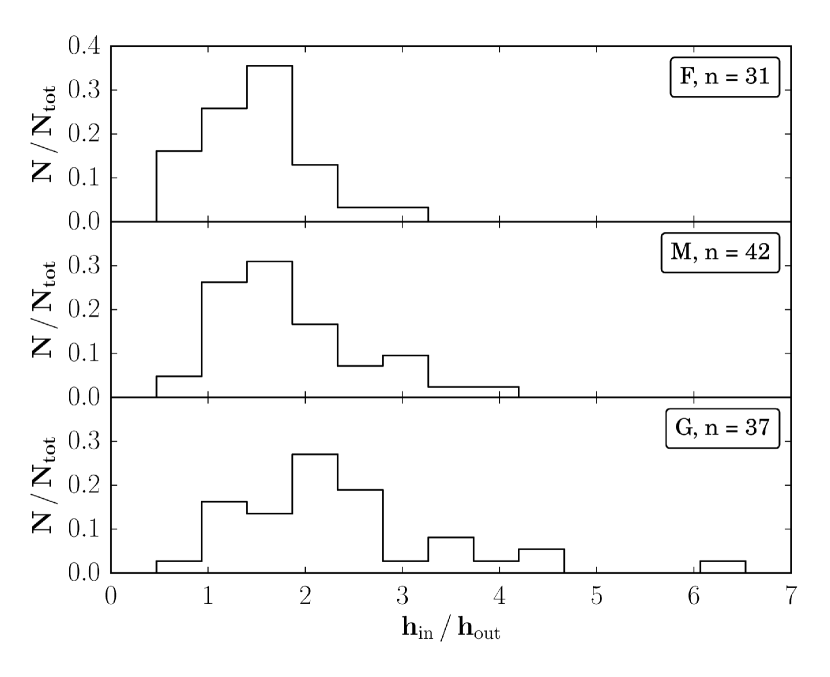
In the first step, the distributions of the disc inner and outer scale length for the three different arm classes are investigated (not shown here). The disc inner scale length increases from flocculent to grand-design galaxies. Considering the disc outer scale length, multi-armed and grand-design galaxies have similar distributions whereas flocculent galaxies have lower disc outer scale lengths. In addition, the ratio of disc inner to outer scale length is used as an indicator for the strength of the break and this break strength is, on average, higher for grand-design galaxies than for flocculents. Multi-armed galaxies are an intermediate case (see Fig. 14). Figures 15a and 15b present the break radius normalized by the disc inner and outer scale length. There are no differences of the distributions of the spiral arm classes regardless of the used normalization parameter.

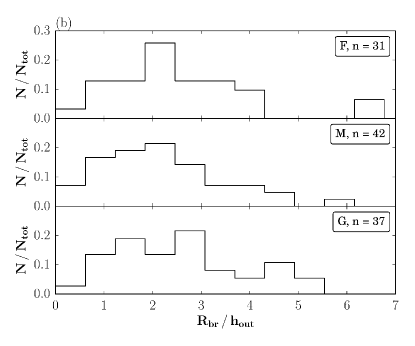
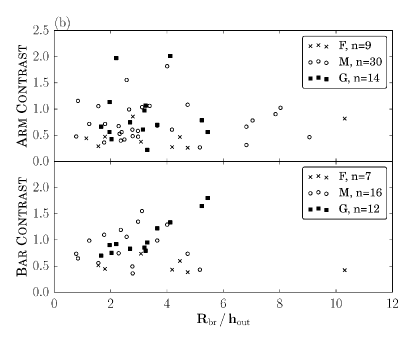
In the following we make use of our contrast measurements of Sect. 4 and plot the arm and bar contrast as a function of the break strength (see Fig. 16). There are no correlations between the arm contrast and the break strength. However, grand-design galaxies with a strong break have a weak tendency to have higher bar-interbar contrasts. The correlation coefficients for the spiral arm classes are , and . Furthermore, the scatter is large and this result must be confirmed with a larger sample. In addition, Fig. 17 shows arm and bar contrast as a function of the break radius normalized by the disc inner and outer scale length. Since the following results are based on a small number of galaxies, their statistical significance is weak. Figure 17 does not indicate any correlation between break radius and arm contrast. However, for both normalization parameters a correlation of the break radius with the bar contrast is detected. Grand-design galaxies with high bar contrasts have break radii that are larger relative to the disc. The Spearman Rank correlation coefficients are and for the break radius normalized by the disc inner and outer scale length, respectively. It is remarkable that flocculent galaxies show an inverse correlation with correlation coefficients of and . In fact, flocculents seem to have similar bar contrasts for their full range of break radii in the plot. Thus, the comparably high correlation coefficients may be caused by the small number of galaxies. Multi-armed galaxies do not show any correlation between these two parameters.

5.2 Discussion
As discussed in Sect. 3 and 4, grand-design galaxies have, on average, stronger bars. Furthermore, the bars of multi-armed and grand-design galaxies have a flat radial profile (see Fig. 6d). By comparing their observations with the simulation results of Athanassoula & Misiriotis (2002), and particularly those of Athanassoula (2003), the previous studies by Gadotti et al. (2007) and Athanassoula et al. (2009) were able to indicate that the angular momentum redistribution of flat bars is more efficient than of exponential bars. Therefore we expect the angular momentum redistribution in grand-design galaxies to be stronger. As a result of this, the inner discs should develop faster and lead to flatter profiles. This is consistent with the increase of the disc inner scale length from flocculent to grand-design galaxies as well as with the idea that bars drive disc breaks (see Muñoz-Mateos et al., 2013, and references therein). Another result of this mechanism is that grand-design galaxies have a stronger disc break, as indicated by the ratio of disc inner to outer scale length (see Fig. 14). Multi-armed galaxies seem to be an intermediate case consistent with their bar properties (see Fig. 6), as compared to the other spiral arm classes.
Possible correlations between the disc break and the bar as well as arm contrast are investigated as well (see Fig. 16 and 17). Clear connections between the break radius and the bar contrast are found. However, this does not hold true for the arm contrast. Thus, the spiral structure of galaxies does not seem to influence the development or evolution of disc breaks in barred galaxies. At the same time this points out the importance of bars for disc breaks. The correlations between bar contrast and break radius depend strongly on the spiral arm class of the galaxy. Considering grand-design galaxies, our plots indicate a positive correlation between the bar contrast and the break radius normalized by the disc inner as well as outer scale length. Grand-design galaxies have flat bars which are known to efficiently redistribute the angular momentum of a galaxy (Gadotti et al., 2007; Athanassoula et al., 2009). As a result, the bar strongly influences the distribution of matter in the inner disc and the break radius itself. Since previous studies (see Kim et al. (2016) for the observations and Athanassoula et al. (2013) for a review of the theoretical work) indicate that the bar grows longer and stronger with time, the break radius is expected to evolve with time. Thus, high break radii occur in galaxies with long and strong bars, which is in good agreement with our results. In contrast, the Spearman Rank correlation coefficients of flocculent galaxies indicate an inverse correlation between break radius and bar contrast. However, the plot seems to show similar values of the bar contrast for the full span of break radii. This indicates that disc breaks of flocculent galaxies are not connected to the properties of the bar. Hence, disc breaks of flocculents may be generated by other mechanisms than in grand-design galaxies.
6 Summary and Conclusions
We investigated how fundamental galaxy properties, including the properties of bars and disc breaks, are related to the properties of spiral arms. Using images from the Spitzer Survey of Stellar Structure in Galaxies (S4G), we performed measurements of arm-interarm and bar-interbar contrasts and also considered previously published measurements of fundamental galaxy parameters, including visual classification into the three different arm classes (flocculent, multi-armed and grand-design). The main results from this study can be summarised as follows:
-
1.
Our measurements of the arm-interarm contrast compare well with the results of a previous study, with typical differences of approximately 25%. We discuss differences in the measurement methods and point out striking similarities in the resulting radial contrast profiles. Thus we conclude that the measurements of both studies are in reasonable agreement (see Sect. 4.2).
-
2.
The arm contrasts of flocculent galaxies are significantly lower as compared to the other spiral arm classes. However, the arm contrasts of multi-armed and grand-design galaxies are more similar than expected from a visual classification. Interestingly, the bar contrast, and its increase from flocculent to grand-design galaxies, is systematically more significant as compared to the arm contrast (see Fig. 11).
-
3.
Flocculent galaxies are clearly distinguished from the other spiral arm classes, in particular by their lower total stellar masses and surface densities. In contrast, multi-armed and grand-design galaxies share many fundamental parameters, excluding some bar properties and the bulge-to-total luminosity ratio. In particular, almost all flocculent galaxies either have no bulge or have extended, less massive (possibly disc-like) bulges whereas grand-design and multi-armed galaxies tend to have more classical-type bulges with slightly more massive bulges in the grand-design spirals (see Sect. 3).
-
4.
Considering multi-armed and grand-design galaxies, a strong correlation between the bulge-to-total ratio and the bar contrast is found and we conclude that the existence of a classical bulge could enhance bar evolution. In addition, a weaker correlation between arm and bar contrast is found which corroborates the findings of previous studies (see Fig. 12).
-
5.
Similar arm-interarm contrasts are detected in both barred and unbarred galaxies (see Fig. 13). This indicates that spiral arms have the capacity to reach similar arm contrasts regardless of which mechanism triggers the spiral structure. However, the highest arm contrasts are found exclusively in barred galaxies.
-
6.
We show that the bar contrast of grand-design galaxies correlates with the disc break radius, reinforcing previous conclusions on the connection between bars and disc breaks. However, such correlation is absent for the arm contrast or the other spiral arm classes (see Sect. 5.2).
Our measurements of the arm and bar contrasts as well as the corresponding radial contrast profiles are available to the community at http://homepages.physik.uni-muenchen.de/~a.bittner/projects/arm_contrasts/overview.html.
Acknowledgements
We thank an anonymous referee for very helpful suggestions. EA and AB thank the CNES (Centre National d’Etudes Spatiales, France) for financial support. This work is based on observations made with the Spitzer Space Telescope and made use of the NASA/IPAC Extragalactic Database (NED), which are operated by the Jet Propulsion Laboratory, California Institute of Technology, under a contract with the National Aeronautics and Space Administration (NASA). We also acknowledge the usage of the HyperLeda database (http://leda.univ-lyon1.fr). This research has made use of NASA’s Astrophysics Data System Bibliographic Services.
References
- Ann & Lee (1987) Ann H. B., Lee S.-W., 1987, Journal of Korean Astronomical Society, 20, 49
- Athanassoula (1980) Athanassoula E., 1980, A&A, 88, 184
- Athanassoula (1984) Athanassoula E., 1984, Phys. Rep., 114, 319
- Athanassoula (2003) Athanassoula E., 2003, MNRAS, 341, 1179
- Athanassoula (2012) Athanassoula E., 2012, MNRAS, 426, L46
- Athanassoula (2013) Athanassoula E., 2013, in Secular Evolution of Galaxies, by Jesús Falcón-Barroso, and Johan H. Knapen, Cambridge, UK: Cambridge University Press. pp 305–351
- Athanassoula & Misiriotis (2002) Athanassoula E., Misiriotis A., 2002, MNRAS, 330, 35
- Athanassoula et al. (2009) Athanassoula E., Gadotti D. A., Carrasco L., Bosma A., de Souza R. E., Recillas E., 2009, in Revista Mexicana de Astronomia y Astrofisica Conference Series. pp 79–82
- Athanassoula et al. (2013) Athanassoula E., Machado R. E. G., Rodionov S. A., 2013, MNRAS, 429, 1949
- Bertin (1983) Bertin G., 1983, in Athanassoula E., ed., IAU Symposium Vol. 100, Internal Kinematics and Dynamics of Galaxies. p. 119
- Bertin et al. (1989a) Bertin G., Lin C. C., Lowe S. A., Thurstans R. P., 1989a, ApJ, 338, 78
- Bertin et al. (1989b) Bertin G., Lin C. C., Lowe S. A., Thurstans R. P., 1989b, ApJ, 338, 104
- Bosma (1999) Bosma A., 1999, in Merritt D. R., Valluri M., Sellwood J. A., eds, Astronomical Society of the Pacific Conference Series Vol. 182, Galaxy Dynamics - A Rutgers Symposium.
- Bosma (2016) Bosma A., 2016, preprint, (arXiv:1612.05272)
- Buta et al. (2009) Buta R. J., Knapen J. H., Elmegreen B. G., Salo H., Laurikainen E., Elmegreen D. M., Puerari I., Block D. L., 2009, AJ, 137, 4487
- Buta et al. (2015) Buta R. J., et al., 2015, ApJS, 217, 32
- Combes & Elmegreen (1993) Combes F., Elmegreen B. G., 1993, A&A, 271, 391
- Comerón et al. (2012) Comerón S., et al., 2012, ApJ, 759, 98
- Debattista et al. (2006) Debattista V. P., Mayer L., Carollo C. M., Moore B., Wadsley J., Quinn T., 2006, ApJ, 645, 209
- Dobbs & Baba (2014) Dobbs C., Baba J., 2014, Publ. Astron. Soc. Australia, 31, e035
- Dobbs & Pringle (2010) Dobbs C. L., Pringle J. E., 2010, MNRAS, 409, 396
- Durbala et al. (2009) Durbala A., Buta R., Sulentic J. W., Verdes-Montenegro L., 2009, MNRAS, 397, 1756
- Elmegreen (1981) Elmegreen D. M., 1981, ApJS, 47, 229
- Elmegreen & Elmegreen (1984) Elmegreen D. M., Elmegreen B. G., 1984, ApJS, 54, 127
- Elmegreen & Elmegreen (1985) Elmegreen B. G., Elmegreen D. M., 1985, ApJ, 288, 438
- Elmegreen & Elmegreen (1995) Elmegreen D. M., Elmegreen B. G., 1995, ApJ, 445, 591
- Elmegreen & Hunter (2006) Elmegreen B. G., Hunter D. A., 2006, ApJ, 636, 712
- Elmegreen & Parravano (1994) Elmegreen B. G., Parravano A., 1994, ApJ, 435, L121
- Elmegreen et al. (2007) Elmegreen B. G., Elmegreen D. M., Knapen J. H., Buta R. J., Block D. L., Puerari I., 2007, ApJ, 670, L97
- Elmegreen et al. (2011) Elmegreen D. M., et al., 2011, ApJ, 737, 32
- Erwin et al. (2005) Erwin P., Beckman J. E., Pohlen M., 2005, ApJ, 626, L81
- Erwin et al. (2008) Erwin P., Pohlen M., Beckman J. E., 2008, AJ, 135, 20
- Eskew et al. (2012) Eskew M., Zaritsky D., Meidt S., 2012, AJ, 143, 139
- Eskridge et al. (2000) Eskridge P. B., et al., 2000, AJ, 119, 536
- Fisher & Drory (2008) Fisher D. B., Drory N., 2008, AJ, 136, 773
- Fisher & Drory (2016) Fisher D. B., Drory N., 2016, Galactic Bulges, 418, 41
- Foyle et al. (2008) Foyle K., Courteau S., Thacker R. J., 2008, MNRAS, 386, 1821
- Freeman (1970) Freeman K. C., 1970, ApJ, 160, 811
- Gadotti (2008) Gadotti D. A., 2008, MNRAS, 384, 420
- Gadotti (2009) Gadotti D. A., 2009, MNRAS, 393, 1531
- Gadotti (2011) Gadotti D. A., 2011, MNRAS, 415, 3308
- Gadotti et al. (2007) Gadotti D. A., Athanassoula E., Carrasco L., Bosma A., de Souza R. E., Recillas E., 2007, MNRAS, 381, 943
- Goldreich & Lynden-Bell (1965) Goldreich P., Lynden-Bell D., 1965, MNRAS, 130, 125
- Gutiérrez et al. (2011) Gutiérrez L., Erwin P., Aladro R., Beckman J. E., 2011, AJ, 142, 145
- Harsoula et al. (2016) Harsoula M., Efthymiopoulos C., Contopoulos G., 2016, MNRAS, 459, 3419
- Hunter & Elmegreen (2006) Hunter D. A., Elmegreen B. G., 2006, ApJS, 162, 49
- Julian & Toomre (1966) Julian W. H., Toomre A., 1966, ApJ, 146, 810
- Kennicutt (1989) Kennicutt Jr. R. C., 1989, ApJ, 344, 685
- Kim et al. (2014) Kim T., et al., 2014, ApJ, 782, 64
- Kim et al. (2015) Kim T., et al., 2015, ApJ, 799, 99
- Kim et al. (2016) Kim T., Gadotti D. A., Athanassoula E., Bosma A., Sheth K., Lee M. G., 2016, preprint, (arXiv:1607.08245)
- Knapen et al. (2000) Knapen J. H., Shlosman I., Peletier R. F., 2000, ApJ, 529, 93
- Lin (1970) Lin C. C., 1970, in Becker W., Kontopoulos G. I., eds, IAU Symposium Vol. 38, The Spiral Structure of our Galaxy. p. 377
- Lin & Bertin (1985) Lin C. C., Bertin G., 1985, in van Woerden H., Allen R. J., Burton W. B., eds, IAU Symposium Vol. 106, The Milky Way Galaxy. pp 513–530
- Lin & Shu (1964) Lin C. C., Shu F. H., 1964, ApJ, 140, 646
- Lindblad (1959) Lindblad B., 1959, Handbuch der Physik, 53, 21
- Maltby et al. (2012) Maltby D. T., et al., 2012, MNRAS, 419, 669
- Marinova & Jogee (2007) Marinova I., Jogee S., 2007, ApJ, 659, 1176
- Mark (1976a) Mark J. W.-K., 1976a, ApJ, 203, 81
- Mark (1976b) Mark J. W. K., 1976b, ApJ, 205, 363
- Mark (1976c) Mark J. W.-K., 1976c, ApJ, 206, 418
- Mark (1977) Mark J. W.-K., 1977, ApJ, 212, 645
- Martin (1995) Martin P., 1995, AJ, 109, 2428
- Martín-Navarro et al. (2012) Martín-Navarro I., et al., 2012, MNRAS, 427, 1102
- Menéndez-Delmestre et al. (2007) Menéndez-Delmestre K., Sheth K., Schinnerer E., Jarrett T. H., Scoville N. Z., 2007, ApJ, 657, 790
- Muñoz-Mateos et al. (2013) Muñoz-Mateos J. C., et al., 2013, ApJ, 771, 59
- Muñoz-Mateos et al. (2015) Muñoz-Mateos J. C., et al., 2015, ApJS, 219, 3
- Neumann et al. (2017) Neumann J., et al., 2017, preprint, (arXiv:1705.00637)
- Pohlen & Trujillo (2006) Pohlen M., Trujillo I., 2006, A&A, 454, 759
- Pohlen et al. (2002) Pohlen M., Dettmar R.-J., Lütticke R., Aronica G., 2002, A&A, 392, 807
- Querejeta et al. (2015) Querejeta M., et al., 2015, ApJS, 219, 5
- Regan (2013) Regan M. W., 2013, in American Astronomical Society Meeting Abstracts #221. p. 230.02
- Regan & Elmegreen (1997) Regan M. W., Elmegreen D. M., 1997, AJ, 114, 965
- Roberts (1969) Roberts W. W., 1969, ApJ, 158, 123
- Romero-Gómez et al. (2006) Romero-Gómez M., Masdemont J. J., Athanassoula E., García-Gómez C., 2006, A&A, 453, 39
- Saha & Elmegreen (2016) Saha K., Elmegreen B., 2016, ApJ, 826, L21
- Salo et al. (2010) Salo H., Laurikainen E., Buta R., Knapen J. H., 2010, ApJ, 715, L56
- Salo et al. (2015) Salo H., et al., 2015, ApJS, 219, 4
- Schaye (2004) Schaye J., 2004, ApJ, 609, 667
- Seiden & Gerola (1979) Seiden P. E., Gerola H., 1979, ApJ, 233, 56
- Seigar & James (1998) Seigar M. S., James P. A., 1998, MNRAS, 299, 685
- Seigar et al. (2003) Seigar M. S., Chorney N. E., James P. A., 2003, MNRAS, 342, 1
- Sellwood (1980) Sellwood J. A., 1980, A&A, 89, 296
- Sellwood & Sparke (1988) Sellwood J. A., Sparke L. S., 1988, MNRAS, 231, 25P
- Sheth et al. (2010) Sheth K., et al., 2010, PASP, 122, 1397
- Tagger et al. (1987) Tagger M., Sygnet J. F., Athanassoula E., Pellat R., 1987, ApJ, 318, L43
- Toomre (1969) Toomre A., 1969, ApJ, 158, 899
- Toomre (1981) Toomre A., 1981, in Fall S. M., Lynden-Bell D., eds, Structure and Evolution of Normal Galaxies. pp 111–136
- Toomre & Kalnajs (1991) Toomre A., Kalnajs A. J., 1991, in Sundelius B., ed., Dynamics of Disc Galaxies. p. 341
- Whyte et al. (2002) Whyte L. F., Abraham R. G., Merrifield M. R., Eskridge P. B., Frogel J. A., Pogge R. W., 2002, MNRAS, 336, 1281
- van der Kruit (1979) van der Kruit P. C., 1979, A&AS, 38, 15
- van der Kruit (1987) van der Kruit P. C., 1987, A&A, 173, 59