A Consolidated Framework of the Color Variability in Blazars: Long-Term Optical/Near-Infrared Observations of 3C 279
Abstract
We evaluate the optical/near-infrared (OIR) color variability of 3C 279 in both -ray flaring and non-flaring states over 7-year timescales using the Small and Medium Aperture Research Telescope System (SMARTS) in Cerro Tololo, Chile and -ray fluxes obtained from the Fermi -ray Space Telescope. This observing strategy differs from previous blazar color variability studies in two key ways: 1) the reported color variability is assessed across optical through near-infrared wavelengths, and 2) the color variability is assessed over timescales significantly longer than an individual flare or ground-based observing season. We highlight 3C 279 because of its complex color variability, which is difficult to reconcile with the simple ‘redder when brighter’ behavior often associated with Flat Spectrum Radio Quasar (FSRQ) color variability. We suggest that the observed OIR color changes depend on a combination of the jet and disk emission. We parametrize this behavior in terms of a single variable, , representing a smooth transition from disk-dominated, to a mixed contribution, to a jet-dominated system, which provides an explanation of the long-term OIR color variability in the same blazar over time. This suggests a general scheme that could apply to OIR color variability in other blazars.
Subject headings:
BL Lacertae objects: individual (3C 279) —galaxies: active — galaxies: jets1. Introduction
Blazars are radio-loud active galactic nuclei (AGN) whose relativistic jet is pointed at small angles with respect to the line of sight (Antonucci 1993; Urry & Padovani 1995). The bulk relativistic outflow of these charged particles, along with the small viewing angles, induces Doppler beaming along the direction of the outflow such that the beamed emission dominates the bolometric luminosity. This makes blazars ideal laboratories for the study of relativistic jets.
Blazars can be divided into two sub-classes: Flat Spectrum Radio Quasars (FSRQs) and BL Lac objects (BL Lacs). While FSRQs generally have prominent emission lines, BL Lacs are characterized by the absence or extreme weakness of emission lines, with equivalent width 5Å (Urry & Padovani 1995). Generally, FSRQs have higher jet luminosity and lower peak synchrotron frequencies in the broadband spectral energy distribution (SED), and BL Lacs have lower jet luminosity and higher synchrotron peak frequencies (Fossati et al. 1998), although as observations of blazars have probed a wider range of -ray and radio luminosities, it appears that there is likely a blazar envelope rather than a sequence (Meyer et al. 2012). When characterized by their peak synchrotron frequencies, blazars can be subdivided as low- ( 1014 Hz), intermediate- (1014-15 Hz) and high- synchrotron peaked sources ( 1015 Hz) (Padovani & Giommi 1996; Abdo et al. 2010b).
The location of the peak synchrotron frequency, , is determined in part by the power-law energy density distribution of non-thermal electrons producing some of the observed optical/near-infrared (OIR) emission. Blazars can also have strong thermal components (the accretion disk and/or broad emission line region) that contribute significantly in the OIR.
The optical color variability of blazars has historically been associated with blazar type: FSRQs have been observed to be redder when brighter (Ramírez et al. 2004; Gu et al. 2006; Osterman Meyer et al. 2008, 2009; Bonning et al. 2012), likely due to an increase in the relative contribution of the beamed jet emission to the less variable, bluer accretion disk emission. Alternatively, BL Lacs are often observed in bluer when brighter states, likely a result of significantly less radiative cooling of highly accelerated electrons off an under-luminous or non-existent accretion disk (Massaro et al. 1998; Villata et al. 2002; Vagnetti et al. 2003; Gu & Ai 2011a; Gaur et al. 2012). These observations have been extrapolated to represent the “typical” behavior of FSRQs and BL Lacs.
Many departures from this putative dichotomy in color variability have been reported with some FSRQs becoming bluer when brighter (Gu & Ai 2011b), and at other times, redder when brighter (Wu et al. 2011); some blazars remain achromatic with increasing brightness (Ghosh et al. 2000; Stalin et al. 2006). Ghisellini et al. (1997) observed BL Lac S5 0716+714 for 5 months using the International Ultraviolet Explorer, with two weeks of overlapping EGRET observations. Observing in the optical bands, they find that color flattens with increasing brightness during the monitored -ray flares, but that this color-brightness relationship is insensitive to the full 5 month trends.
Gu et al. (2006) found that of 8 red blazars observed over 5 months, 5 BL Lacs were bluer when brighter, 2 FSRQs were redder when brighter, and one FSRQ was achromatic over the observation period. Böttcher et al. (2005) observed BL Lac 3C 66A over 9 months in 2003, with a core campaign of 3 months, and reported a change in the optical color variability from redder when brighter to a flattening at the brightest magnitudes.
However, these color variability studies were limited to short timescale observations (from a few days to a few months) of flaring episodes in specific blazars, and often only in the optical bands. Given the phenomenological differences between BL Lacs and FSRQs, when they are preferentially observed during -ray flares, it is possible to incorrectly infer a dichotomy of behavior when a continuous transition might exist. Such behavior may only be detected when the source is monitored over long time frames to allow for a larger diversity of source behaviors.
As part of our Small and Medium Aperture Research Telescope System (SMARTS) OIR monitoring of blazars (Bonning et al. 2012), we observed detailed color variations in both BL Lac objects and FSRQs, across a large variation in brightness by analyzing 3 years of OIR color variability in 12 Fermi-bright blazars. This study also concluded that the fractional variability amplitude increases blueward of the peak synchrotron frequency and that, for many FSRQs, the infrared is more variable than the optical during jet flares, suggesting an increase in the presence of non-thermal emission in the infrared bands.
In the current work, we investigate the OIR color variability of the FSRQ 3C 279 (z = 0.536) and extend previous color variability analyses both temporally, with on-average nightly cadence over 7 years, and spectrally by including near-infrared photometry, which greatly extends the color baseline, to investigate the long-term OIR color variability.
3C 279 has a well-studied broadband variability profile during both -ray active and quiescent states (e.g. Maraschi et al. 1994; Hartman et al. 1996). Wehrle et al. (1998) found that the broadband spectral energy distribution showed inverted spectral variations such that the optical emission was lower by a factor of 2 when the -ray emission was higher by a factor of 4 during an active phase. Several studies have found evidence for correlated variability between the optical and -ray energies, although correlation with IR and -rays has not been as consistently detected, even in the Fermi era (Bonning et al. 2012). Thus, its complex spectral behavior makes it an ideal candidate to investigate OIR color variability.
We present the details of the SMARTS optical, near-infrared and Fermi -ray monitoring program, data reduction and analysis in § 2. The multiwavelength light curve and OIR color variability of 3C 279 on short- and long-timescales are presented in § 3. In § 4, we propose a consolidated framework for understanding the OIR color variability in blazars in terms of the slope of the OIR color variability diagram, and then discuss the significance of our current findings with respect to the apparent blazar-color variability dichotomy in § 5. We summarize our conclusions in § 6.
2. Observations & Data Analysis
Optical/near-infrared photometry of 3C 279 between 2008 May 17 and 2015 December 31 was obtained using the SMARTS 1.3m + ANDICAM in Cerro Tololo, Chile. ANDICAM is a dual-channel imager with a dichroic that simultaneously illuminates an optical CCD and IR imager yielding photometry from 0.4 - 2.2 m (spanning the Johnson-Cousins BVRJK bands). Photometric cadence is roughly nightly as long as the source is visible from Cerro Tololo and as weather permits.
The OIR photometric reduction and analysis were described in Bonning et al. (2012) and will only be summarized briefly here. Optical comparison stars were calibrated from Landolt standards on photometric nights. The near-infrared magnitudes are calibrated using Two Micron All Sky Survey magnitudes (Skrutskie et al. 2006) of a secondary star in the same field as 3C 279. In the optical bands, the photometric uncertainties are dominated by the random errors in the photometric calibration of the comparison star magnitude from the USNO-B catalog, or 0.03 magnitudes (Monet et al. 2003). We estimate the uncertainty in the near-infrared bands to be 0.05 magnitudes.
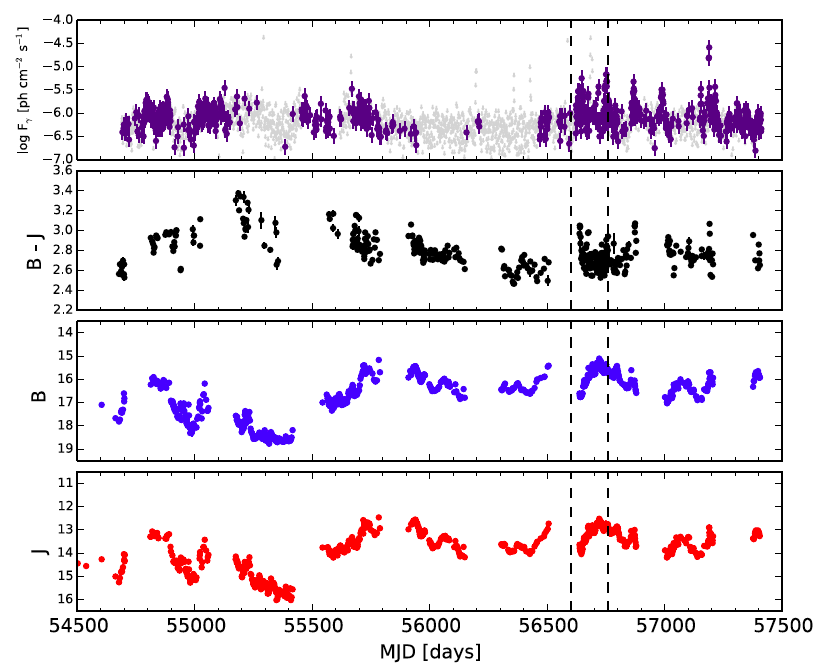
The SMARTS B- and J-band, B J color and Fermi -ray flux light curves for 3C 279 are shown in Figure 1. We refer the reader to the SMARTS website111http://www.astro.yale.edu/smarts/glast/home.php, where OIR photometry is publicly available for the full SMARTS source list. Data included in the present analysis have had errant data points that are associated with instrumental aberrations and other non-physical origins removed. These points are easily identified by single-band deviations in the SMARTS data and datapoints that vary by more than 3 standard deviations from nearby measurements.
Fermi/LAT data were obtained from the Fermi Science Support Center website222http://fermi.gsfc.nasa.gov/ssc/data/access between 2008 2015. Pass 7 reprocessed data (event class 3) were analyzed using Fermi Science Tools (v9r33p0) with customized scripts to automate the likelihood analysis. Galactic diffuse model (gll_iem_v05_rev1), isotropic diffuse background (iso_clean_v05) and instrument response functions (P7REP_CLEAN_V15) were utilized in the analysis. Data were constrained to time periods where the zenith angle was less than 100∘ to avoid Earth limb contamination and only photons within a 10∘ region centered on the source of interest were analyzed. The -ray spectra was modeled as a log-parabola, according to the spectrum type listed in the 3FGL catalog, with the photon flux and spectral index as free parameters. Fermi light curves (E 100MeV) were calculated in one day bins to match the average SMARTS cadence. Daily points for which TS 16 are plotted, where TS is the Fermi test statistic and is roughly equivalent to the source detection significance per integrated bin (Mattox et al. 1996; Abdo et al. 2009).
3. Results
3C 279 was regularly detected by Fermi with high -ray significance from 2008 November 30 through 2011 August 27 (MJD 54800 55800), after which time the source underwent a period of relative jet quiescence. Subsequently, a -ray flare was detected between 2013 November 04 and 2014 April 13 (MJD 56600 56760) with peak Fγ[E100 MeV] 7 10-6 ph s-1 cm-2, and a corresponding OIR flare with peak magnitudes B 15.5 mag and J 12.5 mag, as seen in Figure 1.
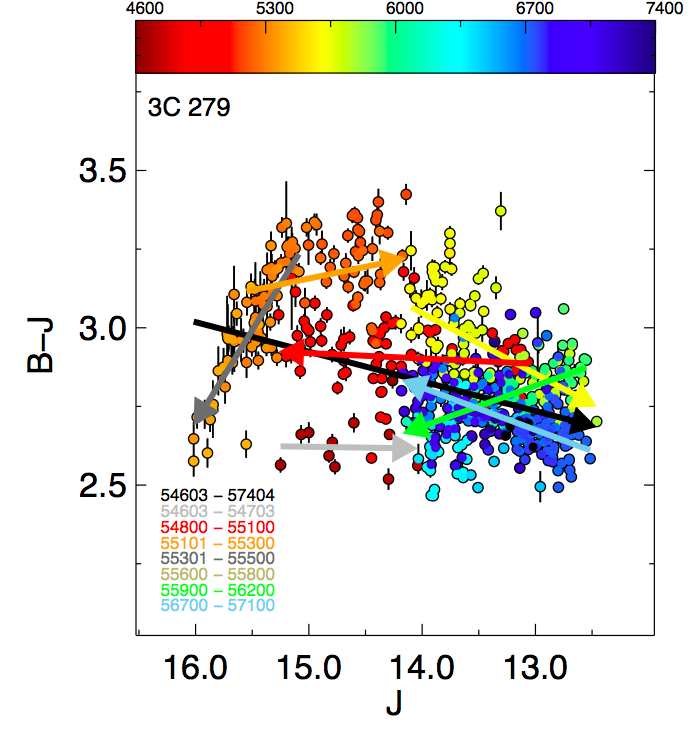
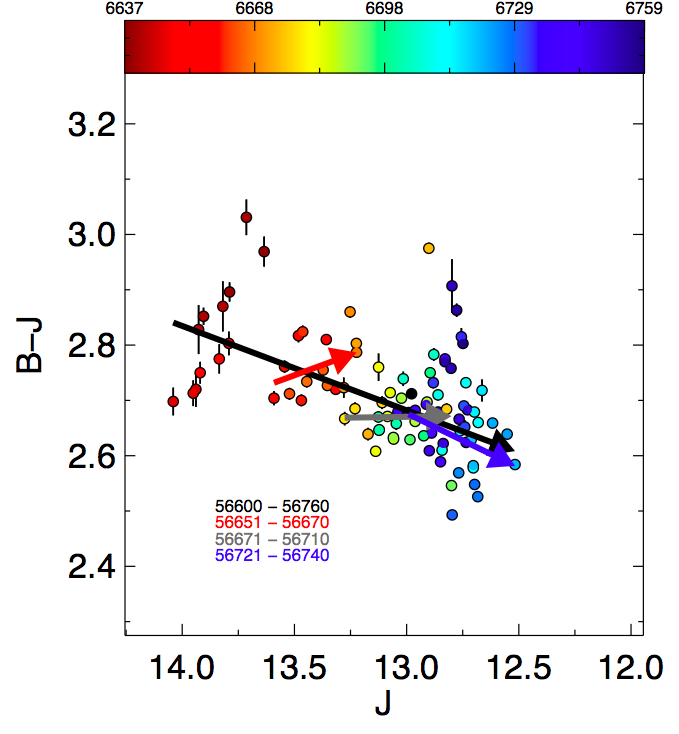
We plot the OIR color variability diagrams, i.e. B J color versus J-band magnitude, for 3C 279 in Figures 2 and 3. Figure 2 shows the OIR color variability over the full SMARTS monitoring period between 2008 2015. Figure 3 illustrates the OIR color variability for the 2013 November 04 through 2014 April 13 (MJD 56600 56760) -ray flare lasting 160 days.
For the purposes of this work, “long-term” indicates the 7 years of data collected for 3C 279, which includes several jet activity states, that is, enough time for 3C 279 to transition from -ray quiescence to activity more than once. We also parse the data into smaller epochs to characterize short-term variability patterns. While this separation of the data is, by definition, arbitrary, it has been reported that measuring blazar variability on logarithmic timescales allows for the most complete and least biased characterization of the data (Chatterjee et al. 2012).
We measure the slope of the OIR color variability of a given flare with a t of order a few days, 10s of days, 100s of days and 1000s of days. We fit a linear, least squares regression to the data.
To quantify the OIR color variability, we measure the slope of the B J versus J-band magnitude, as plotted in Figures 2 4 and defined as:
| (1) |
where m is the sign of (B J) and n is the sign of J along the time sequence. Note that there are two physically distinct ways for 0 and 0 to result. If the sign of (B J) and J are the same, 0. If the sign of (B J) and J are different, 0. The epochs of OIR color variability analyzed in this work are listed in Table 1.
In Figure 2, the average slope of OIR color variability, , over the 7 years is indicated by the black arrow; 3C 279 is bluer when brighter ( 0) over the longest timescales observed by SMARTS. However, it can also be clearly seen that the OIR color variability deviates significantly from this trend on shorter timescales. For example, redder when brighter ( 0; orange arrow), redder when fainter ( 0; blue arrow), achromatic ( 0; light grey arrow), bluer when brighter ( 0 yellow arrow) and bluer when fainter ( 0; dark grey and green arrows) color variability can also be seen.
In addition, the average OIR color 2.5 over J = 3 mag; while there is clear color variability present, there may be a lower limit to how blue the OIR color can be. For 3C 279, this is likely due to the spectrum of the underlying, but relatively luminous accretion disk (Pian et al. 1999).
We report similar OIR color variability on short timescales, as seen in Figure 3. The turnover in is evident from redder when brighter ( 0; red arrow) to nearly flat ( 0; grey arrow) to bluer when brighter ( 0; blue arrow) over the 160 day flare. We note that the entire flare plotted in Figure 3 took place when 3C 279 was brighter, on average, than the previous 6 years of monitoring (J 13.09 mag) and that the average OIR color is bluer when brighter ( 0; black arrow) during the flare. Thus, while the overall color variability is bluer as the source brightens over the -ray flare, there are changes in the color variability on timescales of tens and hundreds of days.
| Start | End | t | J | CV | ||
|---|---|---|---|---|---|---|
| (MJD) | (MJD) | (days) | (mag) | |||
| 54603 | 57404 | 2801 | 13.83 | 0.094 | BWB | |
| 54800 | 55100 | 300 | 14.29 | 0.017 | ACH | |
| 54603 | 54703 | 100 | 14.65 | 0.006 | ACH | |
| 55101 | 55300 | 199 | 14.91 | -0.075 | RWB | |
| 55301 | 55500 | 199 | 15.63 | -0.587 | BWF | |
| 55600 | 55800 | 200 | 13.42 | 0.193 | BWB | |
| 55900 | 56200 | 300 | 13.25 | -0.129 | BWF | |
| 56700 | 57100 | 400 | 13.21 | 0.134 | RWF | |
| 56600 | 56760 | 160 | 13.09 | 0.153 | BWB | |
| 56600 | 56650 | 50 | 13.86 | -0.750 | BWF | |
| 56651 | 56670 | 19 | 13.41 | -0.150 | RWB | |
| 56671 | 56710 | 39 | 13.02 | -0.006 | ACH | |
| 56711 | 56720 | 9 | 12.70 | -0.188 | BWF | |
| 56721 | 56740 | 19 | 12.76 | 0.20 | BWB | |
| 56741 | 56760 | 19 | 12.82 | -0.386 | RWB |
Note. — Column contents: (1) and (2) Start and End Dates in MJD that define each epoch; (3) t the number of days over which is calculated, (4) J the average J-band magnitude for each epoch, (5) the calculated value of the OIR slope, (6) as defined in Equation 1 with m,n specified and (7) CV the OIR color variability as indicated by the arrows in Figure 4. Abbreviations for CV: BWB bluer when brighter; ACH achromatic; RWB redder when brighter; BWF bluer when fainter; RWF redder when fainter.
4. Long-term OIR Color Variability:
A Continuum, not a Dichotomy
We suggest a simple framework to describe the short- and long-term OIR color variability observed in blazars. Specifically, these data can be explained, in many cases, by the differing relative contribution of the thermal disk and non-thermal jet emission.
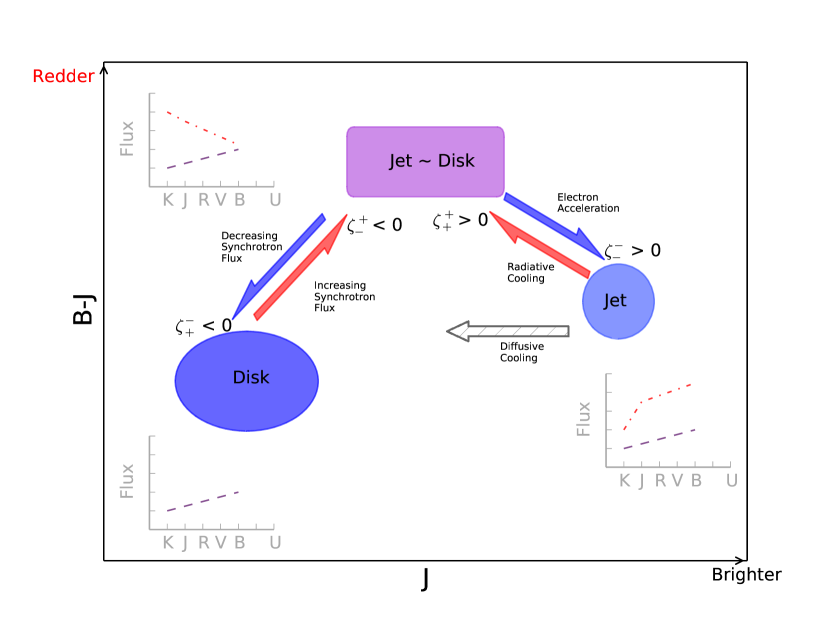
Figure 4 is a schematic representation of the OIR color variability in a typical blazar. The shaded regions represent distinct physical regimes: 1) accretion disk dominant color, 2) an admixture of disk-jet colors, and 3) jet dominant color. Offset from each OIR color “state” is a representative SED to help the reader interpret the spectral shape of an OIR color variability change, but does not indicate the SED of a specific blazar.
The observed color variations are described by a change in the jet emission, disk emission, or a combination of the two. Thus, while the SED shape is expected to differ from source to source as it depends on the source jet and disk luminosity, the relative positions of the states with respect to one another are physically robust.
We use empirical data from 3C 279, as shown in Figures 2 and 3, to outline this framework, which explains how blazars can smoothly evolve from a jet-quiescent, disk-dominated OIR color profile to an actively jet flaring state and associated OIR color profile and back to jet-quiescent state.
4.1. Accretion Disk Dominant Color
When the blazar jet is quiescent, the accretion disk spectrum is often observable in the OIR-UV regime (Pian et al. 2005). It is believed that the temperature of the accretion disk scales with black hole mass (Shakura & Sunyaev 1973; Frank et al. 2002) and for black hole masses MBH 108M⊙ the peak disk luminosity is in the extreme ultraviolet; for 3C 279, Tdisk 20 000 K (Pian et al. 1999). It follows that in the OIR regime, the thermal disk spectrum is bluer, since it is on the exponentially increasing side of a multi-temperature blackbody profile with vanishingly little contribution to the IR (or redder) bands (Ghisellini 2013). The OIR color would therefore be bluer, as represented schematically by the blue ellipse in lower left of Figure 4. This state can be seen in the OIR color variability of 3C 279 as shown in Figure 2 where J 16 mag and B J 2.6.
Any increase in jet activity due to an increase in synchrotron flux would cause a reddening of the OIR color and a decrease in the magnitude of the source (i.e. brightening), due to the differing spectral shapes as shown in Figure 4 and described in Section 4.2. This would result in 0, which is represented by the red () and blue () arrows in Figure 4, and represents the color evolution as the synchrotron flux increases and decreases, respectively. During jet quiescent states, we expect the OIR color to be relatively blue and the intensity to be relatively faint. In addition, the OIR color should be well-localized in this parameter space since the blazar accretion disk luminosity does not vary significantly on short timescales (Lira et al. 2011).
4.2. Admixture of Accretion Disk-Jet Color
At the onset of a jet flare, the non-thermal synchrotron radiation will increase from the radio through the OIR, UV and/or soft X-rays depending on . This increase in non-thermal emission results in an increased number of non-thermal photons with a redder spectral shape, thus moving simultaneously up and to the right ( 0) as indicated by the red arrow in Figure 4.
For 3C 279, which is an LSP FSRQ, the highly variable non-thermal jet emission is proportionally redder than the thermal disk emission in the OIR band peaking in the infrared because of the location of the synchrotron peak, so as the jet flares, the OIR color becomes redder when brighter ( 0). This color evolution will persist as long as the observed jet luminosity is below the disk luminosity.
However, as the jet emission increases and becomes more comparable to the disk emission, 0 with increasing brightness due to the differing spectral shape of the two components. Namely, the proportionally redder spectrum of the jet begins to rival and ultimately overcome the bluer disk emission due to Doppler beaming. In that case, the observed OIR color variability flattens before either turning blue with increasing jet contribution ( 0; as described in the next section) or fading back into a jet-quiescent phase ( 0). Sources with this combination of disk and jet emission will occupy the purple rectangular region representing approximately equal contributions in color-magnitude space of both thermal and non-thermal emission; such color “saturation”, 0, has been observed in several blazars (Villata et al. 2006; Bonning et al. 2012; Chatterjee et al. 2013). This is most clearly seen in Figure 2 between MJD 54603 54703, where B J is relatively constant; the fit parameters for this epoch can be seen in Table 1.
4.3. Jet Dominant Color
Since the non-thermal jet emission is Doppler boosted and the disk emission is not, the observed jet luminosity will completely swamp the disk luminosity even if the intrinsic luminosities are similar. Once the jet emission has swamped the disk emission in the OIR regime, the OIR color is determined by the individual relativistic plasma ejections causing the flaring. We observe two distinct OIR color variability behaviors in the jet dominated state: i) bluer when brighter ( 0) and, ii) redder when brighter ( 0). In the former case, while the -ray flare is dominant, the OIR color becomes bluer when brighter, likely due the electrons producing the synchrotron emission reaching higher energies before radiatively cooling on ambient photons from the disk, broad line region and/or molecular torus (depending on distance from central source). Thus, the bluer when brighter behavior is related to the spectral evolution of the non-thermal emission to higher intensities and higher spectral frequency. This is the OIR color variability behavior expected in a blazar jet dominant state and is indicated by the blue arrow ( 0) in Figure 4.
In the latter case, the additional -ray flares may not reach as high an energy as the accelerated electrons that were previously produced, and thus appear redder even as the source continues to brighten. This reddening is physically distinct from (although phenomenologically similar to) the redder when brighter behavior that is observed during the admixture of disk and jet emission. The jet-dominated increase in redness is due to distinct electron acceleration episodes and not to the relative global colors of the disk and jet emission. Therefore, this is an intrinsically transient state that persists only as long as a detectable difference in particle acceleration and resultant radiation spectrum is present. This transient state is governed by the particle cooling time.
Both cases of jet-dominated behavior have been observed in 3C 279 on short timescales, as can be seen in Figure 3, namely bluer when brighter, 0 (blue arrow; MJD 56721 56740) and redder when brighter 0 (red arrow; MJD 56651 56670) behavior seen on timescales of tens of days. The fits to these epochs can be found in Table 1.
4.4. Cooling Mechanisms
As the -ray flare dissipates, the cooling mechanisms are also imprinted on the OIR color evolution, as described below and shown in Figure 4.
-
•
Radiative Cooling: The highest energy electrons in the jet dominant state produce a bluer when brighter spectrum as they are accelerated ( 0), but as that radiation dissipates, the electrons cool by reddening (Figure 4, red arrow; 0). However, as the total flare dissipates and again becomes comparable to the disk luminosity, the OIR color variability will decrease toward the blue (Figure 4, blue arrow; 0). This type of radiative cooling can be seen by the blue arrow in Figure 2, near J 13.5 mag, where the source is becoming redder as it is fading in brightness ( 0).
-
•
Diffusive (or Escape) Cooling: If the highest energy electrons escape the emitting region on timescales much shorter than the radiative cooling timescale, these accelerated electrons will not contribute to the OIR color evolution even as the energy density decreases, causing the flare to fade approximately achromatically, especially as the source fades in luminosity in the jet-disk to disk states. Since the cooling rate is energy dependent, the higher energy end of the electron energy density distribution is evacuated faster than the lower energy end and the system cools with virtually no change in color. Such achromatic cooling is indicated by the red arrow in Figure 2 with magnitude 15 J 14 ( 0).
5. Discussion
5.1. Previous Color Variability Studies
Previous blazar color variability studies found in the literature find two distinct responses: 1) BL Lacs become bluer when brighter and, 2) FSRQs become redder when brighter (e.g. Massaro et al. 1998; Ghosh et al. 2000; Trèvese & Vagnetti 2002; Villata et al. 2002; D’Amicis et al. 2002; Vagnetti et al. 2003; Gu et al. 2006; Ramírez et al. 2004; Wu et al. 2011). These results often led to the interpretation that these are the only optical color variability behaviors that could arise. The bluer when brighter behavior observed in BL Lacs was thought to be due to electrons being accelerated to preferentially higher energies before radiatively cooling, and FSRQs were thought to become redder when brighter because of the addition of redder, non-thermal jet emission to an already blue, thermal disk component. These interpretations are aligned with the framework we present here, but we suggest that the apparent dichotomy in color variability of FSRQs and BL Lacs arises because they are preferentially observed while flaring, causing a selection effect such that the two extreme ends of the color variability continuum are most regularly observed. Thus, the previous color variability results can be thought of as ‘snapshots’ of the long-term OIR color variability framework presented here, as demonstrated using the blazar 3C 279.
Ruan et al. (2014) point out that optical color variations could be the result of “hot spots” in the accretion disk emission. Our present analysis cannot resolve changes in disk luminosity at this scale and thus cannot be directly compared to the current study.
5.2. Estimating the Disk Luminosity using OIR Color Variability
While blazars are generally jet-dominated, during phases of jet quiescence the thermal disk contribution can sometimes be seen. If one assumes that the disk does not vary as quickly as the jet, then on short timescales, one can measure the increasing non-thermal OIR contribution by holding the thermal contribution constant and measuring the difference in color. Thus, we can in principle determine solely from the OIR color (while confirming the presence of jet activity using simultaneous -ray flux measurements) whether we are in a disk-dominated, a jet-dominated, or an admixture of disk-jet regime.
For sources that have highly luminous accretion disks, as the jet increases in luminosity and color contribution, the color variability will tend to flatten (less change in OIR color with increase in brightness) even as the magnitude continues to increase because the non-thermal –and beamed – jet emission overtakes the thermal disk emission in those bands. More specifically, the competition between the differing spectral shapes of the thermal and non-thermal components will tend to produce a flat spectral shape in the OIR wavebands. This flattening in color variability space will persist until the jet has completely swamped the disk in both luminosity and color after which point, if the jet continues to intensify, the color variability would become bluer when brighter ( 0). Such flattening in the color variability has been observed in 3C 279, as well as in PKS 1510-089 and 3C 454.3 (Bonning et al. 2012). This flattening can also account for a decrease in rate of color variability change observed in previous short-term analyses, which do not manifest in longer term data on the same source (Ghisellini et al. 1997; Böttcher et al. 2005).
5.3. Extending the OIR Color Variability Diagram to Other Sources
While we leave a fuller treatment of the OIR color variability of the entire SMARTS sample to the next paper in this series, we do consider examples of divergent OIR color variability extant in the literature. Bonning et al. (2012) reported peculiar OIR color variability in low-synchrotron peaked BL Lac object OJ 287 over long timescales, where it was found to deviate from the bluer when brighter behavior generally associated with BL Lacs. While the cause of the complex OIR color variability in OJ 287 is still unclear, Bonning et al. (2012) reported a number of physical scenarios that could give rise to such behavior. Among them: rapid and recurrent electron injections and an interplay between the accretion disk and jet emission; both scenarios fit within the framework presented here.
Furthermore, it is important to note that diffusive/escape cooling is not the only way that a blazar could undergo minimal color variations while changes in observed magnitude are detected. If, for example, there are changes in the jet direction (for early work on jet precession see Gower et al. 1982), and hence changes in the Doppler boosting factor then the blazar magnitude could increase or decrease without a detectable change to the OIR color. This is true as long as the non-thermal spectrum maintains a constant slope throughout the wavelengths boosted in the observed OIR waveband due to precession; otherwise, a bluer OIR spectrum would result from an increase in Doppler boosting (and photon energy). We note that such jet precession has been postulated for 3C 279 (Abraham & Carrara 1998) and other blazars (Caproni et al. 2013; Qian et al. 2014), and cannot be ruled out with the present dataset.
The particle acceleration and cooling mechanisms that govern the OIR color variability presented here are physically motivated and present in every blazar system, so that although the specific color of a source during quiescent and flaring states will vary, we posit that the overall color variability evolution is robust. We note that the progression in color variability space does not always cover the full parameter space represented in Figure 4. For example, if the color from a jet flare does not rival or overtake the disk color, only the redder when brighter ( 0) to bluer when fainter ( 0) evolution will be observed. This can explain why FSRQs, which have very luminous disks, are often found on the redder when brighter ( 0) portion of the diagram and BL Lacs, which often have under-luminous or non-existent accretion disks, are often found on the bluer when brighter ( 0) portion of the diagram.
A prediction of this framework is that high-synchrotron peaked blazars will not show redder when brighter ( 0) OIR color variability due to variability in the disk to jet luminosity because: a) their accretion disk is extremely weak or non-existent thereby removing the competing thermal emission in this regime and b) because the peak synchrotron frequency is so high, the OIR spectrum is bluer due to the spectral shape of the non-thermal emission and not due to the thermal disk emission as described in the model presented here. Low-synchrotron peaked blazars would be more likely to have a redder when brighter response because the range over which their peak synchrotron frequencies have been observed allow for such a behavior; the latter remains true for FSRQs.
5.4. OIR Color Variability and Optical Linear Polarization in 3C 279
Several studies on the optical polarization of individual blazars, as well as statistical studies of larger blazar samples have been undertaken in recent years (see Hovatta 2017, for a review), including for 3C 279 (Larionov et al. 2008; Abdo et al. 2010a; Zhang et al. 2015). Kiehlmann et al. (2016) report two electric vector position angle (EVPA) rotations in 3C 279: 352 during a -ray quiescent epoch (MJD 55100 55310; epoch 1), and -494 during a -ray flaring epoch (MJD 55658 55850; epoch 2). They suggest that two distinct types of processes produce the optical polarization in 3C 279: stochastic (during the low -ray brightness state) and deterministic (during the jet flaring state), based on the nature of the polarization variation.
We have reported the OIR color variability of these regions above (see Table 1) and find that during the -ray quiescent period (epoch 1) 0, indicating a transition from the disk-dominant phase with increasing contribution from the non-thermal (and polarized) jet emission. During the -ray flare (epoch 2), we report that 0 which corresponds to a jet-dominant phase, where the individual flares dominate the OIR emission. Thus, our results are consistent with the Kiehlmann et al. (2016) interpretation of the optical polarization results for these two epochs, such that the OIR color variability also indicate the degree to which this non-thermal and polarized emission is present in the optical bands. We note, however, that while it is not clear that optical polarization can be consistently correlated with -ray flaring, we suggest that in 3C 279, all phases of the jet evolution should be detectable in the OIR color variability diagram.
6. Summary and Conclusions
The analysis of the optical/near-infrared color variability on FSRQ 3C 279 over long and short-timescales can be interpreted in a framework in which a relatively blue accretion disk and redder jet change in relative intensity. In addition, the jet color can change on a rapid timescales while the disk color changes more slowly. We find that the OIR color variability behavior of 3C 279 is alternatively redder when brighter, 0, bluer when brighter, 0, or achromatic, 0, which can be described by the continuous variation in contribution of the thermal accretion disk and non-thermal relativistic jet in this source. During the highest energy -ray jet flares, the OIR color variability is dominated by the internal dynamics of individual jet flares. From these long-term observations, we have developed a framework that can be tested for other blazars. We have undertaken a similar long-term OIR color variability study of the SMARTS sample of blazars that will be reported in an upcoming paper (Isler et al., in preparation). Furthermore, we investigate the relationship between the OIR color variability and optical polarization in future papers.
References
- Abdo et al. (2009) Abdo, A. A., Ackermann, M., Ajello, M., et al. 2009, ApJ, 700, 597
- Abdo et al. (2010a) —. 2010a, Nature, 463, 919
- Abdo et al. (2010b) —. 2010b, ApJ, 722, 520
- Abraham & Carrara (1998) Abraham, Z., & Carrara, E. A. 1998, ApJ, 496, 172
- Antonucci (1993) Antonucci, R. 1993, ARA&A, 31, 473
- Bonning et al. (2012) Bonning, E., Urry, C. M., Bailyn, C., et al. 2012, ApJ, 756, 13
- Böttcher et al. (2005) Böttcher, M., Harvey, J., Joshi, M., et al. 2005, ApJ, 631, 169
- Caproni et al. (2013) Caproni, A., Abraham, Z., & Monteiro, H. 2013, MNRAS, 428, 280
- Chatterjee et al. (2012) Chatterjee, R., Bailyn, C. D., Bonning, E. W., et al. 2012, ApJ, 749, 191
- Chatterjee et al. (2013) Chatterjee, R., Fossati, G., Urry, C. M., et al. 2013, ApJ, 763, L11
- D’Amicis et al. (2002) D’Amicis, R., Nesci, R., Massaro, E., et al. 2002, Publications of the Astron. Soc. of Australia, 19, 111
- Fossati et al. (1998) Fossati, G., Maraschi, L., Celotti, A., Comastri, A., & Ghisellini, G. 1998, MNRAS, 299, 433
- Frank et al. (2002) Frank, J., King, A., & Raine, D. J. 2002, Accretion Power in Astrophysics: Third Edition, Cambridge University Press
- Gaur et al. (2012) Gaur, H., Gupta, A. C., Strigachev, A., et al. 2012, MNRAS, 425, 3002
- Ghisellini (2013) Ghisellini, G. 2013, in European Physical Journal Web of Conferences, Vol. 61, European Physical Journal Web of Conferences, 5001
- Ghisellini et al. (1997) Ghisellini, G., Villata, M., Raiteri, C. M., et al. 1997, A&A, 327, 61
- Ghosh et al. (2000) Ghosh, K. K., Ramsey, B. D., Sadun, A. C., & Soundararajaperumal, S. 2000, ApJS, 127, 11
- Gower et al. (1982) Gower, A. C., Gregory, P. C., Unruh, W. G., & Hutchings, J. B. 1982, ApJ, 262, 478
- Gu & Ai (2011a) Gu, M., & Ai, Y. L. 2011a, Journal of Astrophysics and Astronomy, 32, 87
- Gu & Ai (2011b) Gu, M.-F., & Ai, Y. L. 2011b, A&A, 528, A95
- Gu et al. (2006) Gu, M. F., Lee, C.-U., Pak, S., Yim, H. S., & Fletcher, A. B. 2006, A&A, 450, 39
- Hartman et al. (1996) Hartman, R. C., Webb, J. R., Marscher, A. P., et al. 1996, ApJ, 461, 698
- Hovatta (2017) Hovatta, T. 2017, ArXiv e-prints, arXiv:1701.07997
- Kiehlmann et al. (2016) Kiehlmann, S., Savolainen, T., Jorstad, S. G., et al. 2016, A&A, 590, A10
- Larionov et al. (2008) Larionov, V. M., Jorstad, S. G., Marscher, A. P., et al. 2008, A&A, 492, 389
- Lira et al. (2011) Lira, P., Arévalo, P., Uttley, P., McHardy, I., & Breedt, E. 2011, MNRAS, 415, 1290
- Maraschi et al. (1994) Maraschi, L., Grandi, P., Urry, C. M., et al. 1994, ApJ, 435, L91
- Massaro et al. (1998) Massaro, E., Nesci, R., Maesano, M., Montagni, F., & D’Alessio, F. 1998, MNRAS, 299, 47
- Mattox et al. (1996) Mattox, J. R., Bertsch, D. L., Chiang, J., et al. 1996, ApJ, 461, 396
- Meyer et al. (2012) Meyer, E. T., Fossati, G., Georganopoulos, M., & Lister, M. L. 2012, ArXiv e-prints, arXiv:1205.0794
- Monet et al. (2003) Monet, D. G., Levine, S. E., Canzian, B., et al. 2003, AJ, 125, 984
- Osterman Meyer et al. (2009) Osterman Meyer, A., Miller, H. R., Marshall, K., et al. 2009, AJ, 138, 1902
- Osterman Meyer et al. (2008) —. 2008, AJ, 136, 1398
- Padovani & Giommi (1996) Padovani, P., & Giommi, P. 1996, MNRAS, 279, 526
- Pian et al. (2005) Pian, E., Falomo, R., & Treves, A. 2005, MNRAS, 361, 919
- Pian et al. (1999) Pian, E., Urry, C. M., Maraschi, L., et al. 1999, ApJ, 521, 112
- Qian et al. (2014) Qian, S.-J., Britzen, S., Witzel, A., et al. 2014, Research in Astronomy and Astrophysics, 14, 249
- Ramírez et al. (2004) Ramírez, A., de Diego, J. A., Dultzin-Hacyan, D., & González-Pérez, J. N. 2004, A&A, 421, 83
- Ruan et al. (2014) Ruan, J. J., Anderson, S. F., Dexter, J., & Agol, E. 2014, ArXiv e-prints, arXiv:1401.1211
- Shakura & Sunyaev (1973) Shakura, N. I., & Sunyaev, R. A. 1973, A&A, 24, 337
- Skrutskie et al. (2006) Skrutskie, M. F., Cutri, R. M., Stiening, R., et al. 2006, AJ, 131, 1163
- Stalin et al. (2006) Stalin, C. S., Gopal-Krishna, Sagar, R., et al. 2006, MNRAS, 366, 1337
- Trèvese & Vagnetti (2002) Trèvese, D., & Vagnetti, F. 2002, ApJ, 564, 624
- Urry & Padovani (1995) Urry, C. M., & Padovani, P. 1995, PASP, 107, 803
- Vagnetti et al. (2003) Vagnetti, F., Trevese, D., & Nesci, R. 2003, ApJ, 590, 123
- Villata et al. (2002) Villata, M., Raiteri, C. M., Kurtanidze, O. M., et al. 2002, A&A, 390, 407
- Villata et al. (2006) Villata, M., Raiteri, C. M., Balonek, T. J., et al. 2006, A&A, 453, 817
- Wehrle et al. (1998) Wehrle, A. E., Pian, E., Urry, C. M., et al. 1998, ApJ, 497, 178
- Wu et al. (2011) Wu, J., Zhou, X., Ma, J., & Jiang, Z. 2011, MNRAS, 418, 1640
- Zhang et al. (2015) Zhang, H., Chen, X., Böttcher, M., Guo, F., & Li, H. 2015, ApJ, 804, 58