Explaining key properties of lithiation in \ceTiO2-anatase Li-ion battery electrodes using phase-field modelling
Abstract
The improvement of Li-ion battery performance requires development of models that capture the essential physics and chemistry in Li-ion battery electrode materials. Phase-field modelling has recently been shown to have this ability, providing new opportunities to gain understanding of these complex systems. In this paper a novel electrochemical phase-field model is presented that captures the thermodynamic and kinetic properties of lithium-insertion in \ceTiO2-anatase, a well-known and intensively studied Li-ion battery electrode material. Using a linear combination of two regular solution models the two phase transitions during lithiation are described as lithiation of two separate lattices with different physical properties. Previous elaborate experimental work on lithiated anatase \ceTiO2 provides all parameters necessary for the phase-field simulations, giving the opportunity to gain fundamental insight in the lithiation of anatase and validate this phase-field model. The phase-field model captures the essential experimentally observed phenomena, rationalising the impact of C-rate, particle size, surface area, and the memory effect on the performance of anatase as a Li-ion battery electrode. Thereby a comprehensive physical picture of the lithiation of anatase \ceTiO2 is provided. The results of the simulations demonstrate that the performance of anatase is limited by the formation of the poor Li-ion diffusion in the \ceLi1TiO2 phase at the surface of the particles. Unlike other electrode materials, the kinetic limitations of individual anatase particles limit the performance of full electrodes. Hence, rather than improving the ionic and electronic network in electrodes, improving the performance of anatase \ceTiO2 electrodes requires preventing the formation of a blocking \ceLi1TiO2 phase at the surface of particles. Additionally, the qualitative agreement of the phase-field model, containing only parameters from literature, with a broad spectrum of experiments demonstrates the capabilities of phase-field models for understanding Li-ion electrode materials, and its promise for guiding the design of electrodes through a thorough understanding of material properties and their interactions.
I Introduction
High energy densities realised by Li-ion batteries have enabled mobile applications scaling from mobile phones, tablets, and laptops, up to electrical vehicles. The application of batteries in electric vehicles in particular has driven the demand for faster and more efficient electricity storage.
Different mechanisms may limit battery performance Deng (2015); Franco (2013); Zhang et al. (2015a): the electronic wiring in the electrodes, ionic transport through the electrolyte, the charge transfer reaction, and the solid state transport process. Which of these mechanisms is limiting depends on the applied current and the morphology of the electrodes Zhang et al. (2015a).
To understand the complex interplay of the processes in batteries and to enable improved battery design, various models have been developed Notten and Danilov (2014); Vo et al. (2015); Sethuraman et al. (2012); Landstorfer et al. (2011); Dargaville and Farrell (2013); Bazant (2013); Salvadori et al. (2015).
Using these models it is possible to design better battery management systems Notten and Danilov (2014), decrease charging times Vo et al. (2015), estimate the effect of side-reactions on performance Sethuraman et al. (2012), and study what limits the performance of a battery Landstorfer et al. (2011).
The challenge for models describing batteries is taking into account microscopic processes, such as phase transitions and interfaces, in combination with macroscopic phenomena such as many particle effects Li et al. (2014) and charge transport.
The non-equilibrium conditions in complete electrodes will lead to macroscopic gradients in diffusing species, and the associated potential gradients can change phase-transition kinetics, as has been demonstrated for \ceLiFePO4 Li et al. (2014). Even when a model is obtained which reasonably describes the processes, it often involves a number of unknown physical parameters, which require fitting to experimental data.
Although this may result in an appropriate model for conditions similar to those of the fitted experimental data, extrapolation to other operating conditions is uncertain Franco (2013), making accurate model validation under different conditions vital.
The introduction of phase-field modelling to the battery field Singh et al. (2008); Burch and Bazant (2009); Ferguson and Bazant (2012); Bazant (2013) has enabled accurate prediction of the phase transitions both in individual electrode particles and multi-particle systems Li et al. (2014) representing entire electrodes. This is computationally feasible because the phase-interface is taken implicitly into account Bazant (2013), making it unnecessary to evaluate the phase transition kinetics in every position in an electrode particle.
Using phase-field models for \ceLiFePO4 the observed decreasing miscibility and spinodal gap in nano-particles Wagemaker et al. (2011) has been explained Burch and Bazant (2009); Welland et al. (2015), the observed transition from a first order phase transition to a solid solution reaction at high overpotentials Zhang et al. (2014); Liu et al. (2014) has been predicted, and the transition from particle-by-particle to a concurrent mechanism was predicted Li et al. (2014) consistent with observations Zhang et al. (2015b). Recently a three-dimensional phase-field model has been presented for \ceLiFePO4 Welland et al. (2015), and crack formation and the effects this causes have also been incorporated O’Connor et al. (2016).
The phase-field method has also been used to describe the lithiation of graphite electrodes Ferguson and Bazant (2014); Guo et al. (2016), requiring the introduction of two first-order phase-transformations, which is relatively straight forward in a phase-field model, resulting in good agreement with experiments Ferguson and Bazant (2014).
These results demonstrate the success of phase-field modelling of battery electrodes, and anatase \ceTiO2 is another ideal candidate for applying phase-field modelling. It has been extensively studied for more than two decades, in which all parameters required for the phase-field model have been measured experimentally.
This will allow comparison of a parameter free phase-field model towards a broad range of experimental results available in literature.
Anatase \ceTiO2 is an attractive Li-ion battery electrode material, based on its cheap and abundant elements, high theoretical capacity of 335 mAh/g, small volume expansion during lithiation Lafont et al. (2010), and good electronic conductivity Singh et al. (2013a).
The TiO2-anatase lattice consists of stacked one dimensional zigzag chains of TiO6 octahedra sharing distorted edges, as shown in Figure 1. This stacking leads to empty zigzag channels with octahedral and tetrahedral interstitial sites that can accommodate lithium.
A typical voltage profile for lithiation of anatase is shown in Figure 1. At low Li-concentrations a solid solution is formed (region A), the length of which depends on the particle size Shen et al. (2014); Wagemaker et al. (2007); Sudant et al. (2005). Past the solid solution limit phase separation occurs, reflected by the plateau in region B, where half of the octahedral sites are filled to form the Li-titanate phase (Li0.5TiO2). This is followed by a pseudo-plateau (region C) during which the remaining octahedral sites are filled, forming Li1TiO2. Even though this phase transition usually does not show a voltage plateau, it is reported to occur via a phase separation mechanism Morgan and Watson (2011); Wagemaker et al. (2007).
In bulk anatase roughly 0.6 lithium per formula unit is reversibly inserted in most experiments Sudant et al. (2005); Wagemaker et al. (2007), leading to capacities of approximately 200 mAh/g. However, many parameters have been shown to affect the capacity drastically, including the preparation method Søndergaard et al. (2015), removing water from the anatase crystals before assembling the battery Madej et al. (2014a), the atmosphere during annealing Wang et al. (2011), the morphology of the crystals Sun et al. (2010), and the cut-off potential used during cycling Madej et al. (2014b). However, the most decisive factor appears to be the particle size Gentili et al. (2012); Sudant et al. (2005); Rai et al. (2013); Wagemaker et al. (2007). By nano-sizing anatase particles the \ceLi1TiO2-phase can be obtained at room temperature, realising the theoretical capacity of 335 mAh/g Lafont et al. (2010); Gentili et al. (2012).
For bulk samples complete lithiation via electrochemical experiments has been reported, but only when kinetic restrictions were removed, either by lithiating at 120∘C Zachau-Christiansen et al. (1988); Macklin and Neat (1992), or by allowing the anatase electrode to equilibrate during GITT measurements Shen et al. (2014); Sudant et al. (2005). Computational results also indicate that full lithiation is energetically favourable Belak et al. (2012); Morgan and Watson (2011), and attribute the fact that experimentally only small particles can fully lithiate to the slow Li-diffusion in the lithium rich phase (LixTiO2, x >0.5) Belak et al. (2012); Yildirim et al. (2011), which has also been measured by NMR spectroscopy Borghols et al. (2009a). It has been suggested that the slow Li-diffusion makes the \ceLi1TiO2-layer act as a blocking layer, preventing further lithiation Borghols et al. (2009a).
Despite the large amount of research regarding anatase, a comprehensive explanation for its complex behaviour during lithiation is absent.
In the present study a phase-field model free of fitted parameters for the lithiation of anatase \ceTiO2 is presented, based on microscopic parameters from the literature, describing both first-order phase-transitions.
The phase-field model for anatase consistently explains the experimentally observed phenomena, improving the understanding of \ceTiO2-anatase during Li-intercalation, and shedding light on the limitations and possibilities for anatase as an electrode material.
Considering that this is achieved with a model that only contains parameters from the literature, this provides important validation for the physical foundation of phase-field modelling, especially considering the complex behaviour of anatase during lithiation. Furthermore, our work strengthens the background of simulating materials that undergo multiple phase transitions during lithiation, which poses a considerable challenge for conventional computational models.
II Phase-field model for anatase
In this section the phase-field model for lithiation in anatase-\ceTiO2 is presented. For a thorough background on phase-field modelling the reader is referred to several comprehensive publications Bazant (2013); Smith and Bazant (2017). The most important macroscopic output variable for phase-field modelling of batteries is the measured cell voltage () given by:
| (1) |
where is the change in chemical potential, the electron charge, and is the total cell overpotential.
The change in chemical potential is the difference in free energy of lithium at the solid-electrolyte interfaces of the anode and cathode material. For the simulated Li-metal/anatase system is the change in free energy for the reaction:
| (2) |
Li-metal is defined as the reference electrode, and consequentially its chemical potential is defined as zero. Furthermore, the overpotential of the Li-metal electrode is assumed to be zero, which appears to be a good approximation given the small overpotentials experimentally observed for Li-metal electrodes Munichandraiah et al. (1994). These simplifications lead to a phase-field model in which only the lithiation of anatase needs to be taken into account to describe .
The two first-order phase-transitions occurring upon lithiation of anatase can be considered as two independent chemical reactions, since (locally) the two reactions cannot occur simultaneously, and can therefore be described by two independent lattices having their own free energy functional. The first lattice represents the reaction \ceTiO2 + 0.5 Li+ + e- ¡-¿ Li_0.5TiO2, and the second lattice represents the reaction \ceLi_0.5TiO2 + 0.5 Li+ + e- ¡-¿ Li1TiO2.
Similar to the phase-field model for graphite Smith et al. (2017) this requires the introduction of two parameters ( and ) that describe the Li-concentration in the first and second lattice, respectively.
In both lattices the Gibbs free energy () is described by a Cahn-Hilliard regular solution model Bazant (2013):
| (3) |
where is Boltzmann’s constant, the temperature in Kelvin, the normalised concentration in lattice (), the enthalpy of mixing, the reference potential versus. Li/\ceLi+, and the gradient penalty parameter.
The first term in Equation 3 describes the entropy change upon adding Li-ions () and removing Li-vacancies ().
The enthalpy of mixing () describes the interactions between Li-atoms in an intercalation material. Positive values for correspond to attractive forces between Li-atoms, favouring phase separation into the end member phase (a Li-rich and a Li-poor phase).
The -term represents the energy penalty for the existence of concentration gradients when phase-separation occurs, with larger values for leading to a wider interface region between Li-rich and Li-poor phases.
Large entropy and -terms in Equation 3 promote solid solution behaviour, while a large -term will promote phase-separation. Which term dominates, and thus determines the phase-behaviour of a material, not only depends on the values of the parameters, but also on C-rate, temperature, and particle size Bai et al. (2011); Borghols et al. (2009b); Zhang et al. (2014, 2015a).
The diffusional chemical potential () of lithium in anatase is given by the variational derivative of the free energy with respect to concentration Smith and Bazant (2017):
| (4) |
Using Equation 3 this gives:
| (5) |
From the diffusional chemical potential the flux of lithium () through the particle can be determined based on the gradient of the diffusional chemical potential () Bazant (2013):
| (6) |
where is the mobility and is the tracer diffusivity.
It is known that the lithium diffusion in \ceTiO2 anatase is dependent on the lithium concentration, but the effect of the Li-concentration on Li-diffusion is unclear. Papers with calculations show contradicting results, with some reporting a large Belak et al. (2012) or small Lunell et al. (1997) increase in activation energy for Li-diffusion with increasing Li-concentration, while others show a large Tielens et al. (2005) or small Yildirim et al. (2011) decrease in activation energy at higher Li-contents. Experiments by Sussman et al. Sussman et al. (2014) show a decrease in Li-diffusivity with increasing Li-content, although the magnitude of this effect strongly depends on the synthesis procedure.
The simplest approximation for the tracer diffusivity on a lattice is proportional to the vacancy concentration, , in order to account for site exclusion Bazant (2013); Ferguson and Bazant (2012) and for thermodynamic consistency with binary species mixing Nauman and He (2001), but we find that this model is not able to reproduce the general features of the experimental voltage profiles. On the other hand, ab initio calculations predict a much stronger concentration dependence, where the chemical diffusivity drops by many orders of magnitude between the \ceTiO2-, \ceLi_0.5TiO2- and \ceLi1TiO2-phases Belak et al. (2012), thus indicating stronger cooperative diffusion barriers. As a first approximation of such effects, we introduce a simple power-law correction:
| (7) |
where is the reference tracer diffusivity in lattice at . Despite the unphysical divergence at , the diffusivity effectively saturates at realistic values in our phase-field simulations, since the regular solution model only allows small, but finite, concentrations. Combining Equations 6 and 7, the flux of lithium is given by:
| (8) |
which is simply proportional to the vacancy concentration. The implied chemical diffusivity , is negative in the spinodal regions of thermodynamic instability, while capturing the strongly decreasing trend across the solid solution phases Belak et al. (2012), similar to the experiments of Sussman et al. Sussman et al. (2014). We find that this model is also capable of providing a good fit of the experimental voltage profiles.
Using Equation 5 and 8 the behaviour of lithium inside anatase particles can be described, but to determine the battery voltage and influx of lithium the charge-transfer reaction at the electrode-electrolyte interface must also be described. This can be done using the Butler-Volmer equation Smith and Bazant (2017):
| (9) |
where is the current density in lattice , the reaction rate constant per surface area of the particle, the reaction symmetry factor (assumed to be 0.5), the number of electrons participating in the reaction (one in this case), and the electronic charge.
The charge-transfer overpotential () is defined as: , where (the chemical potential of the reduced state of Li) is obtained from Equation 5, (the chemical potential of the oxidised state of Li) depends on the Li-concentration in the electrolyte () and is approximated using a dilute electrolyte model as: .
The activity of the oxidised state () is equal to , the activity of the electrons is taken to be unity. The activity of the reduced state () depends on the diffusional chemical potential () of lithium inside the particle: , and the activity of the transition state () depends on the concentration of lithium-vacancies Bai et al. (2011): . During constant current simulations the applied current () is known, thus can be calculated.
The charge-transfer overpotential given by Equation 9 describes the thermodynamic driving force for a lithium-ion to enter/leave the electrode particle. All the terms in Equation 9 depend on the diffusional chemical potential or concentration of lithium, i.e. the size of the charge-transfer overpotential is determined by the Li-concentration of the electrode and electrolyte near the electrode-electrolyte interface.
Using the equations given above, the diffusional chemical potential of Li in the particles (Equation 5), the Li-flow through the particle (Equation 8), and the Li-flow into the anatase particles (Equation 9) can be described. Using the appropriate set of boundary conditions this set of equations can be solved Zeng and Bazant (2014), ultimately giving the cell voltage (Equation 1), and the Li-concentration inside the anatase particles.
In contrast to the graphite phase-field model Ferguson and Bazant (2014); Guo et al. (2016), which directly couples the two phase transitions, the anatase model consists of two independent lattices. The reason for this are the very different physical properties of the first and second phase transition in anatase, while in graphite the only difference between the two phase transitions (relevant to the phase-field model) is the voltage.
To describe the two phase transitions in anatase different parameters are necessary, which can be implemented by introducing two independent lattices with different physical properties, schematically shown in Figure 2. At the start of the lithiation process the first phase transition will occur due to its higher intercalation potential, filling the first lattice with Li-ions. When the first lattice fills the charge-transfer overpotential will increase (lowering the voltage), because it gradually becomes harder to add more Li-ions. When the intercalation potential of the second lattice is reached lithiation of the second lattice becomes favourable, and the second phase transition will start.
There are no interaction terms between the two lattices, since the effect the first lattice has on the second is already incorporated by the different parameters that are used. In Table 1 all parameters and their values from literature are listed, as well as what each one is based on.
| Parameter | Value | Units | Based on |
| 1.82 | V | GITT experiments Shen et al. (2014); Sudant et al. (2005) | |
| 1.56 | V | Electrochemical experiments at 120∘C Zachau-Christiansen et al. (1988); Macklin and Neat (1992) | |
| cm2/sec | Electrochemical experiments Wang et al. (2007); Kim and Choi (2015); Lindstrom et al. (1997) | ||
| cm2/sec | Force-field molecular dynamics simulations Yildirim et al. (2011) | ||
| J/Li | DFT calculations Belak et al. (2012); Morgan and Watson (2011) | ||
| J/Li | DFT calculations Belak et al. (2012); Morgan and Watson (2011) | ||
| J/m | Phase diagram (see text) Wagemaker et al. (2007) | ||
| J/m | Phase diagram (see text) Wagemaker et al. (2007) | ||
| Li/m3 | Neutron diffraction Wagemaker et al. (2003) | ||
| A/m2 | NMR experiments Ganapathy et al. (2011), also see supporting info |
Normally, several physical parameters necessary for phase-field modelling are not available, either experimentally or computationally, and are therefore fitted by optimising the phase-field model towards experimental voltage profiles.
Intensive research towards lithiation of anatase \ceTiO2 during the last decades makes it possible to quantify all parameters necessary for the present phase-field model. Thus providing a unique opportunity to validate a phase-field model, using only parameters from the literature, with micro- and macroscopic observations.
The reference potentials and are based on literature data which are closest to equilibrium conditions at room temperature. is based on GITT measurements Shen et al. (2014); Sudant et al. (2005) performed at room temperature, but for the second phase transition equilibrium is not even reached during the reported GITT measurements. Therefore the value for is taken from experiments performed at 120∘C, in which the second plateau indicates that equilibrium was reached Zachau-Christiansen et al. (1988); Macklin and Neat (1992).
For anatase electrodes electrochemical experiments have reported diffusivities in the first lattice between and cm2/sec Lindstrom et al. (1997); Wang et al. (2007); Shin et al. (2012); Kim and Choi (2015); Kavan (2014); Wang et al. (2014); Sussman et al. (2014); Yang et al. (2015), and changes of 2 orders of magnitude during charging have been reported Sussman et al. (2014).
Furthermore, calculations on Li-diffusion in anatase also show strongly differing results Belak et al. (2012); Lunell et al. (1997); Tielens et al. (2005); Yildirim et al. (2011), and NMR experiments indicate that diffusion over the interface between the anatase and Li-titanate phases Wagemaker et al. (2001, 2002) is the limiting step. For the second lattice no experimental value for the diffusivity has been reported, but NMR experiments Borghols et al. (2009a) and calculations Belak et al. (2012); Yildirim et al. (2011) have shown that it is smaller than in the first lattice .
Given the large range of values in the literature for Li-diffusion in \ceTiO2 anatase several values from the literature were used for testing, after which the simulated voltage profiles were compared to experimental ones. The best agreement with experiments was obtained using a value of cm2/sec for , which has been reported by several experimental studies Wang et al. (2007); Kim and Choi (2015); Lindstrom et al. (1997). For a value of cm2/sec gave the best results, which is obtained from molecular dynamics simulations Yildirim et al. (2011).
Since it is impossible to experimentally measure the enthalpy of mixing the values for and are based on DFT calculations Belak et al. (2012); Morgan and Watson (2011), the values were determined by the difference between the convex hull and the configurational energies.
Values of and are based on the particle size at which two phase coexistence inside a particle no longer occurs Wagemaker et al. (2007). This means that for the radial 1D-model presented here the interface width () corresponds to half of the particle size Wagemaker et al. (2011), which gives interface widths of 25 and 6 nm for lattice 1 and 2, respectively. Using these interface widths can be calculated using Bazant (2013):
| (10) |
The maximum Li-concentration () is calculated based on the four Li-sites per unit cell upon complete lithiation and the volume Wagemaker et al. (2003) of the unit cell of \ceLi_0.5TiO2 divided over the two lattices. There is a small volume change (3%) upon lithiation from \ceTiO2 to \ceLi_0.5TiO2, but given that the volume differs by just 0.1% between \ceLi_0.5TiO2 and \ceLi1TiO2, the volume of \ceLi_0.5TiO2 is the best approximation over the range of possible Li-concentrations.
The equilibrium charge transfer constant () is typically not known because it is very hard to experimentally distinguish the Li reaction between electrolyte and electrode from other processes occurring simultaneously. However, using NMR this has been shown to be possible by Ganapathy et al. Ganapathy et al. (2011), reporting for the \ceLi_0.5TiO2 phase, which is at present assumed to be representative for both lattices.
Please note that physically the second phase transformation can only occur after the first phase transformation has happened (locally), and although this is not formally implemented in the model the 0.26 V lower insertion potential satisfies this condition during the simulations.
To keep the model simple all properties of anatase were assumed to be isotropic, a reasonable assumption given the 3D-diffusion pathway Yildirim et al. (2011) and small changes in lattice parameters upon lithiation Lafont et al. (2010).
During lithiation of anatase \ceTiO2 the interfaces with the Li-rich phase are predicted to occur along strain invariant planes Belak et al. (2012). For this reason it was assumed that the role of strain and of stress assisted diffusion can be neglected in the present 1D-simulations.
The simulations were performed using a modified version of the publicly available MPET code
Smith (2017), in which the coupled differential equations are solved using the DAE tools package Nikolić (2016). A 1D-model along the radial direction of the particles is used for the simulations, and unless stated otherwise simulations were performed on a single particle with a radius of 20 nm., a C-rate of 0.5C, a temperature of 298 K, and a cut-off voltage of 1 V vs. Li/Li+. For the single particle simulations the Li-concentration in the electrolyte was assumed to be constant, in multi-particle simulations the dilute electrolyte model as implemented in the MPET code Smith and Bazant (2017) was used to describe the Li-concentration in the electrolyte.
III Results
The results of the phase-field model for lithiation of anatase \ceTiO2 are compared to a broad spectrum of experimental results available in literature. The aim here is qualitative validation of the phase-field model and understanding of the physical processes that determine the performance of anatase electrodes. A qualitative validation rather than a quantitative validation is motivated by the many experimental parameters that affect the performance of anatase electrodes, resulting in a wide distribution of performances, even for equivalent electrochemical conditions Søndergaard et al. (2015).
III.1 Impact of lithiation rate
Similar to other electrode materials the (dis)charge rate, expressed in the C-rate (a 2C rate corresponds to (dis)charge of the full theoretical battery capacity in 1/2 hour, 1C in 1 hour, 0.5C in 2 hours, etc.) has a large impact on the voltage profile of anatase electrodes. Typically the capacity drops by approximately 25% when going from cycling at 0.5C to 1C Yang et al. (2015), and at higher C-rates a significant drop of the plateau voltage is detected Kim et al. (2010).

The drop in capacity and voltage with increasing lithiation rate are both consistently reflected in the simulated voltage profiles for a single anatase particle with a radius of 20 nm shown in Figure 3a.
At 5C the simulation leads to a maximum composition of \ceLi_0.45TiO2, increasing to \ceLi_0.7TiO2 at 0.5C, and at 0.01C the anatase particle is almost completely lithiated.
With increasing lithiation rate the increasing charge-transfer overpotential results in a voltage drop in Figure 3a, driven by limited Li transport away from the surface.
The significant decrease in voltage upon increasing the current from 0.01C to 0.1C indicates poor Li-ion kinetics in anatase, in particular considering the small particle radius of 20 nm. Generally, 0.1C results in close to equilibrium conditions in most nano-structured electrode materials, whereas in anatase \ceTiO2 Li-ion kinetics still restricts the capacity at this rate.
The large voltage drop at high C-rates for the second voltage plateau indicates that the formation of the \ceLi1TiO2 phase limits the charge transport away from the surface, thus increasing the charge-transfer overpotential. An estimate for the time it takes a Li-ion to reach the center of the particle can be obtained by calculating the characteristic diffusion time Bruce et al. (2008), , defined as:
| (11) |
where is the particle radius and the diffusion constant.
For a particle with a radius of 20 nm, the characteristic time for diffusion in the \ceLi_0.5TiO2 and \ceLi1TiO2 are approximately and seconds, respectively.
For the first voltage plateau, the phase transition towards \ceLi_0.5TiO2, this roughly corresponds to 0.1C. Therefore, at this rate the entire voltage plateau associated with the first phase transition should be observed, consistent with Figure 3a.
For the second voltage plateau, the phase transition towards \ceLi1TiO2, the characteristic time roughly corresponds to 0.01C, consistently reflected by the complete appearance of the second voltage plateau at this C-rate in Figure 3a. At time-scales shorter than the lithium ions are unable to reach the centre of the particle within the given time, i.e. kinetic limitations will restrict the capacity and decrease the cell voltage, as visible at higher C-rates in Figure 3a.
This is confirmed by the Li-ion concentration profiles shown in Figure 3b, in which at 0.01C most of the particle is transformed to the \ceLi1TiO2-phase. At 0.5C only a thin layer at the surface approaches the maximum composition \ceLi1TiO2, and the inner 10 nm is only transformed to the \ceLi_0.5TiO2-phase. At 5C this effect is augmented, with a large part of the particle having a Li-concentration below , and only near the surface the Li-concentration exceeds .
For experimental electrochemical lithiation at room temperature only the onset of the second voltage plateau is observed, as consistently predicted by the simulation at 0.5C in Figure 3a. Raising the temperature to 120 ∘C will significantly enhance Li-diffusion, largely lifting the diffusional limitations of the second lattice, resulting in a clear experimental observation of the second voltage plateau at 120 ∘C Zachau-Christiansen et al. (1988); Macklin and Neat (1992).
The simulation at a very slow lithiation rate, 0.01C, predicts that particles with a 20 nm. radius can also be fully lithiated at room temperature.
Although no experimental evidence showing this appears present (to the best of our knowledge), GITT measurements on particles with a diameter of 130 nm have been shown to reach full lithiation Shen et al. (2014).
The increasing voltage at 0.01C is caused by simulating only a single particle. For a single particle the voltage follows the spinodal potential, giving an upwards slope in the voltage profile Orvananos et al. (2015). When multiple particles are present interparticle phase-separation can occur, which smooths the voltage curve Ferguson and Bazant (2014); Orvananos et al. (2015).
As demonstrated in the supporting information (Figure S1) the upward tilt disappears when the simulations are performed on multiple particles.
In order to gain understanding of the rate limiting kinetic mechanism in anatase \ceTiO2 electrodes, multi-particle simulations were performed. A 50 m porous electrode was separated into five volumes connected in series reflecting different depths inside the electrode, and each volume contained five particles with a 20(2) nm radius.
The chosen rate is 2C, since at this rate the performance of the material already results in a significant decrease in the capacity and voltage, as shown in Figure 3.
The results of the multi-particle simulations in Figure 4 demonstrate that the lithiation process proceeds concurrently at any given depth of the electrode. All particles are transforming simultaneously, which implies that the Li-ion diffusion in a single anatase grain is rate limiting, even when the particles are nano sized.
In an actual electrode the consequence is that all grains are actively participating in delivering the current, thus electrode performance can be improved significantly by increasing the Li-diffusivity in the anatase lattice.
For comparison, in the simulation shown in Figure 4 the typical diffusion time () through the electrolyte is 10 seconds (using an ambipolar diffusivity of cm2/sec), three orders of magnitude below the inside the particles.
Furthermore, Singh et al. Singh et al. (2013a) have shown that \ceTiO2 anatase without electron conducting additives has excellent cycling behaviour. Thus electrode performance of \ceTiO2 anatase can primarily be improved by increasing the Li-diffusivity in the anatase lattice, and only slightly by enhancing the ionic and electronic wiring.
This behaviour differs from other electrode materials, such as \ceLiFePO4, \ceLi4Ti5O12, and \ceLiCoO2, where it has been shown that for full electrodes the ionic and electronic wiring dominate the internal resistance from small to large (dis)charge rates Liu et al. (2016); Strobridge et al. (2015); Li et al. (2015); Singh et al. (2013b); Kim et al. (2013).
Interestingly, in \ceLiFePO4 the increasing overpotential when increasing the C-rate widens the interface between the coexisting phases, at some critical rate leading to a solid-solution reaction as predicted by phase-field modelling Bai et al. (2011) and observed experimentally Zhang et al. (2014, 2015b); Liu et al. (2014). In anatase \ceTiO2 the phase interface also widens when increasing the C-rate; however, even at large C-rates the \ceLi1TiO2 phase forms at the particle surface, because of the poor Li-ion diffusivity. Thus the model predicts that anatase \ceTiO2 will undergo phase separation regardless of the imposed current.
III.2 Impact of Li-diffusion coefficient
The impact of the C-rate on the capacity and voltage for anatase \ceTiO2 electrodes reveals that the Li-ion diffusivity in the anatase lattice is the key limiting factor. Experimentally the Li-diffusivity has been increased by annealing in argon Wang et al. (2011), by hydrogen treatment Shin et al. (2012), and by \ceTi^3+ doping Ren et al. (2014), which all increase the amount of oxygen vacancies in \ceTiO2. Impedance measurements have shown that this can increase the Li-diffusivity by one order of magnitude Shin et al. (2012).
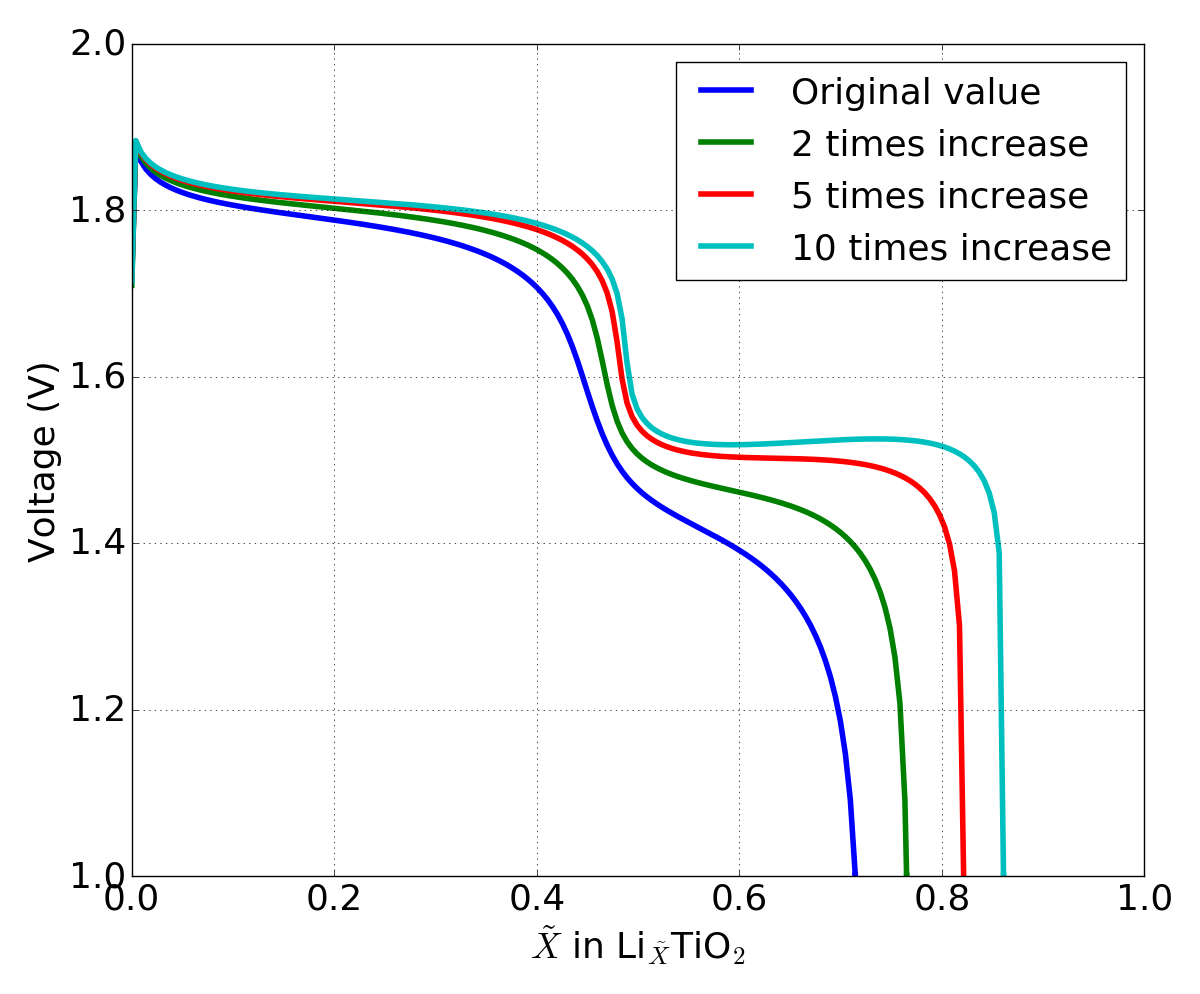
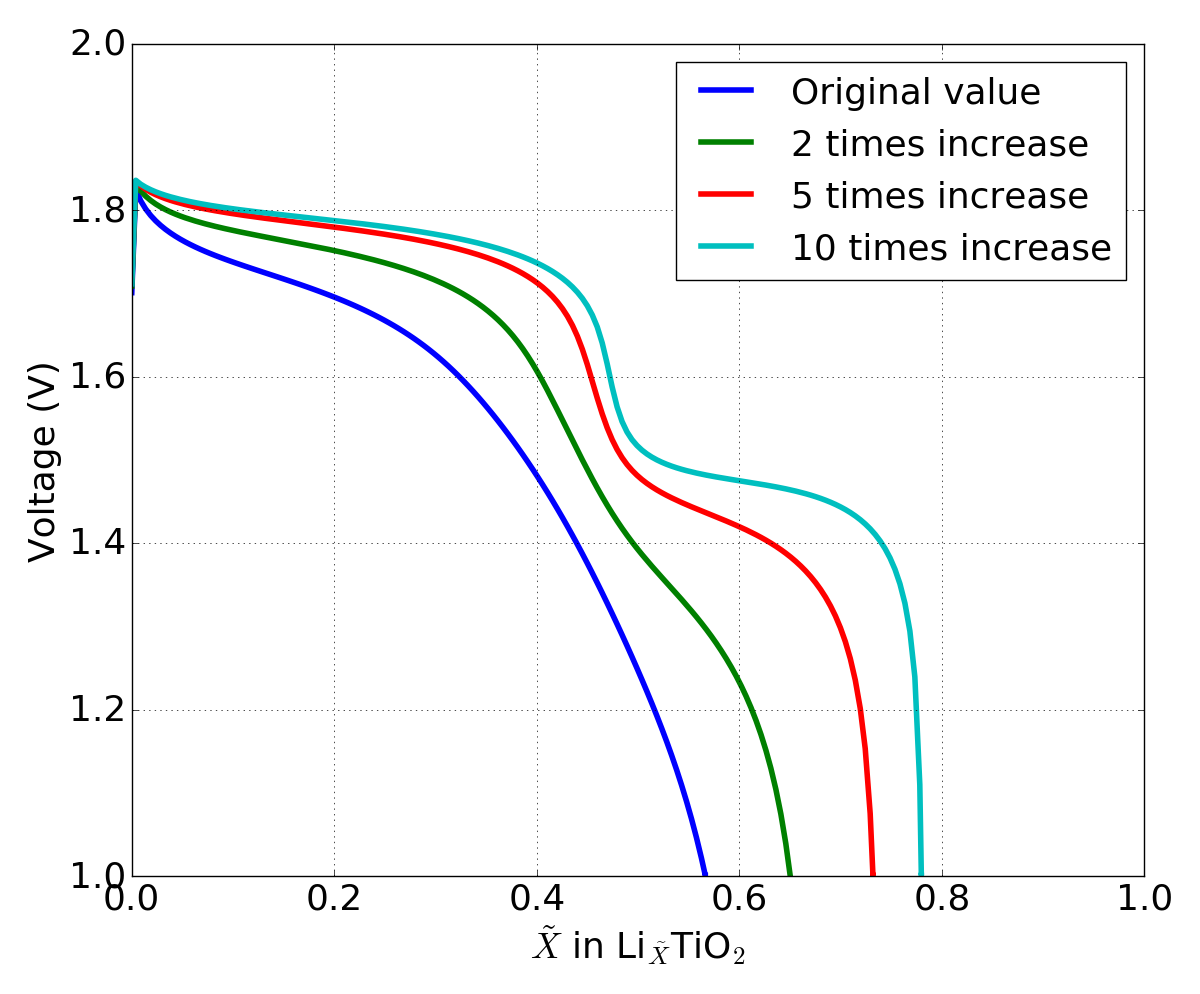
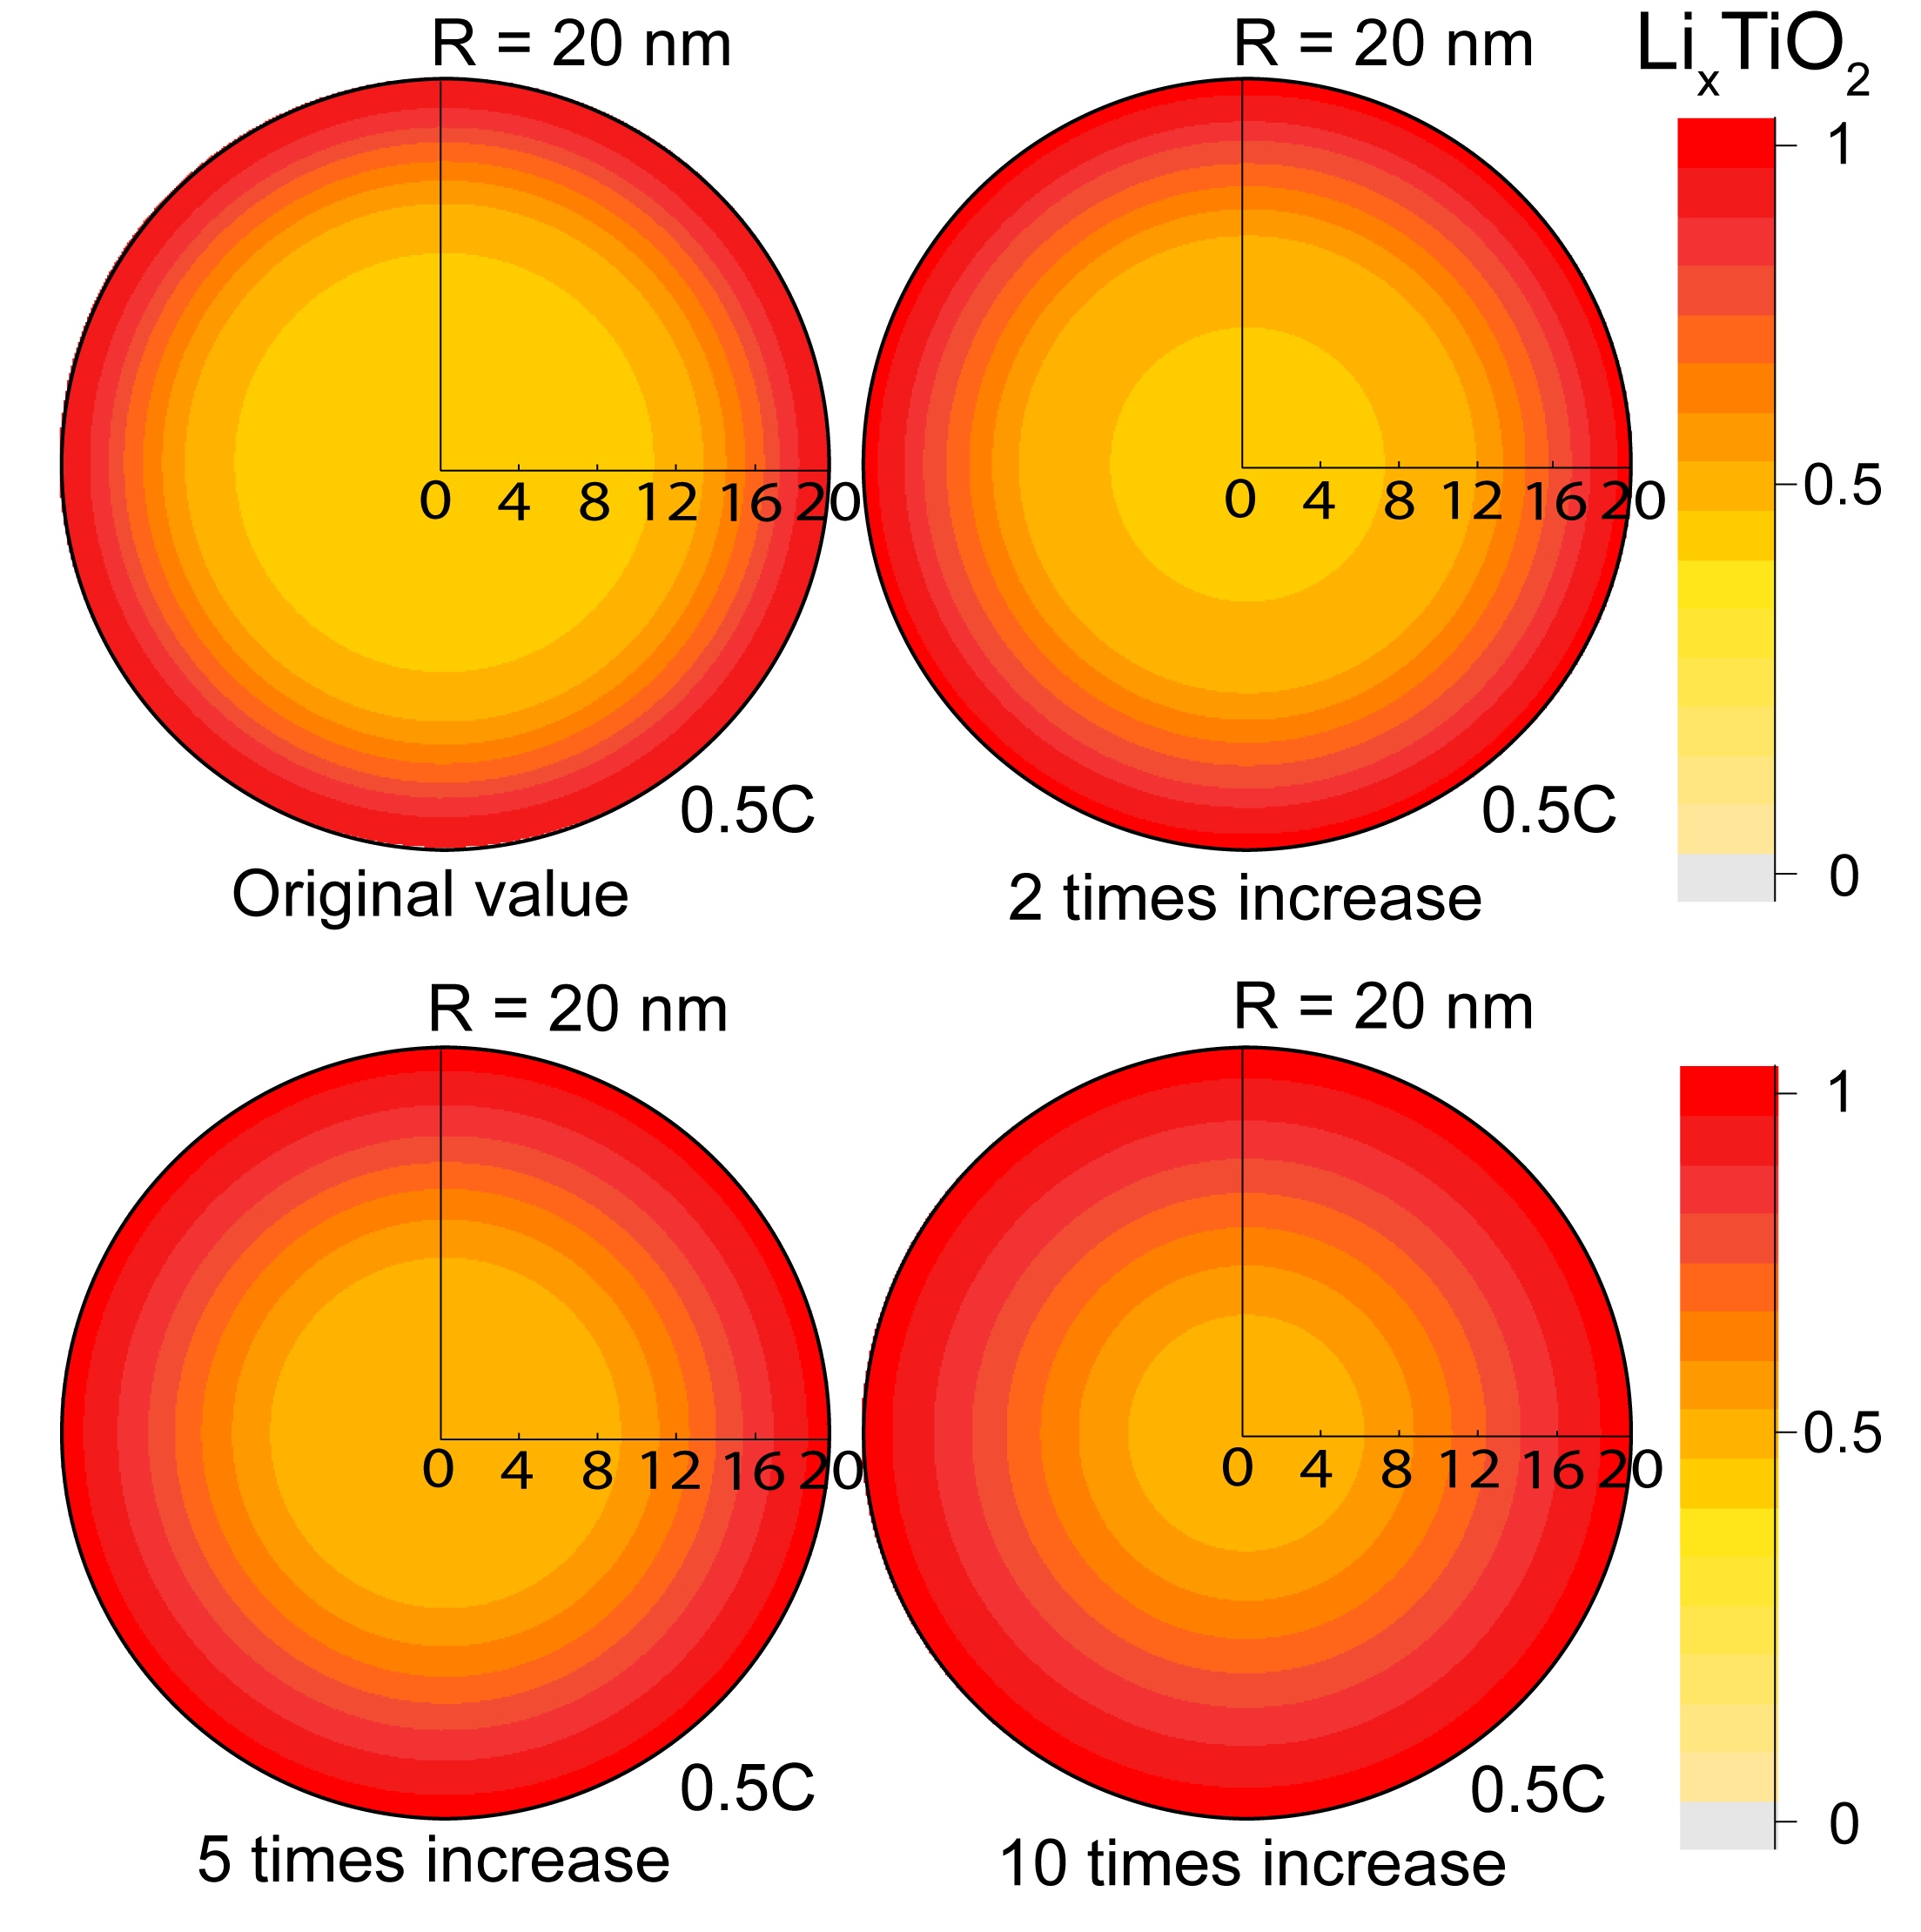
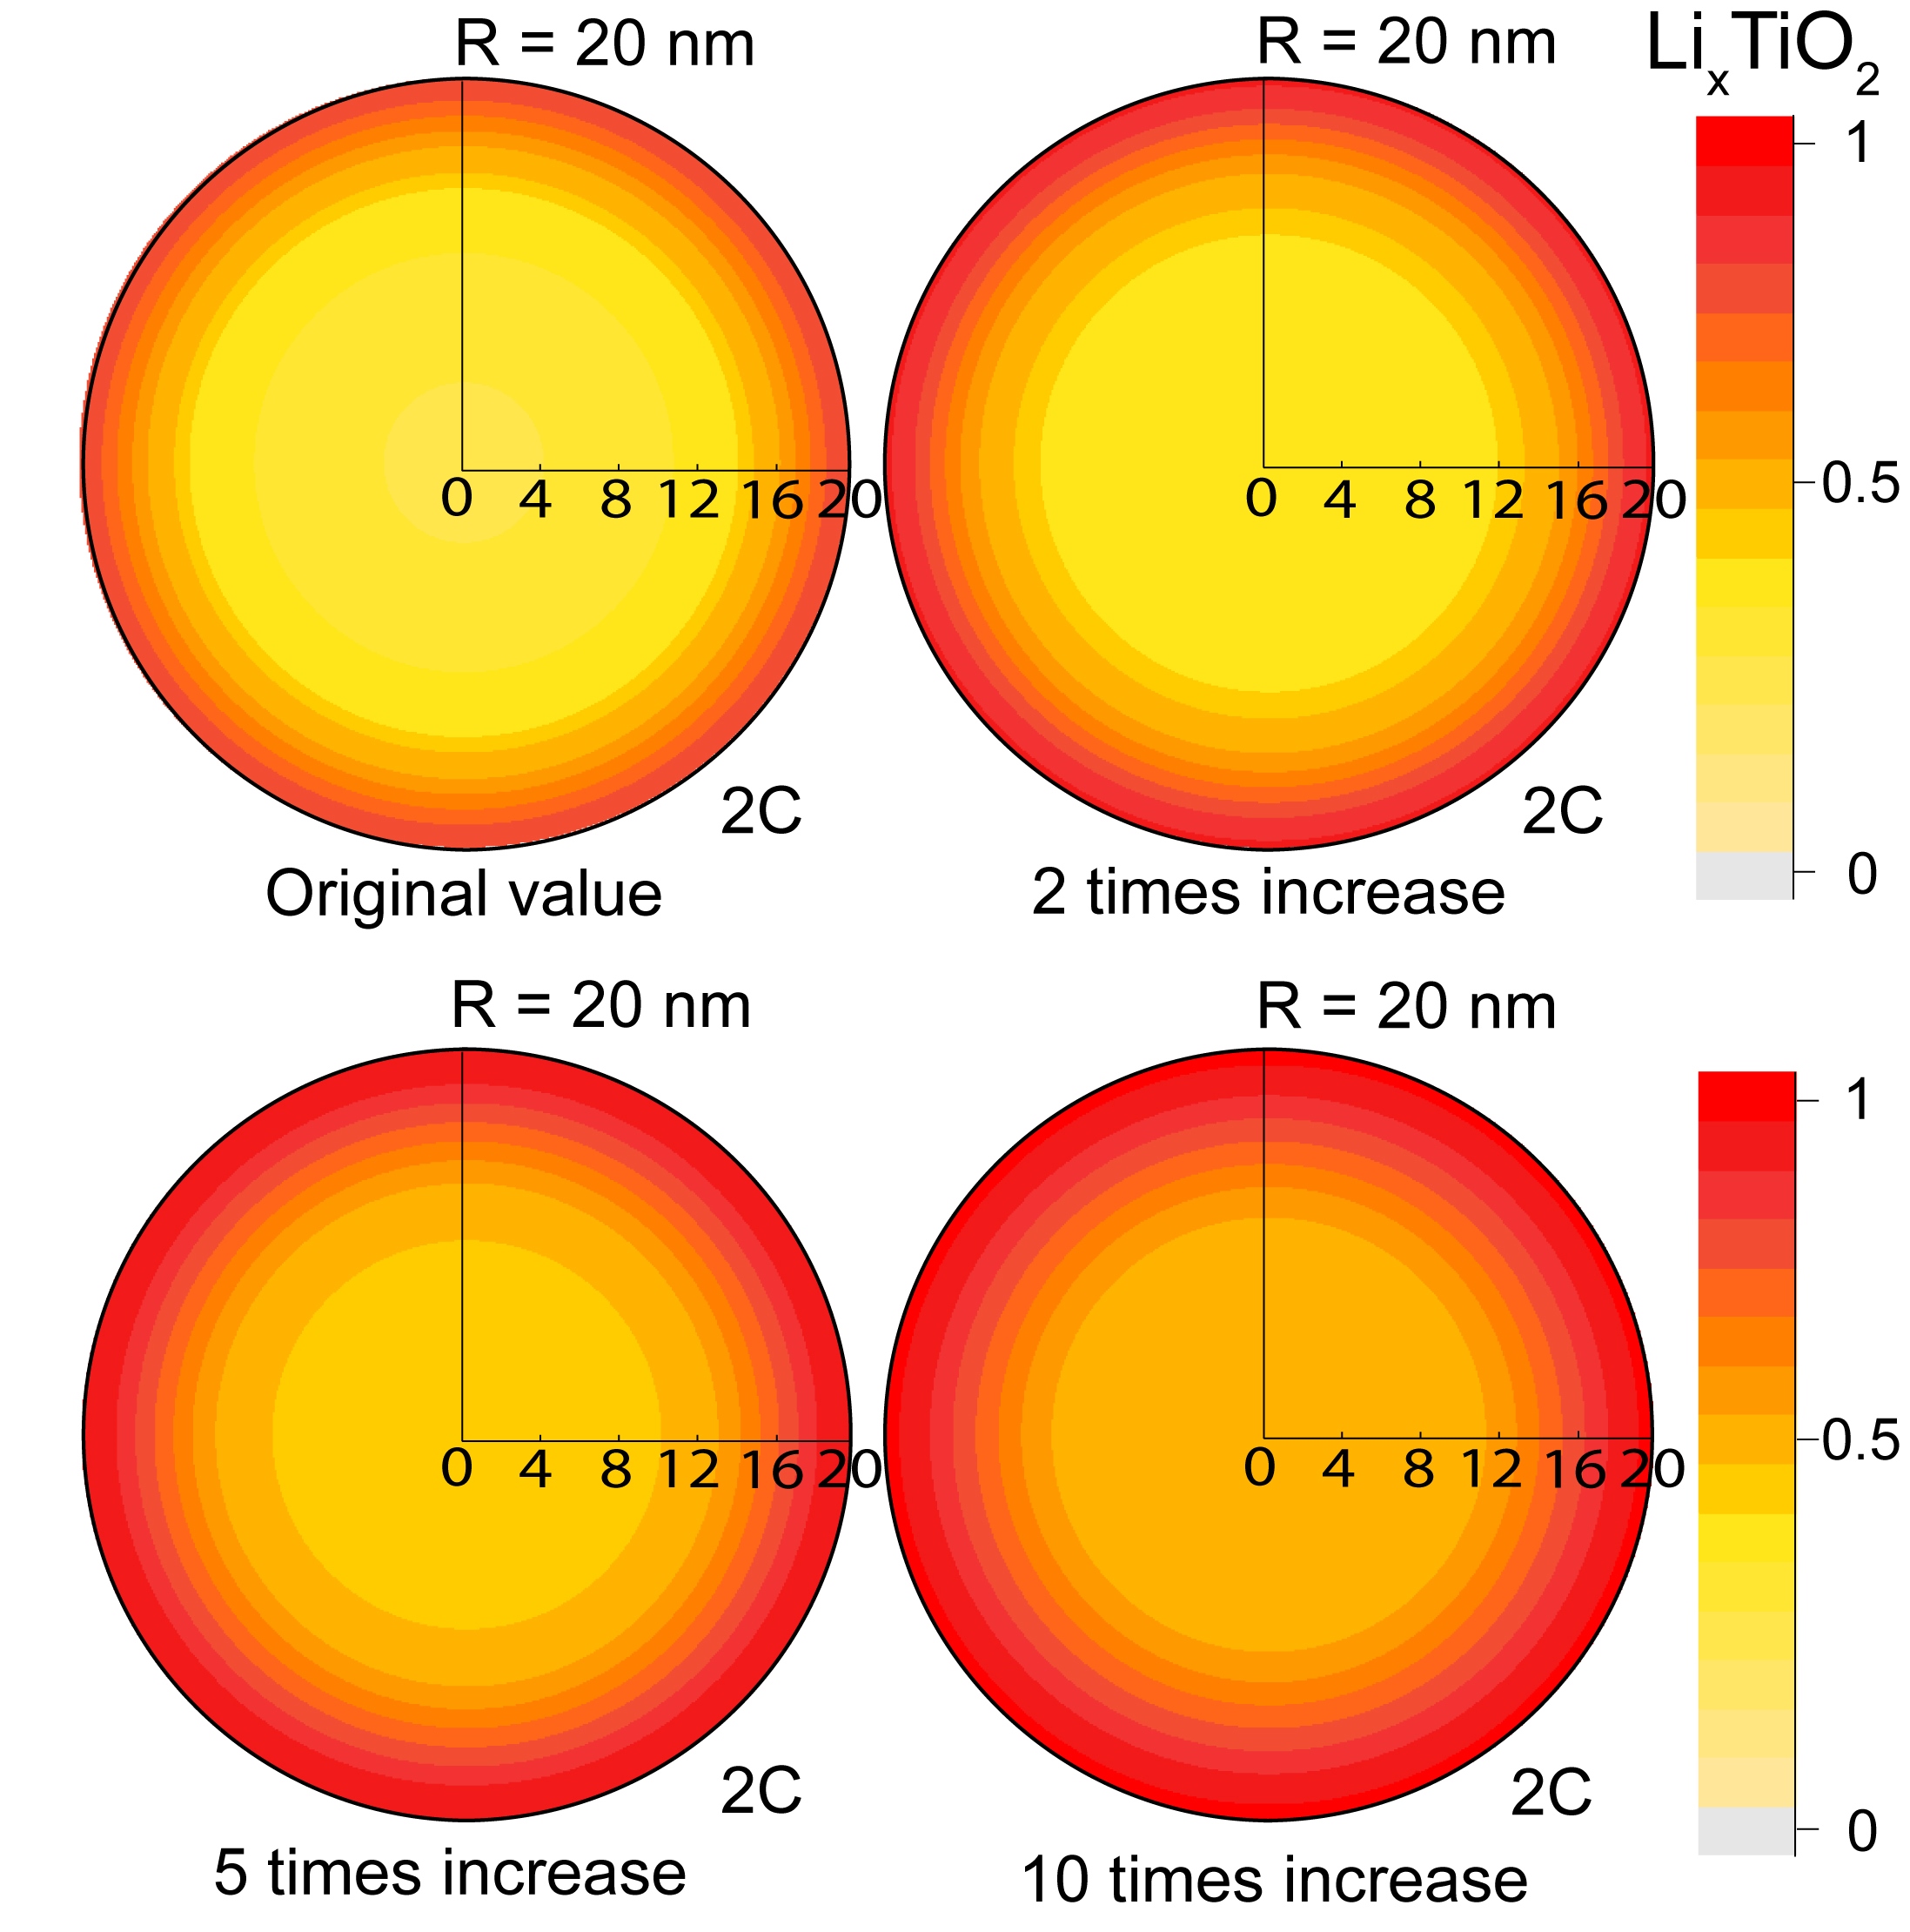
To capture the effects of a higher Li-diffusivity simulations were performed at 0.5C and 2C, where the Li-diffusion in both lattices is increased by a factor of 2, 5 and 10 compared to the values given in Table 1.
As should be anticipated this results in larger capacities and higher voltages with increasing diffusivity, as shown in Figure 5, consistent with experimental observations Shin et al. (2012); Wang et al. (2011); Ren et al. (2014).
For the lithium concentrations in the particle the higher diffusivity results in an extension of the \ceLi1TiO2 phase from the surface of the particle. At 0.5C the inside of the particle transforms completely to the \ceLi_0.5TiO2 phase, even for the original diffusivity. While at 2C an increase of the diffusivity by a factor of 5 is necessary to transform the inside of the particle to the \ceLi_0.5TiO2 phase.
These results confirm that increasing the diffusivity is a promising way to increase the capacity of anatase electrodes, especially when aiming at high (dis)charge rates.
III.3 Impact of surface area
The simulations shown in Figure 3 and 5 predict large charge-transfer overpotentials during the lithiation of anatase particles. These large overpotentials are caused by a high Li-concentration near the surface of anatase particles, making it hard for Li-ions to enter into the anatase particles.
A reduction in the surface Li-concentration can be achieved by increasing the surface area, which will lead to smaller charge-transfer overpotentials. An additional advantage is that a larger surface areas also lowers the current density, which further decreases the charge-transfer overpotential.
This leads to larger capacities, as has been demonstrated by various experimental studies on high surface area anatase particles Shin et al. (2011); Madej et al. (2015, 2014c).
To capture the surface area effect simulations were performed on a spherical and a cylindrical particle (infinitely long, i.e. neglecting the top and bottom surface of the cylinder). The spherical particle has a surface to volume ratio of , whereas the cylindrical particle has a smaller surface to volume ratio of .

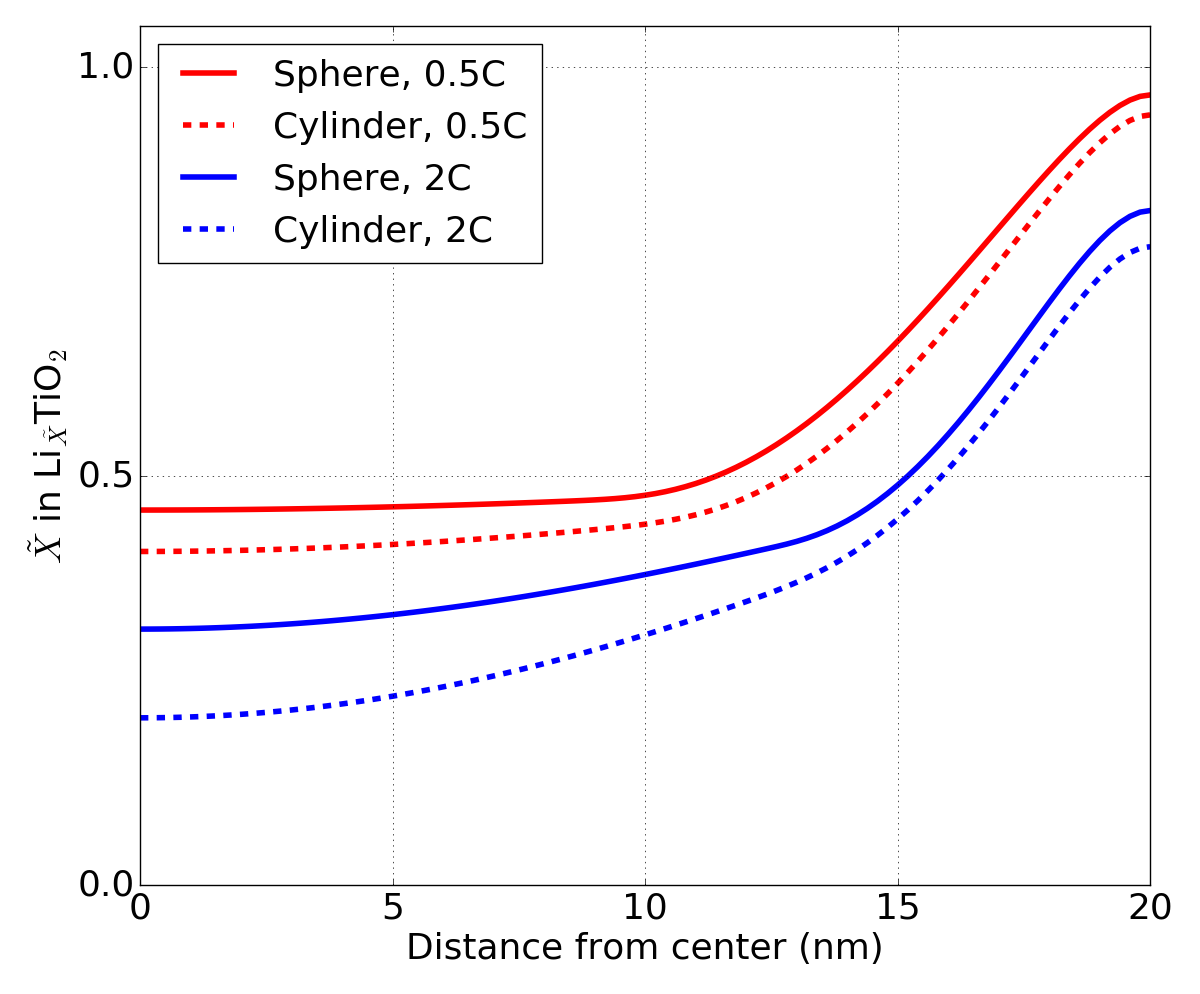
The concentration profiles in Figure 6b show that when the cut-off voltage is reached the Li-concentration near the surface is comparable in the spherical and cylindrical particle. However, the larger surface area of the spherical particle allows for a larger Li-ion flux into the anatase \ceTiO2 particle, resulting in a final Li-fraction approximately 20% larger compared to the cylindrical particle.
As shown in Figure 6a, at 0.5C relatively small differences for the first voltage plateau are predicted, the difference in capacity being primarily caused by the second lattice. This is because the slower diffusion in the second phase leads to high Li-concentrations near the surface more quickly, and thus high charge-transfer overpotentials at an earlier stage.
Increasing the C-rate to 2C significantly augments this effect, raising the difference in charge-transfer overpotential between the spherical and cylindrical particle, although the decrease in final Li-composition is similar when compared to 0.5C.
Experimentally similar observations are reported upon increasing the surface area Madej et al. (2015, 2014c); Shin et al. (2011).
However, higher surface areas are usually achieved by reducing the particle size Shin et al. (2011); Madej et al. (2015), which has a similar impact on the voltage profiles, as shown in Figure 7 and discussed below, making it hard to distinguish between the effects of nano-sizing and particle shape.
III.4 Impact of particle size
When Li-ion diffusion limits the electrode performance, decreasing the diffusion distance through the electrode material by particle size reduction is a well-established strategy to reach improved rate performance.
Smaller particles increase the surface to volume ratio, which has been shown to be beneficial in the prior section.
Additionally, particle size reduction has been shown to change the thermodynamics by increasing the solubility limits, which in small particles can even lead to suppression of phase separation, as shown for anatase \ceTiO2 Wagemaker et al. (2007, 2009) and \ceLiFePO4 Burch and Bazant (2009); Wagemaker et al. (2011).
A solid solution reaction can be expected to enhance Li-ion kinetics, in anatase specifically by suppressing the phase transition towards \ceLi1TiO2 at the particle surface, thereby promoting Li-ion transport and resulting in higher voltages and larger capacities at high C-rates.
Indeed for anatase \ceTiO2 particle size reduction has been shown to improve performance drastically, for instance resulting in complete lithiation of 7 nm particles at C/20 Lafont et al. (2010), whereas large particles cannot practically be lithiated to compositions exceeding \ceLi0.6TiO2 Wagemaker et al. (2007); Gentili et al. (2012).
Consistently, phase-field simulations for different particle sizes, shown in Figure 7, predict that decreasing the particle size diminishes kinetic limitations, resulting in nearly complete lithiation of 5 nm radius particles at 0.5C.
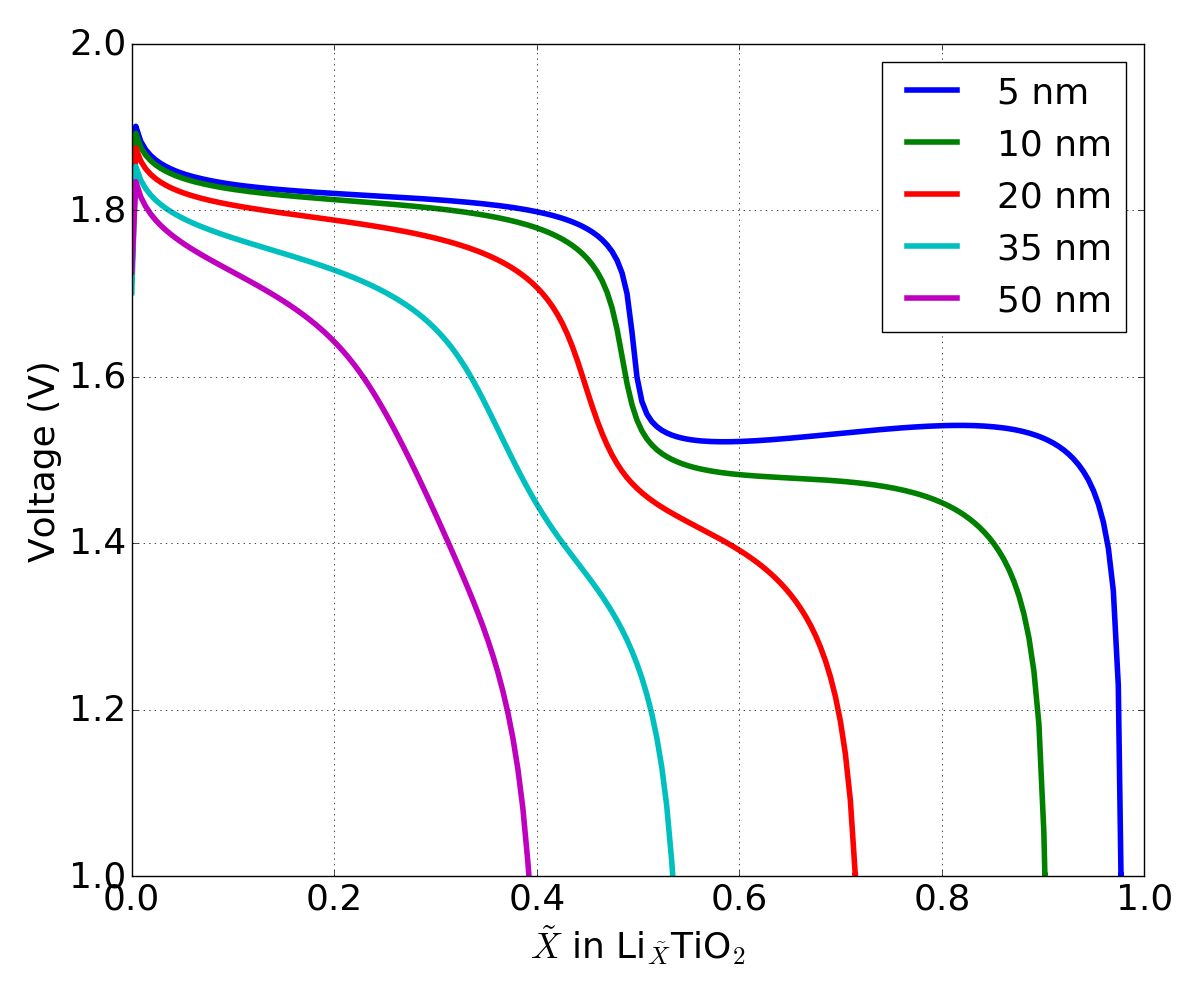
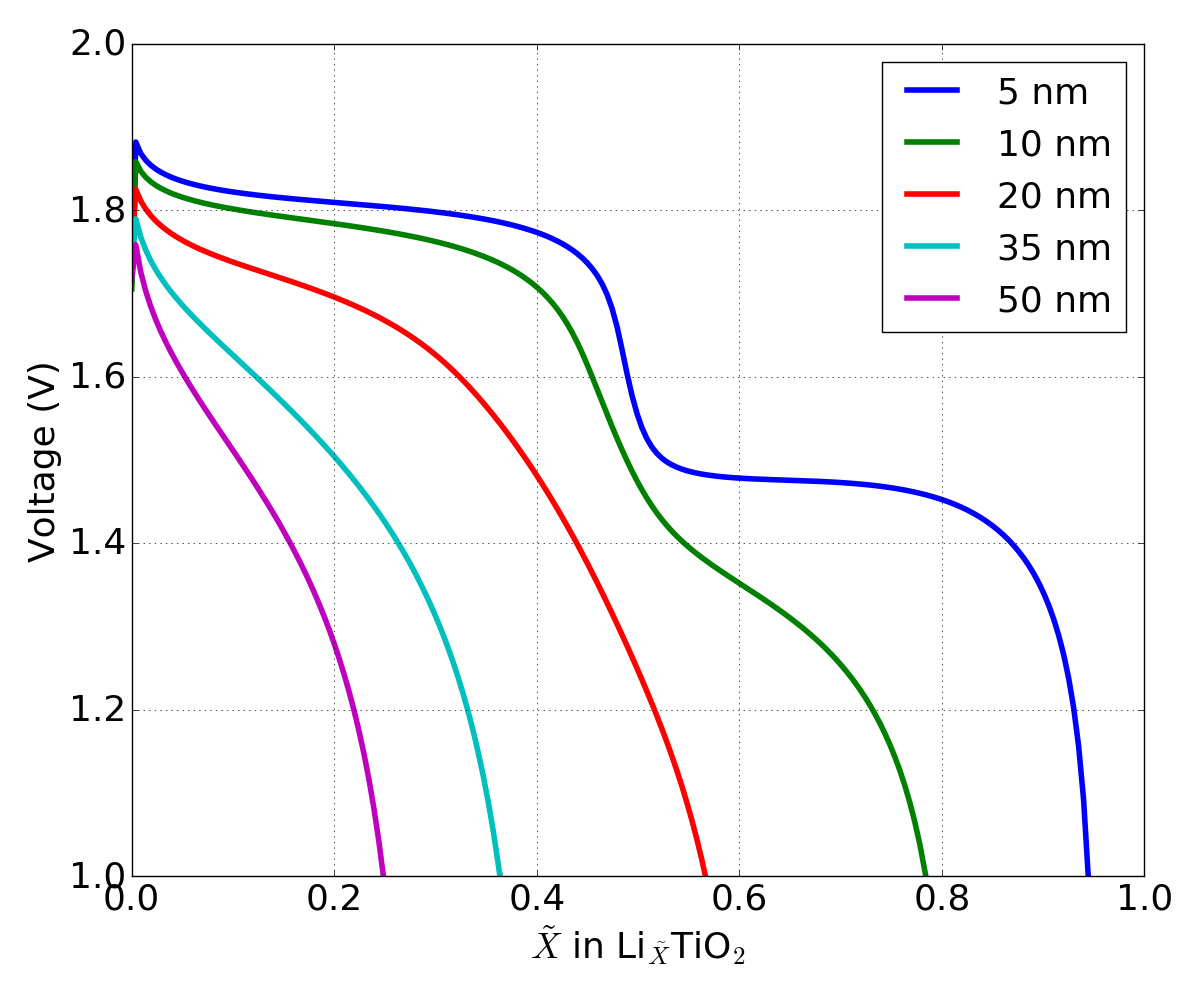
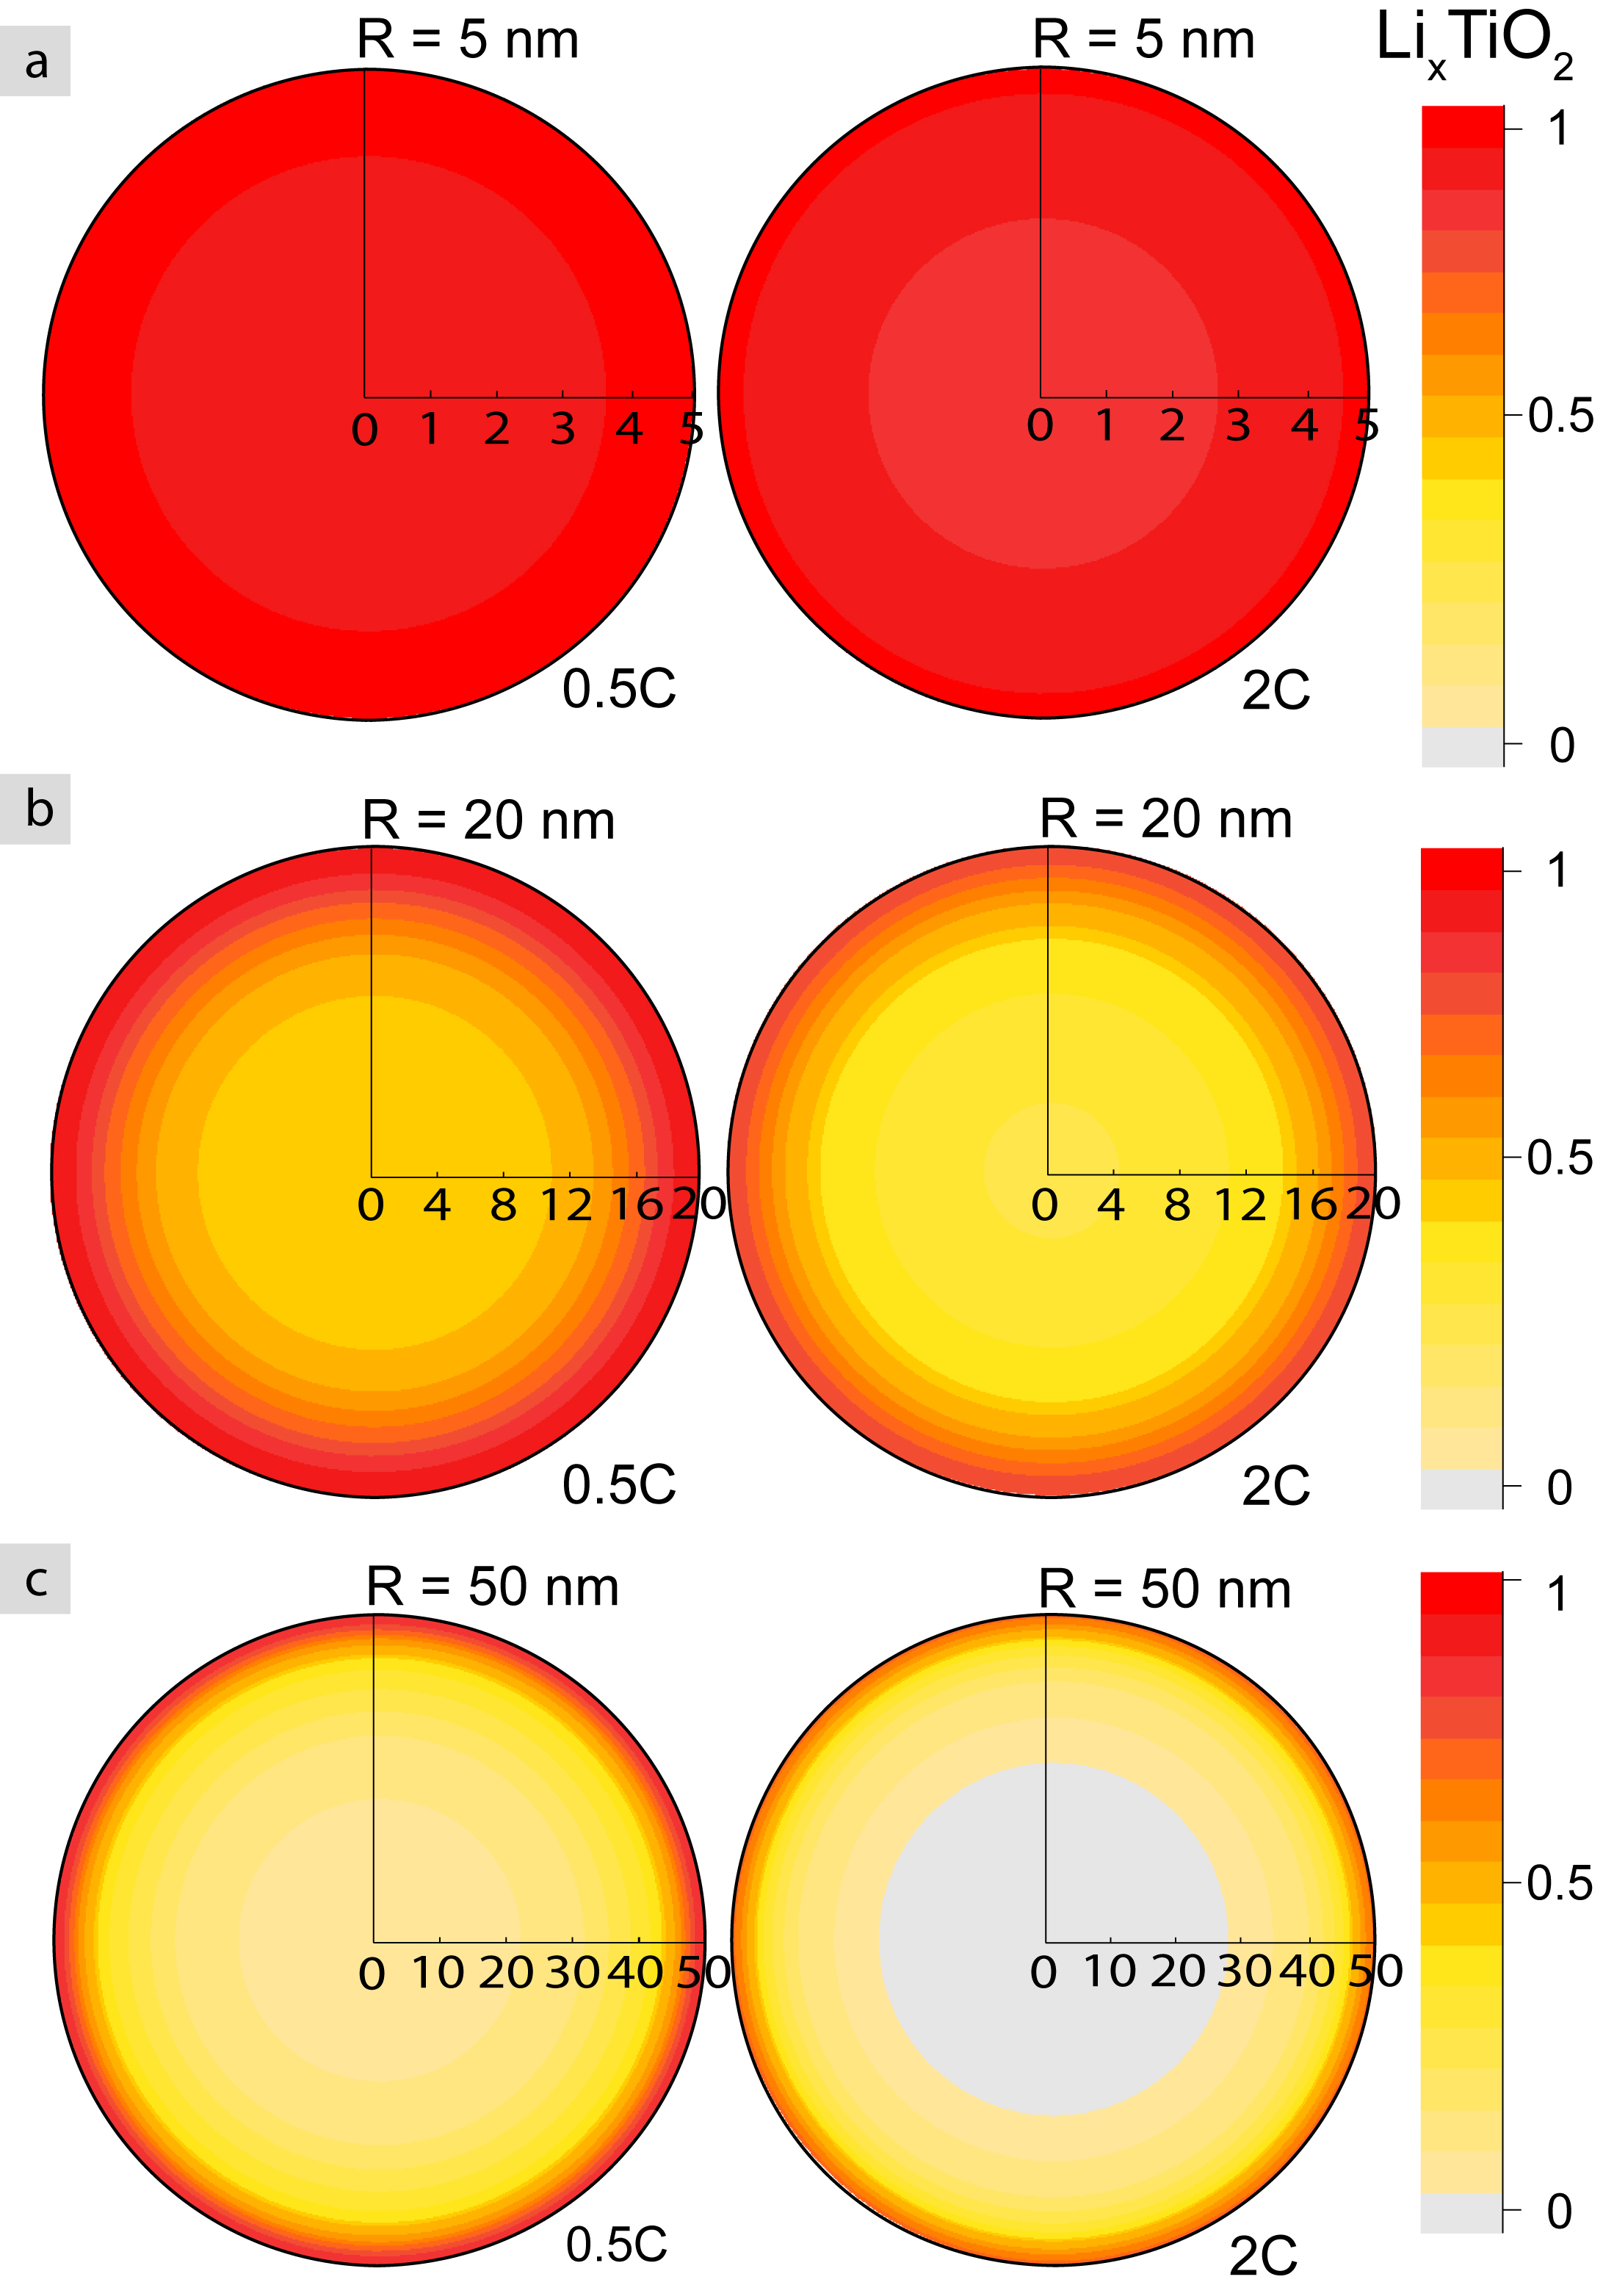
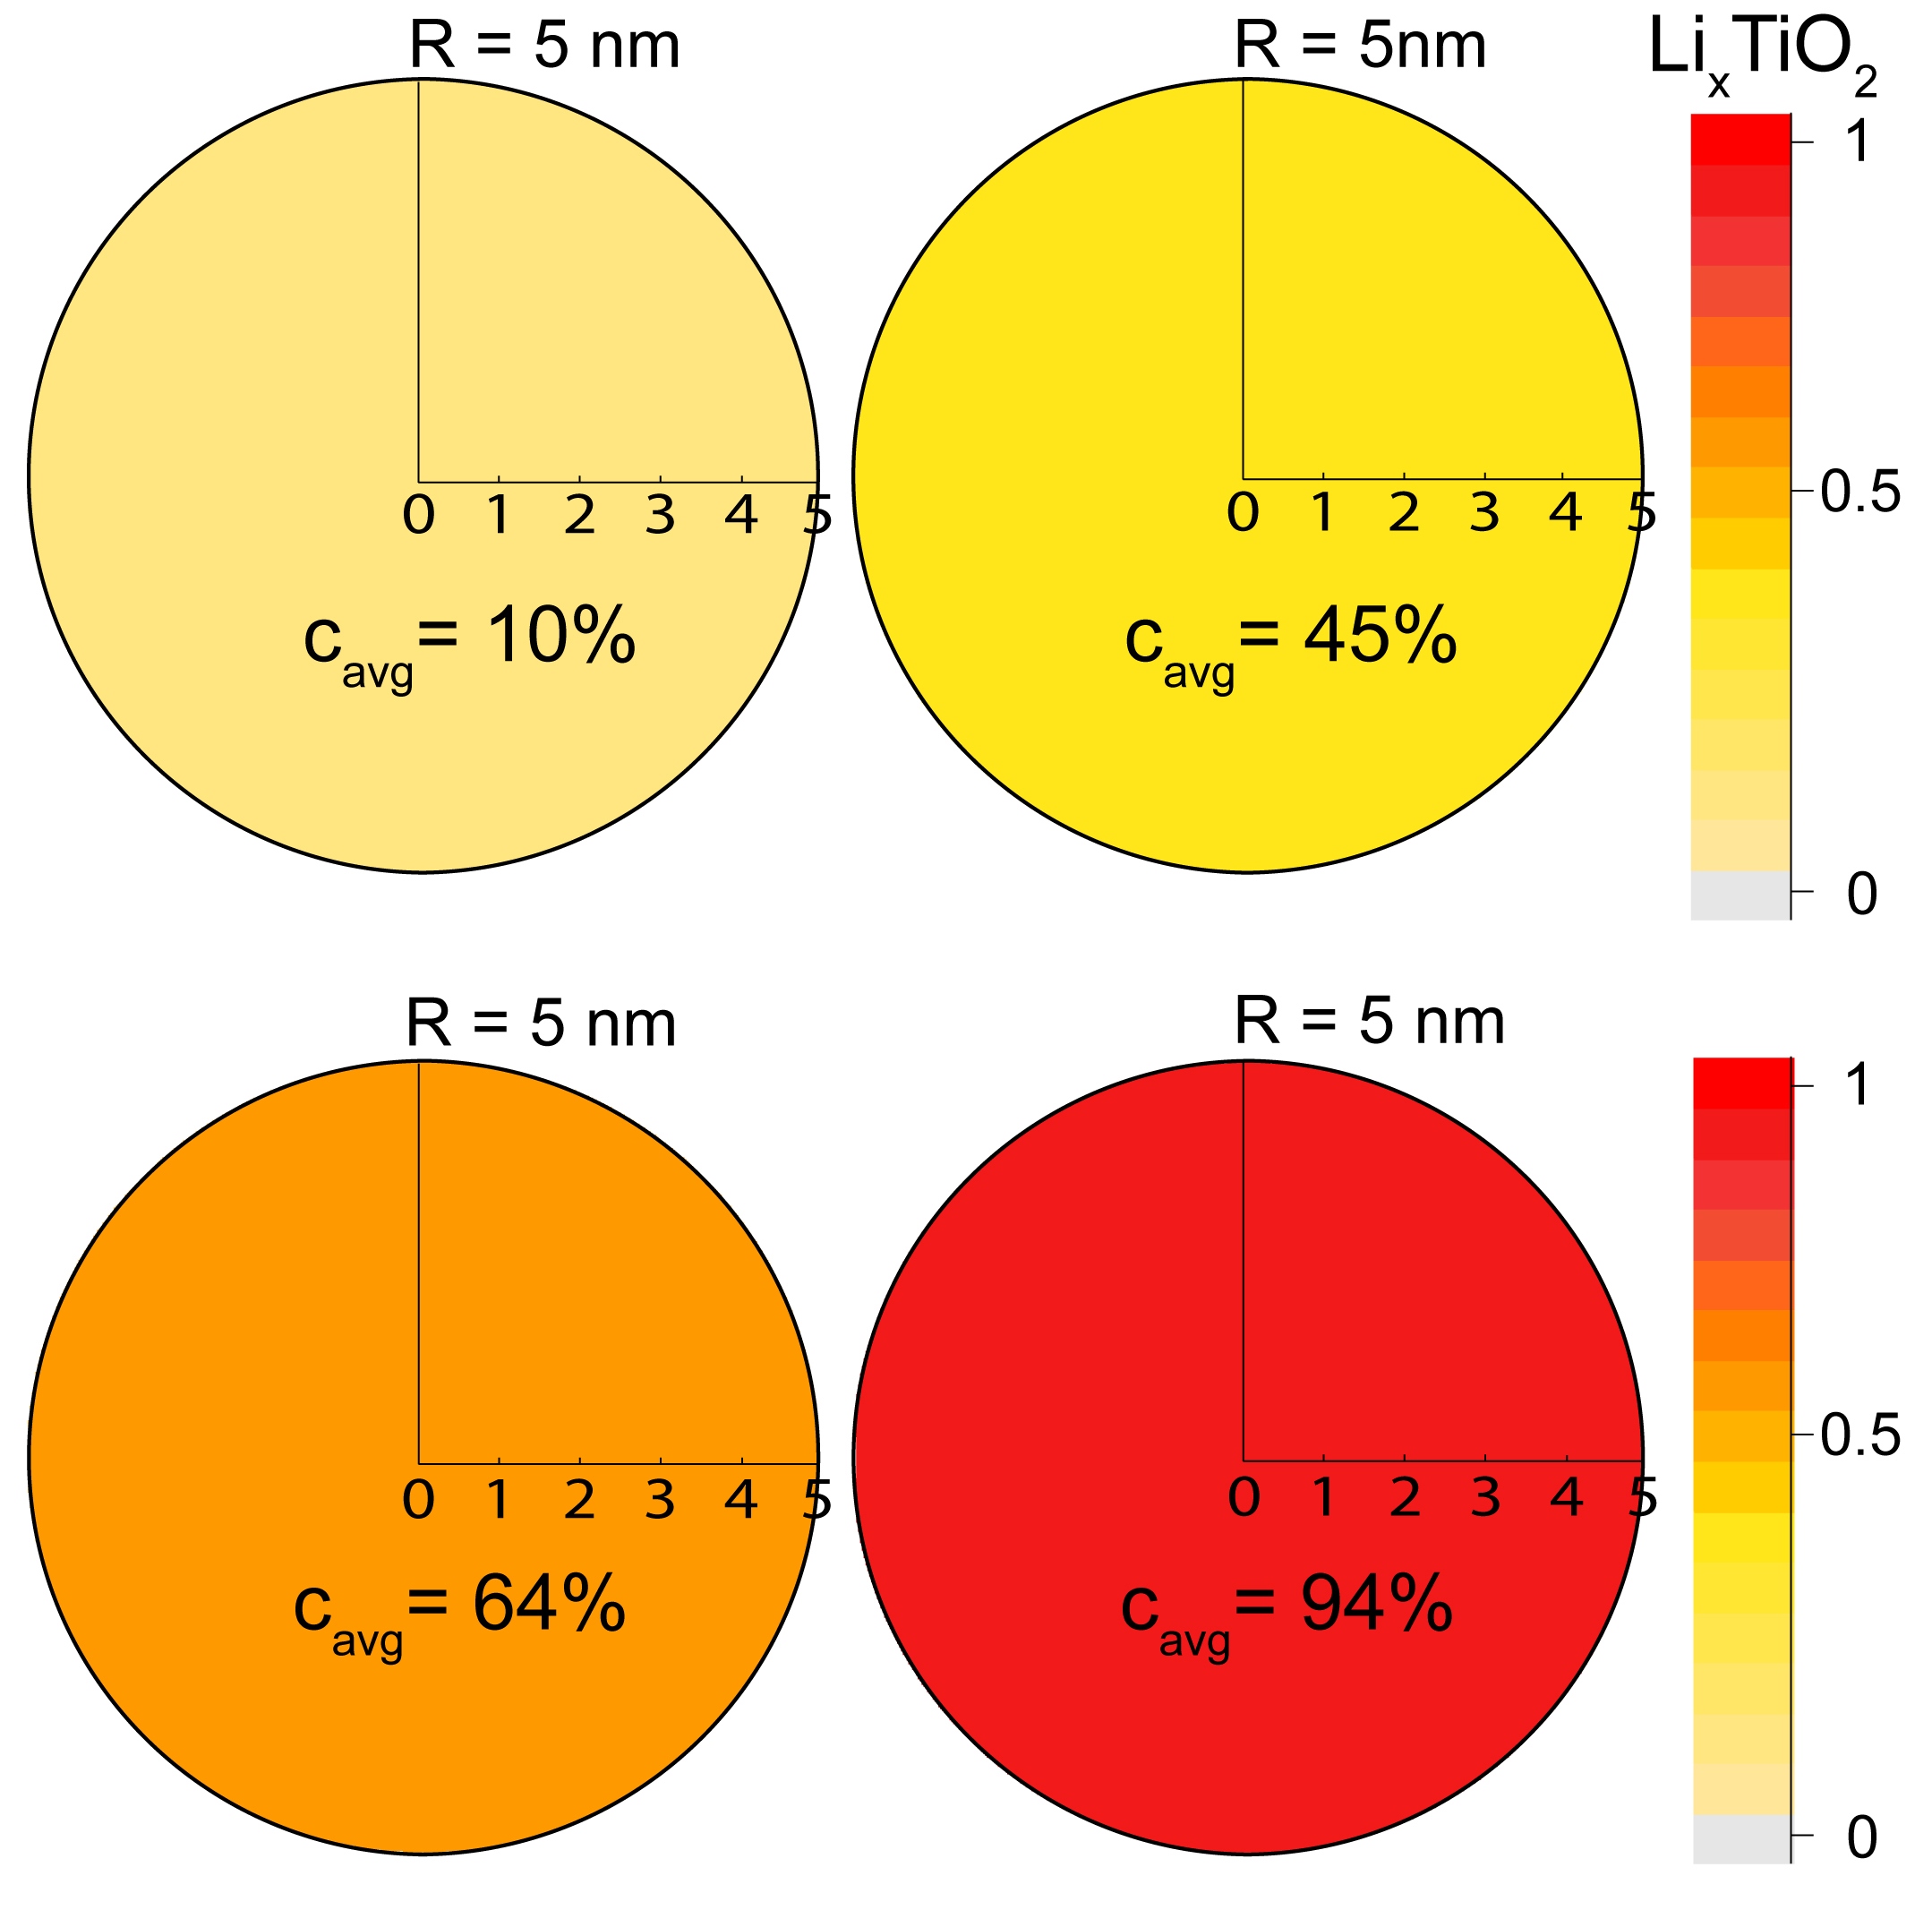
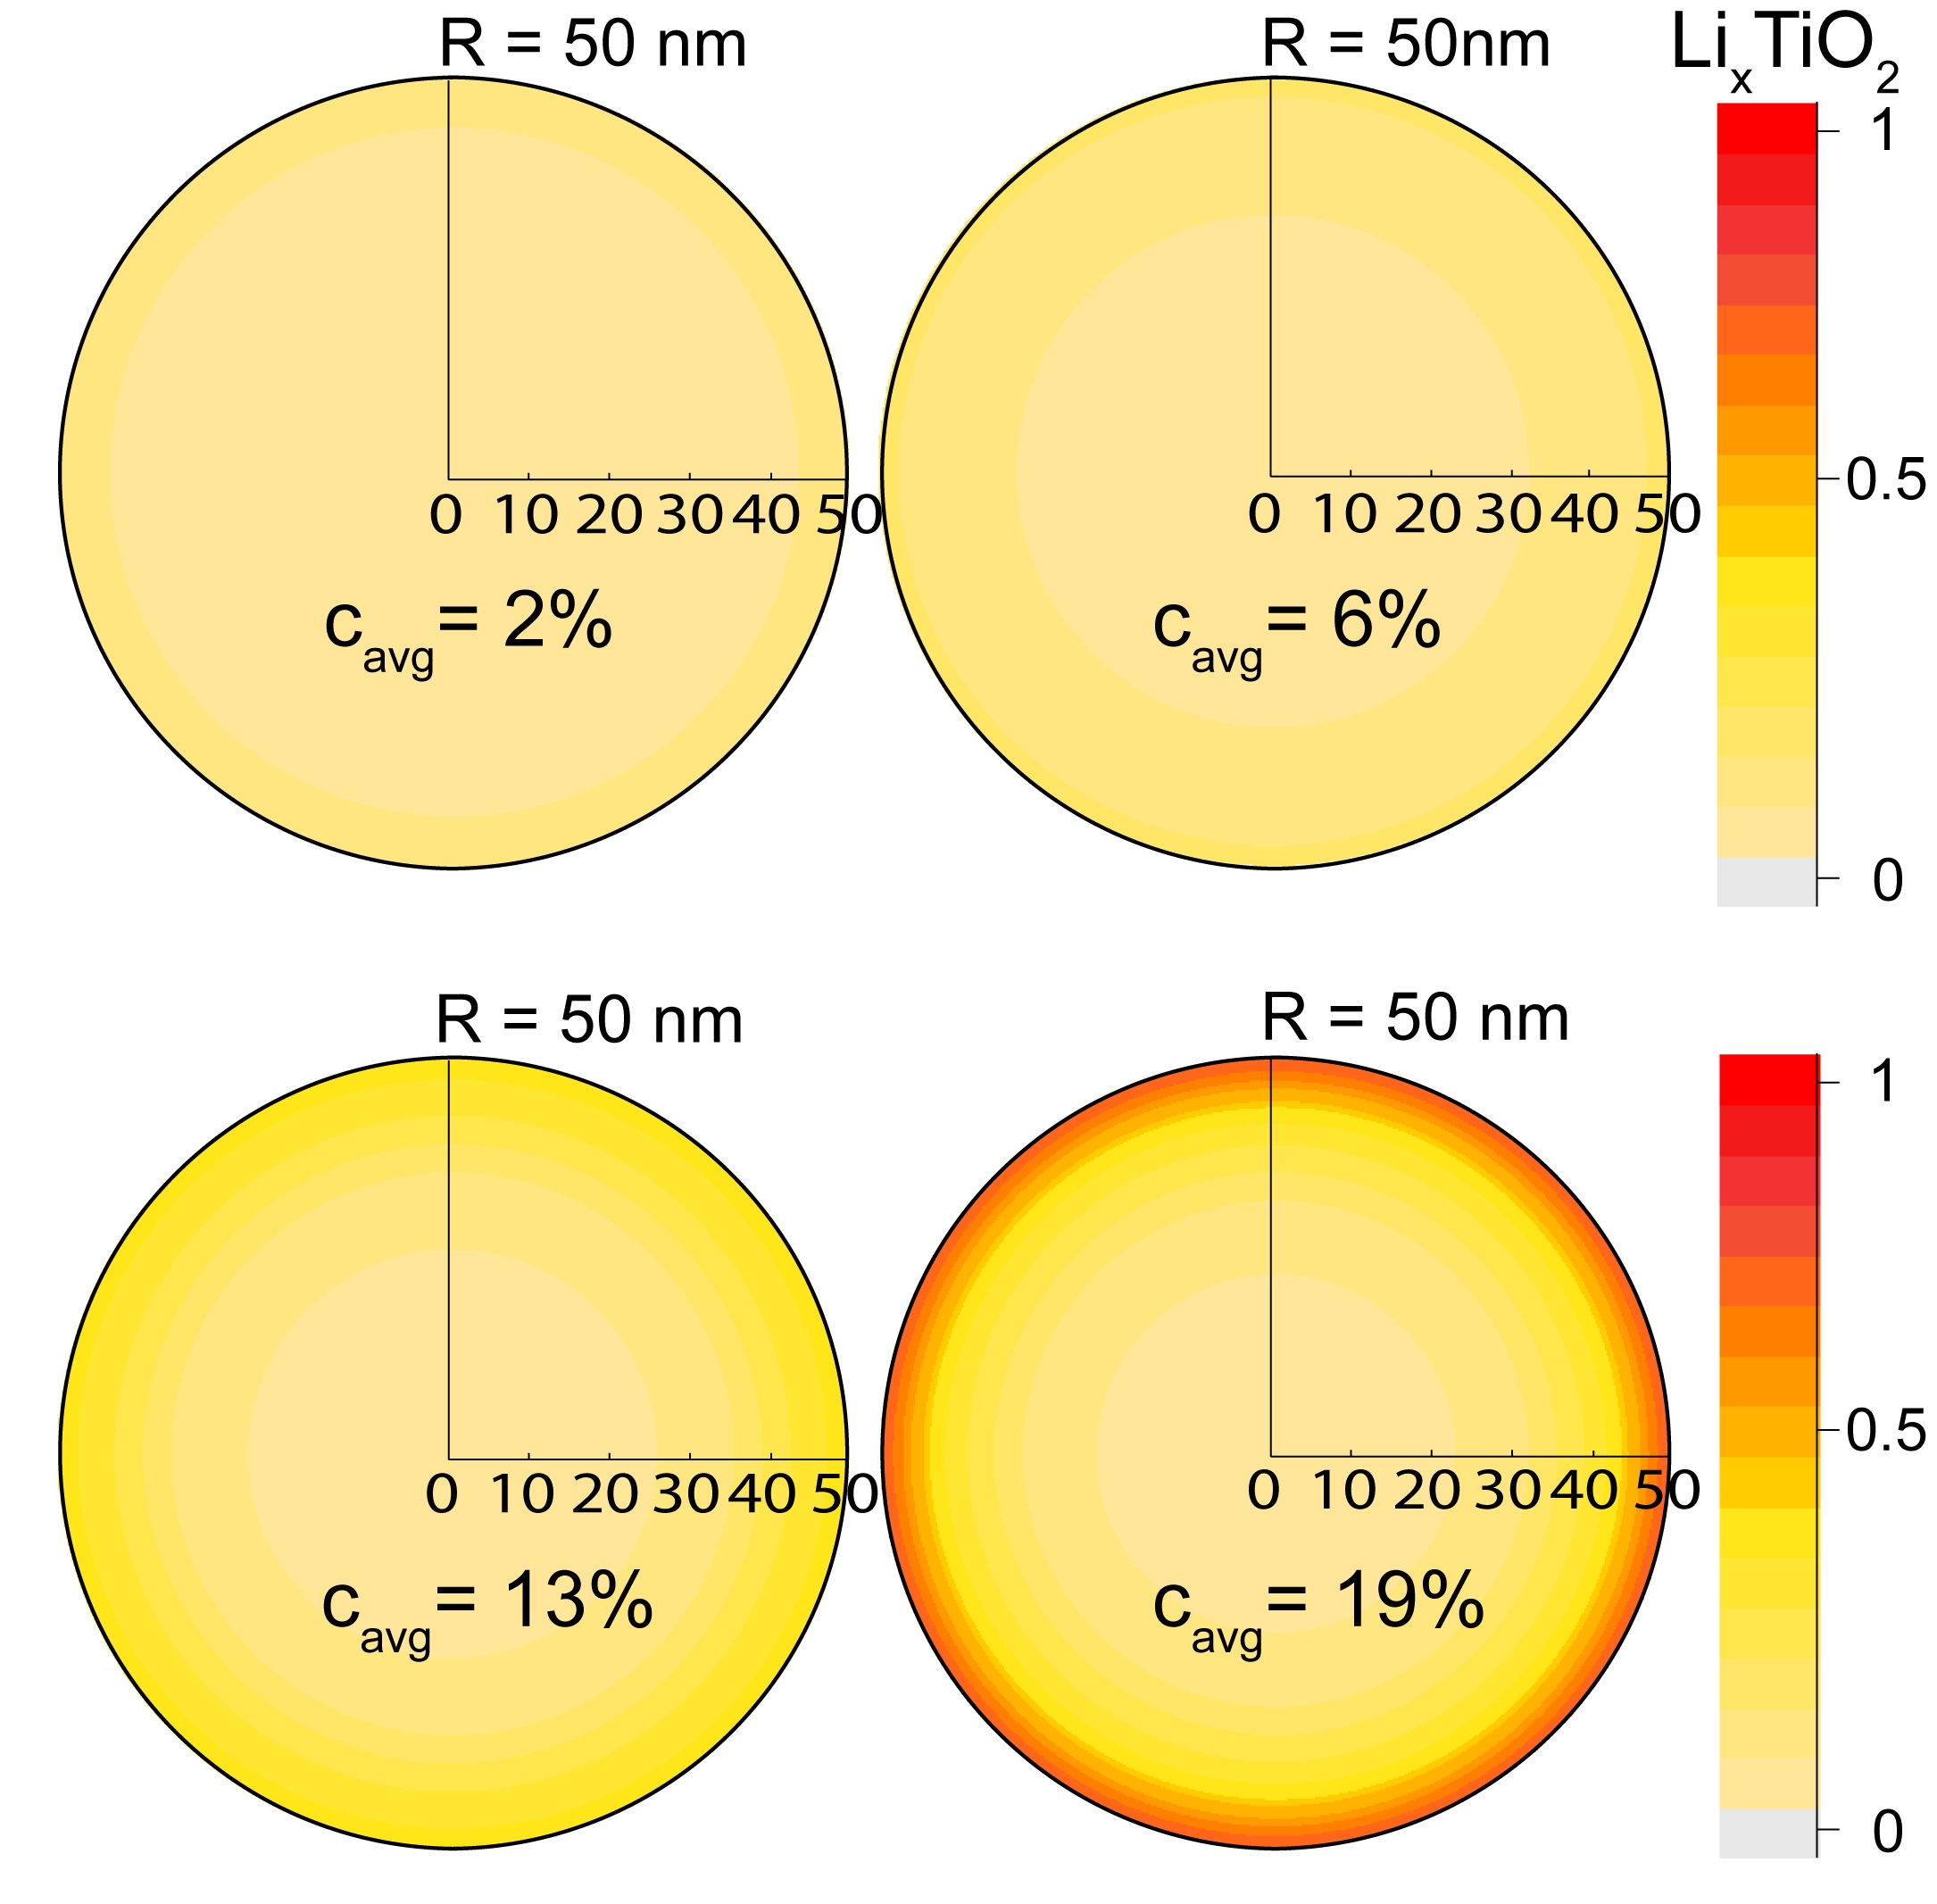
Experimentally it has been reported that only the first few nanometres near the surface transform to the \ceLi1TiO2 phase Wagemaker et al. (2007); Borghols et al. (2009a); Wagemaker et al. (2004), explaining why only nano-particles are able to reach the theoretical \ceLi1TiO2 composition Wagemaker et al. (2007); Lafont et al. (2010), and fully supported by the predicted concentration profiles in Figure 8. At 0.5C and 2C particles with a 5 nm radius transform completely to the \ceLi1TiO2 phase, while in bigger particles only the first few nanometres at the surface transform to the \ceLi1TiO2 phase. As a consequence decreasing the particle size increases the capacity, in particular because of the increasing utilization of the second phase transition.
Increasing the C-rate makes these effects more pronounced. For example, the final Li-composition of the 50 nm radius particle decreases from \ceLi_0.39TiO2 to \ceLi_0.25TiO2 when increasing the rate from 0.5C to 2C, while it only drops from \ceLi_0.98TiO2 to \ceLi_0.94TiO2 in the 5 nm particle. In the first place improved performance upon particle size reduction can be understood through the trivial effect of reducing the diffusion distance. The phase-field simulations also demonstrate that the non-trivial size effect, the destabilization of the first order phase transition, plays a crucial role in the enhanced performance of the smaller particles. As shown in Figure 10 the thickness of the \ceLi1TiO2-layer depends on particle size, with smaller particles having thicker \ceLi1TiO2-layers.
When the particle size approaches the width of the interface between the coexisting phases, phase separation is suppressed as previously shown for \ceLiFePO4 Burch and Bazant (2009); Wagemaker et al. (2011).
For the \ceTiO2-\ceLi_0.5TiO2 and \ceLi_0.5TiO2-\ceLi1TiO2 transitions the interface widths are approximately 40 nm and 5 nm, respectively Wagemaker et al. (2007), directly related to the gradient penalty (). This explains the evolution of the Li-ion concentration throughout the 5 and 50 nm particles shown for 0.5C in Figure 9.
The 5 nm particle completely lithiates through a solid solution reaction in which both phase transitions are suppressed due to the small particle size. In the 50 nm particle the first transformation from \ceTiO2 to \ceLi_0.5TiO2 is largely suppressed because it approaches the interface width of approximately 40 nm. However, at this particle size the second transition from \ceLi_0.5TiO2 to \ceLi1TiO2 is not suppressed.
The consequence of the particle size induced solid solution behaviour is that the formation of the blocking \ceLi1TiO2 phase at the particle surface is prevented, as observed in Figure 8, resulting in higher voltages and larger capacities for small particles.
In larger particles phase separation will occur, and Li-concentrations near the surface will approach \ceLi1TiO2. The poor Li-diffusivity in the \ceLi1TiO2 phase prevents moving of the phase boundary away from the surface, and the \ceLi1TiO2 surface layer will block further lithiation of the particle.
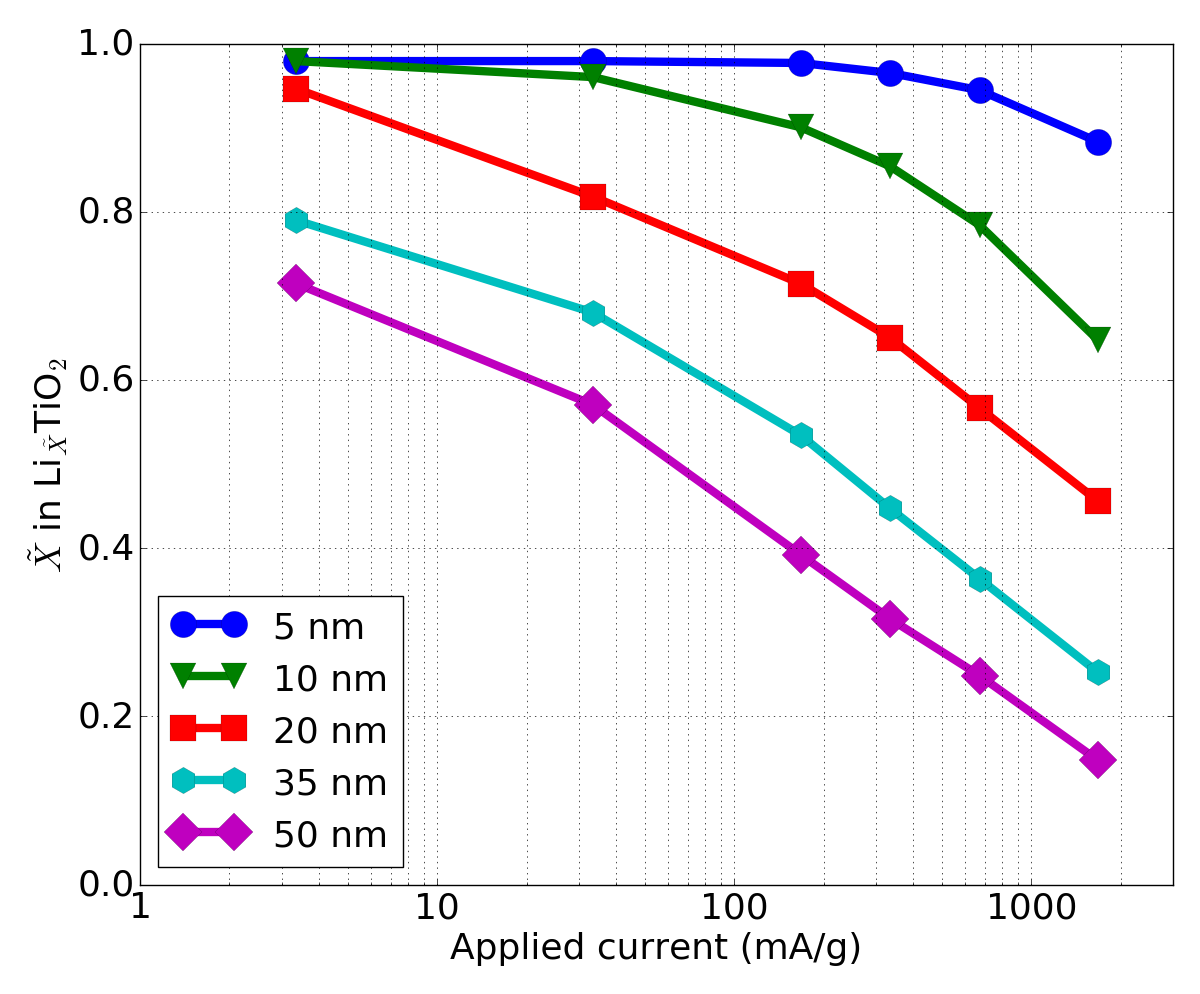
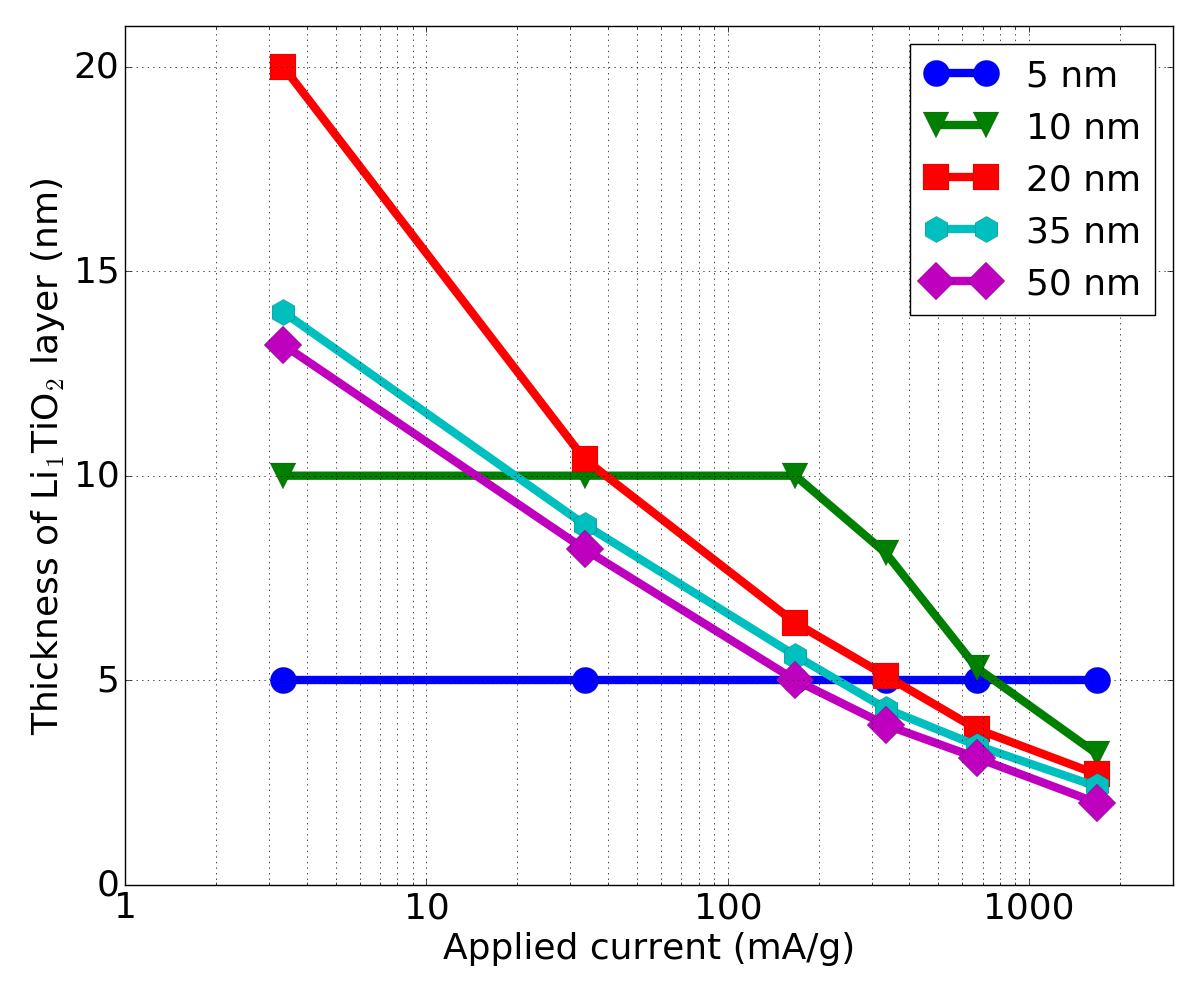
To show how this affects battery capacity the final capacity vs. C-rate and final thickness of the \ceLi1TiO2-layer vs. C-rate are shown for different particle sizes in Figure 10. Figure 10 shows that the thickness of the blocking \ceLi1TiO2 layer strongly depends on the particle size and C-rate, and that this is strongly correlated with the final capacity. As shown in Figure 10 to obtain high capacities small particles or low C-rates are required, otherwise the layer of \ceLi1TiO2 forming at the surface will block Li-intercalation. To obtain a general prediction of the maximum obtainable capacity as a function of applied current the concept of Sand’s time Bai et al. (2016) could be used. However, to incorporate the non-linear Li-flux through the anatase particles, which also depends on the particle size, modifications to the formulation of Sand’s time are necessary. For small particles the simulations show good agreement with experiments, but for large particles (>35 nm.) the simulated maximum particle composition is significantly smaller than \ceLi0.6TiO2 at moderate C-rates (>0.5C), underestimating experimental observations Gentili et al. (2012); Wagemaker et al. (2007). We propose two arguments for this. First, in experiments the surface area is larger compared to that of spherical particles assumed in the simulations. As a consequence the present simulations underestimate the amount of \ceLi1TiO2 formed, explaining the smaller capacities predicted. Second, although the phase-field calculations predict the extended solubility limits, the consequential enhanced Li-ion diffusivity is not implemented. Implementing this would require a diffusion term which depends on the local Li-concentration and the gradient of the Li-concentration, which requires further research outside of the scope of this study. Therefore the Li-ion diffusivity in particles where the solubility limits are significantly affected will be underestimated. This will be relevant for particle sizes comparable to the interface width, where in particular the larger interface width of the first phase transition enhances the Li-ion solubility limits. Thus explaining why for particles larger than 35 nm the present phase-field calculations underestimate the capacities as compared to experiments.
IV Discussion
As summarised in Figure 11, the second phase transformation towards the \ceLi1TiO2 phase at the surface of anatase \ceTiO2 particles is primarily responsible for the performance of anatase as Li-ion battery electrode.
During lithiation \ceTiO2-anatase is transformed to \ceLi_0.5TiO2, and this is followed by the formation of a thin layer of \ceLi1TiO2 at the particle surface. Because the Li-diffusion is poor in the \ceLi1TiO2-layer, the thickness of this layer primarily depends on the applied C-rate, as shown in Figure 10.
When applying small C-rates the entire anatase particle is able to transform to the \ceLi1TiO2-phase, electrochemically represented by a second voltage plateau. At moderate C-rates only the onset of the second plateau will occur, as consistently predicted by the present phase-field simulations.
For large C-rates and/or large anatase particles the lower voltage will drive the formation of a thin layer of the \ceLi1TiO2 phase. The slow Li transport through this layer prevents transformation of the complete particle towards the \ceLi1TiO2 phase. This is the origin of the observed large charge-transfer overpotentials, causing a shortening of the first voltage plateau, followed by a sloped tail in the voltage profile, thus rationalising the decreasing capacities with increasing lithiation rates and increasing particle size.
The strongly concentration dependent Li-diffusion provides an explanation of the memory effect observed for anatase electrodes Madej et al. (2014c), which presents itself through an decrease in the voltage in the charge-cycle (lithiation) following upon an incomplete charge/discharge cycle. The memory effect is caused by particles that are not completely delithiated before they are lithiating again, and thus more regions with poor diffusivity will remain in comparison to a complete charge/discharge cycle. In the memory-cycle the regions with poor diffusion will increase the charge-transfer overpotential in comparison to completely delithiated particles, explaining the observed memory effect. The phase-field simulations show that the charge-transfer overpotential strongly depends on the applied C-rate and the surface to volume ratio, explaining the experimental observations Madej et al. (2014c) of a larger memory effect at high C-rates and with smaller surface to volume ratios.
The blocking mechanism through the \ceLi1TiO2 phase formation at the surface of anatase particles, as predicted by the present simulations, indicates that the single grain lithiation limits the rate performance of complete electrodes. This is explicitly demonstrated by the multi-particle phase-field simulation, where all particles transform concurrently. All grains are active, implying that the electrode is unable to provide a higher current due to the single particle limitations. This is unlike other electrode materials, such as \ceLiFePO4, \ceLi4Ti5O_12, and \ceLiCoO2, in which ionic and electronic wiring dominate the internal resistance Liu et al. (2016); Strobridge et al. (2015); Li et al. (2015); Singh et al. (2013b); Kim et al. (2013).
The phase-field model predicts that the applied overpotential is unable to induce solid solution behaviour through widening of the phase interface regions, which has been shown for \ceLiFePO4 Zhang et al. (2014), because at high overpotentials a layer of \ceLi1TiO2 phase will form at the surface, after which the poor Li-ion diffusivity in this phase consumes the applied overpotential.
V Conclusions
The present phase-field model with parameters from literature is able to qualitatively explain practically all experimental phenomena observed during lithiation of anatase electrodes. This includes the impact of particle size, C-rate, Li-ion diffusivity, surface area, and the observed memory effect. The kinetic restrictions of the \ceLi1TiO2 phase forming at the surface of anatase particles is the origin of the performance restrictions, and prevents fast transformation of anatase particles, even under high current. The simulations reveal that the transformation of single anatase particles limits the performance of the complete electrode, rather than the ionic and electronic wiring that appears to be rate limiting for other electrode materials. This demonstrates that the limitation of anatase can only be addressed if the formation of a blocking \ceLi1TiO2 layer can be suppressed. This can be achieved by particle size reduction, where the reduction of the Li-ion diffusion distance as well as the suppression of the phase transitions enhances the Li-ion transport, increasing the capacity at high C-rates. A second strategy is to improve the Li-ion diffusivity in the anatase \ceTiO2 lattice by doping. The simulations give detailed insight on the impact of both approaches, providing a rational strategy towards improved performance. Thus, a comprehensive model for lithiation of anatase \ceTiO2 has been presented. The good agreement with literature provides deep insight into the lithiation mechanism of anatase, and validation of the physical description of the phase-field model. This further motivates developing phase-field models for electrode materials, which will provide fundamental understanding of the limitations of battery materials, necessary for the formulation of strategies towards improved battery materials, design, and performance.
VI Acknowledgements
The research leading to these results has received funding from the European Research Council under the European Union’s Seventh Framework Programme (FP/2007-2013)/ERC Grant Agreement nr. [307161] of M.W. Financial support from the Advanced Dutch Energy Materials (ADEM) program of the Dutch Ministry of Economic Affairs, Agriculture and Innovation is gratefully acknowledged. R.B.S. and M.Z.B. acknowledge partial support from Samsung-MIT Alliance and the D3BATT project of the Toyota Research Institute.
VII Supplementary Information
See the Supplemental Material for a description of the many particle effects at 0.01C, and a comparison between the minimal and maximum charge transfer coefficients obtained from experiments.
References
- Deng (2015) D. Deng, Energy Science and Engineering 3, 385 (2015).
- Franco (2013) A. A. Franco, Rsc Advances 3, 13027 (2013).
- Zhang et al. (2015a) X. Zhang, T. W. Verhallen, F. Labohm, and M. Wagemaker, Advanced Energy Materials 5 (2015a), 10.1002/aenm.201500498.
- Notten and Danilov (2014) P. H. L. Notten and D. L. Danilov, Advances in Chemical Engineering and Science 04, 62 (2014).
- Vo et al. (2015) T. T. Vo, X. Chen, W. Shen, and A. Kapoor, Journal of Power Sources 273, 413 (2015).
- Sethuraman et al. (2012) V. A. Sethuraman, V. Srinivasan, and J. Newman, Journal of the Electrochemical Society 160, A394 (2012).
- Landstorfer et al. (2011) M. Landstorfer, S. Funken, and T. Jacob, Physical chemistry chemical physics : PCCP 13, 12817 (2011).
- Dargaville and Farrell (2013) S. Dargaville and T. W. Farrell, Electrochimica Acta 111, 474 (2013).
- Bazant (2013) M. Z. Bazant, Accounts of Chemical Research 46, 1144 (2013).
- Salvadori et al. (2015) A. Salvadori, D. Grazioli, and M. G. D. Geers, International Journal of Solids and Structures 59, 90 (2015).
- Li et al. (2014) Y. Li, F. El Gabaly, T. R. Ferguson, R. B. Smith, N. C. Bartelt, J. D. Sugar, K. R. Fenton, D. A. Cogswell, A. L. D. Kilcoyne, T. Tyliszczak, M. Z. Bazant, and W. C. Chueh, Nature Materials 13, 1149 (2014).
- Singh et al. (2008) G. K. Singh, G. Ceder, and M. Z. Bazant, Electrochimica Acta 53, 7599 (2008).
- Burch and Bazant (2009) D. Burch and M. Z. Bazant, Nano Letters 9, 3795 (2009).
- Ferguson and Bazant (2012) T. R. Ferguson and M. Z. Bazant, Journal of the Electrochemical Society 159, A1967 (2012).
- Wagemaker et al. (2011) M. Wagemaker, D. P. Singh, W. J. H. Borghols, U. Lafont, L. Haverkate, V. K. Peterson, and F. M. Mulder, Journal of the American Chemical Society 133, 10222 (2011).
- Welland et al. (2015) M. J. Welland, D. Karpeyev, D. T. O’Connor, and O. Heinonen, ACS Nano 9, 9757 (2015).
- Zhang et al. (2014) X. Zhang, M. van Hulzen, D. P. Singh, A. Brownrigg, J. P. Wright, N. H. van Dijk, and M. Wagemaker, Nano Lett. 14, 2279 (2014).
- Liu et al. (2014) H. Liu, F. C. Strobridge, O. J. Borkiewicz, K. M. Wiaderek, K. W. Chapman, P. J. Chupas, and C. P. Grey, Science 344, 1252817 (2014).
- Zhang et al. (2015b) X. Zhang, M. van Hulzen, D. P. Singh, A. Brownrigg, J. P. Wright, N. H. van Dijk, and M. Wagemaker, Nat Commun 6, 8333 (2015b).
- O’Connor et al. (2016) D. T. O’Connor, M. J. Welland, W. Kam Liu, and P. W. Voorhees, Modell. Simul. Mater. Sci. Eng. 24, 035020 (2016).
- Ferguson and Bazant (2014) T. R. Ferguson and M. Z. Bazant, Electrochimica Acta 146, 89 (2014).
- Guo et al. (2016) Y. Guo, R. B. Smith, Z. Yu, D. K. Efetov, J. Wang, P. Kim, M. Z. Bazant, and L. E. Brus, J Phys Chem Lett 7, 2151 (2016).
- Lafont et al. (2010) U. Lafont, D. Carta, G. Mountjoy, A. V. Chadwick, and E. M. Kelder, Journal of Physical Chemistry C 114, 1372 (2010).
- Singh et al. (2013a) D. P. Singh, A. George, R. V. Kumar, J. E. ten Elshof, and M. Wagemaker, Journal of Physical Chemistry C 117, 19809 (2013a).
- Shen et al. (2014) K. Shen, H. Chen, F. Klaver, F. M. Mulder, and M. Wagemaker, Chemistry of Materials 26, 1608 (2014).
- Wagemaker et al. (2007) M. Wagemaker, W. J. H. Borghols, and F. M. Mulder, Journal of the American Chemical Society 129, 4323 (2007).
- Sudant et al. (2005) G. Sudant, E. Baudrin, D. Larcher, and J.-M. Tarascon, Journal of Materials Chemistry (2005), 10.1039/b416176a.
- Morgan and Watson (2011) B. J. Morgan and G. W. Watson, Journal of Physical Chemistry Letters 2, 1657 (2011).
- Søndergaard et al. (2015) M. Søndergaard, Y. Shen, A. Mamakhel, M. Marinaro, M. Wohlfahrt-Mehrens, K. Wonsyld, S. Dahl, and B. B. Iversen, Chemistry of Materials 27, 119 (2015).
- Madej et al. (2014a) E. Madej, F. La Mantia, B. Mei, S. Klink, M. Muhler, W. Schuhmann, and E. Ventosa, Journal of Power Sources 266, 155 (2014a).
- Wang et al. (2011) Y. Wang, S. Liu, K. Huang, D. Fang, and S. Zhuang, Journal of Solid State Electrochemistry 16, 723 (2011).
- Sun et al. (2010) C. H. Sun, X. H. Yang, J. S. Chen, Z. Li, X. W. Lou, C. Li, S. C. Smith, G. Q. Lu, and H. G. Yang, Chemical Communications 46, 6129 (2010).
- Madej et al. (2014b) E. Madej, E. Ventosa, S. Klink, W. Schuhmann, and F. La Mantia, Phys Chem Chem Phys 16, 7939 (2014b).
- Gentili et al. (2012) V. Gentili, S. Brutti, L. J. Hardwick, A. R. Armstrong, S. Panero, and P. G. Bruce, Chemistry of Materials 24, 4468 (2012).
- Rai et al. (2013) A. K. Rai, L. T. Anh, J. Gim, V. Mathew, J. Kang, B. J. Paul, J. Song, and J. Kim, Electrochimica Acta 90, 112 (2013).
- Zachau-Christiansen et al. (1988) B. Zachau-Christiansen, K. West, T. Jacobsen, and S. Atlung, Solid State Ionics 28, 1176 (1988).
- Macklin and Neat (1992) W. J. Macklin and R. J. Neat, Solid State Ionics 53, 694 (1992).
- Belak et al. (2012) A. A. Belak, Y. Wang, and A. Van der Ven, Chemistry of Materials 24, 2894 (2012).
- Yildirim et al. (2011) H. Yildirim, J. Greeley, and S. K. R. S. Sankaranarayanan, The Journal of Physical Chemistry C 115, 15661 (2011).
- Borghols et al. (2009a) W. J. H. Borghols, D. Lützenkirchen-Hecht, U. Haake, E. R. H. van Eck, F. M. Mulder, and M. Wagemaker, Physical Chemistry Chemical Physics 11, 5742 (2009a).
- Smith and Bazant (2017) R. B. Smith and M. Z. Bazant, J. Electrochem. Soc. 164, E3291 (2017).
- Munichandraiah et al. (1994) N. Munichandraiah, L. G. Scanlon, R. A. Marsh, B. Kumar, and A. K. Sircar, Journal of Electroanalytical Chemistry 379, 495 (1994).
- Smith et al. (2017) R. B. Smith, E. Khoo, and M. Z. Bazant, J. Phys. Chem. C 121, 12505 (2017).
- Bai et al. (2011) P. Bai, D. A. Cogswell, and M. Z. Bazant, Nano Letters 11, 4890 (2011).
- Borghols et al. (2009b) W. J. Borghols, M. Wagemaker, U. Lafont, E. M. Kelder, and F. M. Mulder, J Am Chem Soc 131, 17786 (2009b).
- Lunell et al. (1997) S. Lunell, A. Stashans, L. Ojamäe, H. Lindström, and A. Hagfeldt, Journal of the American Chemical Society 119, 7374 (1997).
- Tielens et al. (2005) F. Tielens, M. Calatayud, A. Beltran, C. Minot, and J. Andres, Journal of Electroanalytical Chemistry 581, 216 (2005).
- Sussman et al. (2014) M. J. Sussman, A. Yasin, and G. P. Demopoulos, Journal of Power Sources 272, 58 (2014).
- Nauman and He (2001) E. B. Nauman and D. Q. He, Chem. Eng. Sci. 56, 1999 (2001).
- Zeng and Bazant (2014) Y. Zeng and M. Z. Bazant, SIAM Journal on Applied Mathematics 74, 980 (2014).
- Wang et al. (2007) J. Wang, J. Polleux, J. Lim, and B. Dunn, Journal of Physical Chemistry C 111, 14925 (2007).
- Kim and Choi (2015) S.-H. Kim and S.-Y. Choi, Journal of Electroanalytical Chemistry 744, 45 (2015).
- Lindstrom et al. (1997) H. Lindstrom, S. Sodergren, A. Solbrand, H. Rensmo, J. Hjelm, A. Hagfeldt, and S. E. Lindquist, Journal of Physical Chemistry B 101, 7717 (1997).
- Wagemaker et al. (2003) M. Wagemaker, G. J. Kearley, A. A. van Well, H. Mutka, and F. M. Mulder, Journal of the American Chemical Society 125, 840 (2003).
- Ganapathy et al. (2011) S. Ganapathy, E. R. van Eck, A. P. Kentgens, F. M. Mulder, and M. Wagemaker, Chemistry 17, 14811 (2011).
- Shin et al. (2012) J.-Y. Shin, J. H. Joo, D. Samuelis, and J. Maier, Chemistry of Materials 24, 543 (2012).
- Kavan (2014) L. Kavan, Journal of Solid State Electrochemistry 18, 2297 (2014).
- Wang et al. (2014) Z. Wang, J. Sha, E. Liu, C. He, C. Shi, J. Li, and N. Zhao, Journal of Materials Chemistry A 2, 8893 (2014).
- Yang et al. (2015) X. Yang, Y. Yang, H. Hou, Y. Zhang, L. Fang, J. Chen, and X. Ji, Journal of Physical Chemistry C 119, 3923 (2015).
- Wagemaker et al. (2001) M. Wagemaker, R. van de Krol, A. P. M. Kentgens, A. A. van Well, and F. M. Mulder, Journal of the American Chemical Society 123, 11454 (2001).
- Wagemaker et al. (2002) M. Wagemaker, A. P. M. Kentgens, and F. M. Mulder, Nature 418, 397 (2002).
- Smith (2017) R. B. Smith, https://bitbucket.org/bazantgroup/mpet (2017).
- Nikolić (2016) D. D. Nikolić, PeerJ Computer Science 2, e54 (2016).
- Kim et al. (2010) M. G. Kim, H. Kim, and J. Cho, Journal of The Electrochemical Society 157, A802 (2010).
- Bruce et al. (2008) P. G. Bruce, B. Scrosati, and J. M. Tarascon, Angew Chem Int Ed Engl 47, 2930 (2008).
- Orvananos et al. (2015) B. Orvananos, H. C. Yu, A. Abdellahi, R. Malik, C. P. Grey, G. Ceder, and K. Thornton, Journal of the Electrochemical Society 162, A965 (2015).
- Liu et al. (2016) Z. Liu, T. W. Verhallen, D. P. Singh, H. Wang, M. Wagemaker, and S. Barnett, Journal of Power Sources 324, 358 (2016).
- Strobridge et al. (2015) F. C. Strobridge, B. Orvananos, M. Croft, H.-C. Yu, R. Robert, H. Liu, Z. Zhong, T. Connolley, M. Drakopoulos, K. Thornton, and C. P. Grey, Chemistry of Materials 27, 2374 (2015).
- Li et al. (2015) Y. Li, S. Meyer, J. Lim, S. C. Lee, W. E. Gent, S. Marchesini, H. Krishnan, T. Tyliszczak, D. Shapiro, A. L. Kilcoyne, and W. C. Chueh, Adv. Mater. 27, 6591 (2015).
- Singh et al. (2013b) D. P. Singh, F. M. Mulder, and M. Wagemaker, Electrochemistry Communications 35, 124 (2013b).
- Kim et al. (2013) C. Kim, N. S. Norberg, C. T. Alexander, R. Kostecki, and J. Cabana, Advanced Functional Materials 23, 1214 (2013).
- Ren et al. (2014) Y. Ren, J. Li, and J. Yu, Electrochimica Acta 138, 41 (2014).
- Shin et al. (2011) J.-Y. Shin, D. Samuelis, and J. Maier, Advanced Functional Materials 21, 3464 (2011).
- Madej et al. (2015) E. Madej, S. Klink, W. Schuhmann, E. Ventosa, and F. La Mantia, Journal of Power Sources 297, 140 (2015).
- Madej et al. (2014c) E. Madej, F. La Mantia, W. Schuhmann, and E. Ventosa, Advanced Energy Materials 4, n/a (2014c).
- Wagemaker et al. (2009) M. Wagemaker, F. M. Mulder, and A. Van der Ven, Advanced Materials 21, 2703 (2009).
- Wagemaker et al. (2004) M. Wagemaker, D. Lüenkirchen-Hecht, A. A. van Well, and R. Frahm, The Journal of Physical Chemistry B 108, 12456 (2004).
- Bai et al. (2016) P. Bai, J. Li, F. R. Brushett, and M. Z. Bazant, Energy Environ. Sci. 9, 3221 (2016).