Wedge wetting by electrolyte solutions
Abstract
The wetting of a charged wedge-like wall by an electrolyte solution is investigated by means of classical density functional theory. As in other studies on wedge wetting, this geometry is considered as the most simple deviation from a planar substrate, and it serves as a first step towards more complex confinements of fluids. By focusing on fluids containing ions and surface charges, features of real systems are covered which are not accessible within the vast majority of previous theoretical studies concentrating on simple fluids in contact with uncharged wedges. In particular, the filling transition of charged wedges is necessarily of first order, because wetting transitions of charged substrates are of first order and the barrier in the effective interface potential persists below the wetting transition of a planar wall; hence, critical filling transitions are not expected to occur for ionic systems. The dependence of the critical opening angle on the surface charge, as well as the dependence of the filling height, of the wedge adsorption, and of the line tension on the opening angle and on the surface charge are analyzed in detail.
I Introduction
Over the past few decades numerous theoretical and experimental investigations have been performed aiming at a microscopic understanding of the phenomena of fluids at interfaces, e.g., capillarity, wetting, and spreading, which are of technological importance for, e.g., coating processes, surface patterning, or the functioning of microfluidic devices Lin (2011); Vogel (2012); Nee (2015); Wen and Dušek (2017); Galindo-Rosales (2018). Particularly simple model systems to investigate these phenomena theoretically are planar homogeneous substrates, which have been studied intensively Dietrich (1988); Schick (1990); Dietrich and Napiórkowski (1991). This way, methods have been developed to relate the thickness of fluid films adsorbed at substrates and the contact angle to fluid-fluid and wall-fluid interactions, to infer surface phase diagrams, and to characterize the order of wetting transitions.
However, the preparation of truly flat homogeneous substrates requires a huge technical effort and in nature there is no such thing as a perfectly flat surface Lüth (2015). On the one hand, one is always confronted with geometrically or chemically structured substrates, irregularly-shaped boundaries, or geometrical disorder. On the other hand, modern surface patterning techniques allow for the targeted fabrication of structured substrates with pits, posts, grooves, edges, wedges etc. in order to generate functionality, e.g., superhydrophobic surfaces Checco et al. (2014). This leads to the necessity of studying substrates beyond the simple flat geometry, but the wetting properties of such nonplanar substrates are very different from smooth and planar walls and their description is much more complex.
Perhaps the most simple of the aforementioned elementary topographic surface structures are wedges, which are formed by the intersection of two planar walls meeting at a particular opening angle. First predictions of the phenomenon of the filling of a wedge upon decreasing the opening angle have been based on macroscopic considerations Pomeau (1986); Hauge (1992). Microscopic classical density functional theory and mesoscopic approaches based on effective interface Hamiltonians revealed that systems with long-ranged Van-der-Waals interactions, where critical wetting transitions of planar walls occur, exhibit critical wedge filling transitions with universal asymptotic scaling behavior of the relevant quantities Napiórkowski et al. (1992, 1994); Parry et al. (1999). It has been argued that the order of a filling transition equals the order of the wetting transition of a planar wall Rejmer et al. (1999). However, it turned out later that the relation between the orders of wetting and filling transitions is more subtle: If the wetting transition is critical then the filling transition is critical, too. Otherwise, if the wetting transition is of first order then the filling transition may be first-order or critical, depending on whether or not a barrier exists in the effective interface potential at the filling transition Parry et al. (2000, 2001). A consequence of the latter scenario with first-order wetting transitions is the possibility to have first-order filling transitions, if the critical opening angle is wide, and critical filling transitions, if it is narrow. These predictions from mesoscopic approaches have been recently verified by microscopic classical density functional theory Malijevskỳ and Parry (2013, 2015).
In order to reduce complexity, all cited previous theoretical studies on wedge wetting have been performed for models of simple fluids. However, many fluids used in applications, including pure water due to its autodissociation reaction, are complex fluids containing ions, so that the generic situation of wedge wetting by electrolyte solutions is of enormous interest from both the fundamental as well as the applied point of view. Despite the huge relevance of electrolytes as fluids involved in wedge wetting scenarios Baratian et al. (2015), this setup has not been theoretically studied before on the microscopic level, probably due to the expected lack of universality and increased complexity as compared to cases with critical wetting and filling transitions. Indeed, it turned out for planar walls that the presence of ions, not too close to bulk critical points, generates first-order wetting and a non-vanishing barrier in the effective interface potential below the wetting transition Ibagon et al. (2014). Hence, on very general grounds, one expects first-order filling transitions of wedges to take place for electrolyte solutions.
In the present work, a microscopic lattice model is studied within a classical density functional theory framework in order to investigate the properties of wedge wetting by electrolyte solutions. The usage of a lattice model allows for technical advantages over continuum models Ibagon et al. (2013, 2014, 2016). The model and the density functional formulation is specified in Sec. II. In Sec. III first the bulk phase diagram and the wetting behavior of a planar wall of the considered model are reported. Next, wedge wetting is studied in terms of three observables: the wedge adsorption, the filling height, and the line tension. The dependence of these quantities on the wedge opening angle, on the surface charge density of the walls of the wedge, as well as on the strength and the range of the nonelectrostatic wall-fluid interaction are discussed in detail. Concluding remarks on the first-order filling transition considered in the present work and the more widely studied critical filling transition are given in Sec. IV.
II Theoretical foundations
II.1 Setup
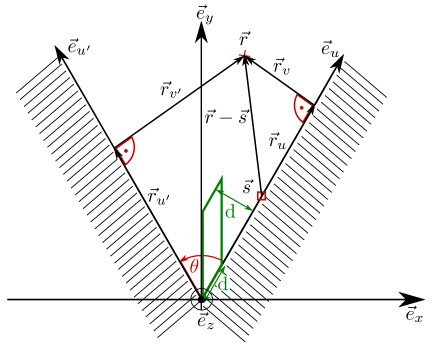
In the present work, the filling behavior of an electrolyte solution close to a wedge-like substrate is studied. Consider in three-dimensional Euclidean space a wedge composed of two semi-infinite planar walls meeting at an opening angle along the -axis of a Cartesian coordinate system (see Fig. 1). Due to the translational symmetry in -direction the system can be treated as quasi-two-dimensional. In between the two walls an electrolyte solution composed of an uncharged solvent (index “0”), univalent cations (index “+”), and univalent anions (index “-”) is present. The wedge is in contact with a gas bulk at thermodynamic coexistence between liquid and gas phase. This choice of the thermodynamic parameters allows for two different filling states of the wedge. From macroscopic considerations Pomeau (1986); Hauge (1992), a critical opening angle
| (1) |
with the contact angle of the liquid can be derived, which marks the transition between the wedge being filled by gas (“empty wedge”) for and the wedge being filled by liquid for . It is of utmost importance for the following to realize that, from the microscopic point of view, a macroscopically empty wedge is typically partially filled by liquid.
Characterizing the dependence of the critical opening angle on the wall charge and describing the partial filling upon approaching the filling transition for are the objectives of the present study.
II.2 Density functional theory
In order to determine the equilibrium structure of the fluid in terms of the density profiles of the three species, classical density functional theory Evans (1979) is used. As wetting phenomena typically require descriptions on several length scales, computational advantage is gained by studying a lattice fluid model in the spirit of Refs. Ibagon et al. (2013, 2014, 2016). In order to account for the special geometry of the system at hand, the standard lattice fluid model is adapted by using parallelograms as basic elements of the grid, which is indicated by the parallelogram close to the apex of the wedge in Fig. 1. The size of an elementary parallelogram, which can be occupied by at most one particle of either species, is chosen such that, with d denoting the particle diameter, the sides parallel to the wall are of length d and they are a distance d apart from each other (see Fig. 1). Each cell is identified by a pair of integer indices where denotes the distance from the wall and represents the location parallel to the walls (see Fig. 1). The approximative density functional of this model used in the present work can be written as
| (2) |
where denotes the packing fraction of fluid component inside the cell specified by the indices , being the sum of the partial packing fractions, is the effective chemical potential of component , and is the maximal number density of the fluid. In the following the values with and are chosen in correspondence with water at room temperature. Whereas the first line of Eq. (2) corresponds to the exact lattice fluid of non-interacting particles in an external field, the terms in the second line of Eq. (2) describe interactions amongst the particles in a mean-field-like fashion.
The external potential in Eq. (2) describes the non-electrostatic interaction of the wall with a particle in cell . It is chosen to be independent of the specific particle type. Here the wall-fluid interaction strength at a given position results from a superposition of interactions with all points at the surface of the walls (see Fig. 1):
| (3) |
where is the underlying molecular pair potential of the wall-fluid interaction. For the sake of simplicity the Gaussian form
| (4) |
with decay length is used, which leads to the non-electrostatic wall-fluid interaction, Eq. (3),
| (5) |
where the dimensionless coefficient describes the wall-fluid interaction strength.
The two remaining expressions in Eq. (2) consider the interactions among the particles, which we consider as being composed of an electrically neutral molecular body and, in the case of the ions, an additional charge monopole. The way these interactions are treated regards the interactions as split in two contributions: the interaction between uncharged molecular bodies, which we refer to as non-electrostatic contribution, and the interaction between charge monopoles. In the present work we ignore the cross-interactions between a charge monopole and a neutral body. However the chosen model proves to be sufficiently precise as it qualitatively captures the relevant feature of an increase of the ion density for an increasing solvent density. For example in the case of a liquid phase with density coexisting with a gas phase with density , the ion densities increase from in the gas to in the liquid.
In the Eq. (2), the non-electrostatic contribution to the fluid-fluid interaction is treated within random-phase approximation (RPA) based on the interaction pair potential between a fluid particle in cell and another one in cell . Here this interaction is assumed to be independent of the particle type and it is assumed to act only between nearest neighbors, i.e., between particles located in adjacent cells.
Finally, in Eq. (2) all electrostatic interactions, both wall-fluid and fluid-fluid, are accounted for by the electric field energy . The electric field entering is determined by Neumann boundary conditions set by a uniform surface charge density at the walls of the wedge, planar symmetry far away from the wedge symmetry plane and global charge neutrality. Furthermore, the dielectric constant is assumed to be dependent on the solvent density. It is chosen to interpolate linearly between the values for vacuum () and water (). This linear interpolation has been previously shown to match the behavior of the dielectric constant in mixtures of fluids very well Kaatze and Woermann (1984). In addition it is important to note, that here the surface charge is not caused by the dissociation of ionizable surface groups, i.e., charge regulation as in Ref. Behrens and Grier (2001) is not relevant here, but it is assumed to be created by an external electrical potential, which is applied to the wall. One can imagine the wall being an electrode with the counter electrode being placed far from the wall inside the fluid.
II.3 Composition of the grand potential
Upon minimizing the density functional in Eq. (2) one obtains the equilibrium packing fraction profiles , which lead to the equilibrium grand potential of the system. This equilibrium grand potential can be decomposed into three contributions:
| (6) |
The first contribution with the pressure and the fluid volume equals the bulk energy contribution. It corresponds to the grand potential of an equally-sized system completely filled with the uniform gas bulk state. The second term with the interfacial tension and the total wall area corresponds to the quasi-one-dimensional case of the gas being in contact with a planar wall. The third contribution with the line tension and the length of the wedge is the only contribution to the total grand potential, where the influence of the wedge enters, and it is therefore of particular importance in the present work.
III Results
III.1 Bulk phase diagram
In the bulk region, far from any confinements, the densities of the three fluid components become constant, and, due to local charge neutrality, . This simplifies the density functional in Eq. (2), and the Euler-Lagrange equations read
| (7) |
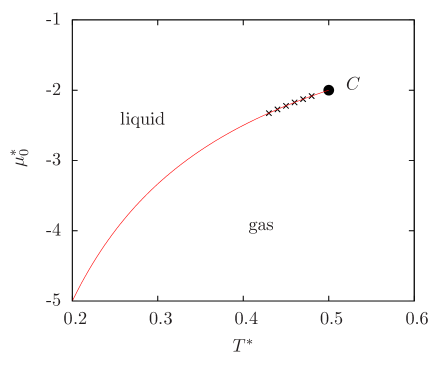
where is proportional to the strength of the fluid-fluid interaction . For the ion-free case the liquid-gas coexistence line is given by the analytical expression (see solid red line in Fig. 2). For fixed but non-vanishing ionic strengths the liquid-gas coexistence lines have been calculated numerically (see the black crosses in Fig. 2). Whereas the deviations from the ion-free case are only marginal in the bulk phase diagram for all ionic strengths considered here, it is of major importance to determine the coexistence conditions precisely, because surface and line properties (see Eq. (6)) are highly sensitive to them.
III.2 Electrolyte wetting on a planar wall
Before studying the filling behavior of a wedge, it is important to study the wetting of a planar wall because the results enter as the surface contributions to the total grand potential Eq. (6) and the quasi-one-dimensional packing fraction profiles provide the boundary conditions far away from the wedge symmetry plane. In the case of a planar wall the density functional simplifies to a quasi-one-dimensional one and, due to the corresponding relations (see Fig. 1), the expression Eq. (5) for the fluid-wall interaction becomes
| (8) |
With this set of equations one can determine the equilibrium packing fraction of the fluid close to the planar wall, where the integer index denotes the distance of the cell from the wall.
One possibility to characterize wetting of a planar wall is by means of the excess adsorption
| (9) |
with the total packing fraction of the gas phase at liquid-gas coexistence for the given temperature , which measures the additional amount of particles in excess to the gas bulk phase due to the presence of the wall. Alternatively, one can consider the film thickness
| (10) |
with the total packing fraction of the liquid phase at liquid-gas coexistence for the given temperature , which corresponds to the thickness of a uniform liquid film of packing fraction with the same excess adsorption as the equilibrium total packing fraction profile .
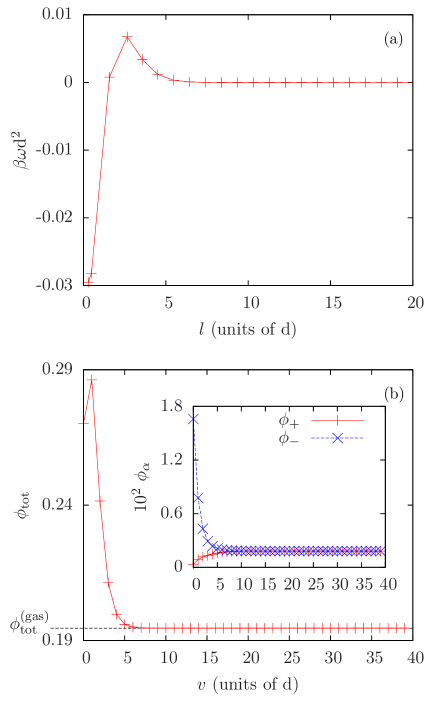
Minimizing the grand potential functional Eq. (2) for a planar wall (see Eq. (8)) with the constraint of fixed excess adsorption , Eq. (9), or fixed film thickness , Eq. (10), and subtracting the bulk contribution of the grand potential as well as the wall-liquid and the liquid-gas interfacial tensions ( and , respectively), one obtains the effective interface potential Dietrich (1988). An example for is displayed in Fig. 3(a). The position of the minimum of the effective interface potential corresponds to the equilibrium film thickness. The corresponding equilibrium total packing fraction profile for the parameters chosen in Fig. 3(a) is shown in Fig. 3(b).
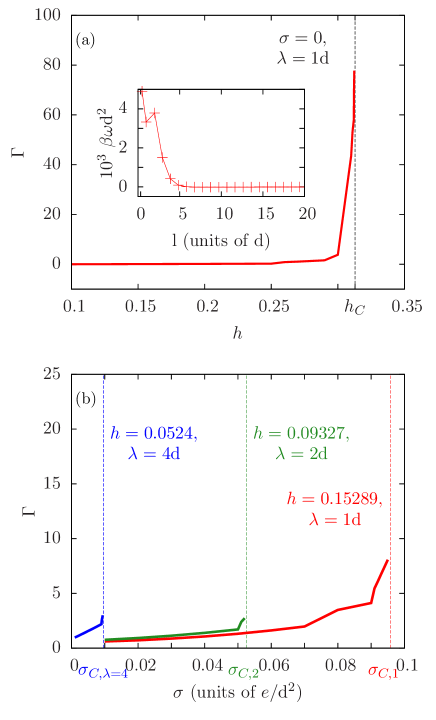
Using this procedure, one can determine the equilibrium density profiles for different ionic strengths , temperatures , wall-fluid interaction strengths , decay lengths , and surface charge densities . Figure 4(a) displays the equilibrium excess adsorption as function of the wall-fluid interaction strength for surface charge density and decay length . Due to the vanishing surface charge, the packing fraction profiles of the two ion species are identical, , hence the fluid is locally charge neutral and the electrostatic energy in Eq. (2) vanishes. Therefore, due to the small number densities of the ions, this case is similar to an ion-free system, where a wetting transition is caused by an increase of the non-electrostatic wall-fluid interaction strength (see Eq. (8)) up to a critical value . In contrast, Fig. 4(b) shows the excess adsorption for different sets of the wall-fluid interaction strength and the decay length as function of the surface charge density . The values of are chosen in such a way, that the three respective decay lengths lead to the same values of the volume integrals of the corresponding wall-fluid interaction potentials,
| (11) |
Here, the wall charge is varied and a wetting transition is observed at a critical value .
All four setups in Fig. 4 exhibit the characteristics of first-order wetting transitions, which are identified by finite limits of upon or . In addition for all these cases the first-order nature has been verified by studying the effective interface potential (see inset in Fig. 4(a)), which is clearly manifested by the energy barrier separating the local and the global minimum. For the quasi-ion-free case in Fig. 4(a) the choice Eq. (4) of the molecular pair potential of the wall-fluid interaction leads to a wetting transition of first order, in contrast to the choice of the nearest neighbor potential in Ref. Ibagon et al. (2013), which generates a second-order wetting transition. However, it has been shown that for (see Fig. 4(b)) wetting transitions are of first order once the Debye length is larger than the bulk correlation length Ibagon et al. (2014).
III.3 Wedge wetting by an electrolyte solution
Having studied the system under consideration in the bulk (Sec. III.1) and close to a planar wall (Sec. III.2), one can investigate wedge-shape geometries. As explained in the context of Eq. (1), the system undergoes a filling transition for the opening angle (see Fig. 1) approaching the critical opening angle from above. For the wedge is macroscopically filled by liquid, whereas for the wedge is macroscopically empty. In the following, the filling of an empty wedge, i.e., , will be studied.
Following Eq. (1), the critical opening angle can be calculated from the contact angle of the liquid, which is related to the depth of the minimum of the effective interface potential by Dietrich (1988)
| (12) |
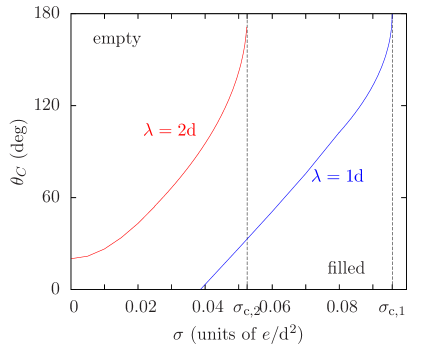
with the liquid-gas surface tension . Hence, the critical opening angle can be inferred from the wetting properties of a planar wall using the method of Sec. III.2. Figure 5 displays the critical opening angle as function of the wall charge for the case of decay lengths . As the contact angle decreases upon increasing the wall charge due to the electrowetting effect Bier and Ibagon (2014), the critical opening angle increases with increasing wall charge. For the critical wall charge the critical opening angle reaches the value of , since for this wall charge the wetting transition of the planar wall occurs (compare Fig. 4(b)), i.e., for a planar wall the wetting and the filling transition are identical.
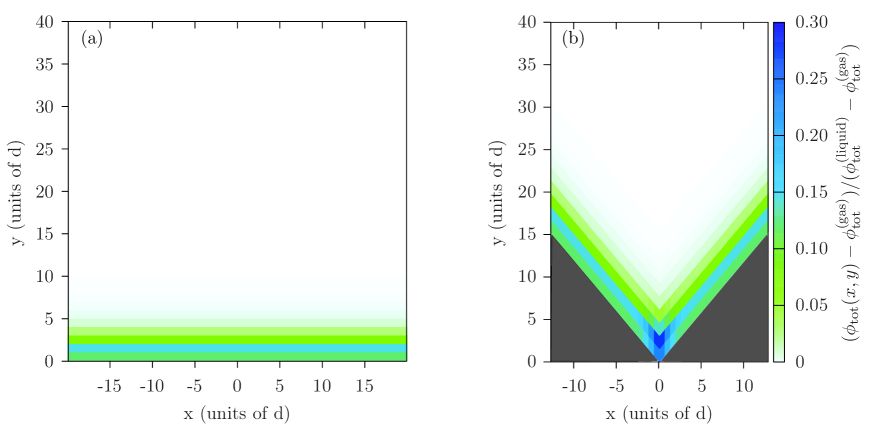
Figure 6 displays the equilibrium packing fraction profiles inside wedges with opening angles (Fig. 6(a)) and (Fig. 6(b)) with the parameters , , and identical to those of Fig. 3(b). Away from the wedge symmetry plane the structure rapidly converges towards that of a planar wall, which verifies the chosen size of the numerical grid being sufficiently large to capture all interesting effects. Furthermore, the decrease of the opening angle, as shown in Fig. 6(b), leads to an increase of the density close to the tip of the wedge. For example the maximal density increases from of the relative density difference between liquid and gas density to almost . However, the increase in the density is limited to the close vicinity of the tip of the wedge, which is an indication of first-order filling transitions. In fact, in the presence of ions, wetting transitions at a planar wall are of first order with a barrier in the effective interface potential (see Fig. 3(a)) being present for all states below the wetting transition of a planar wall Ibagon et al. (2014). Hence filling transitions of wedges are expected to be of first order, too Parry et al. (2000, 2001).
In order to describe the filling transition of a wedge quantitatively, several quantities have been studied. Firstly the wedge adsorption
| (13) |
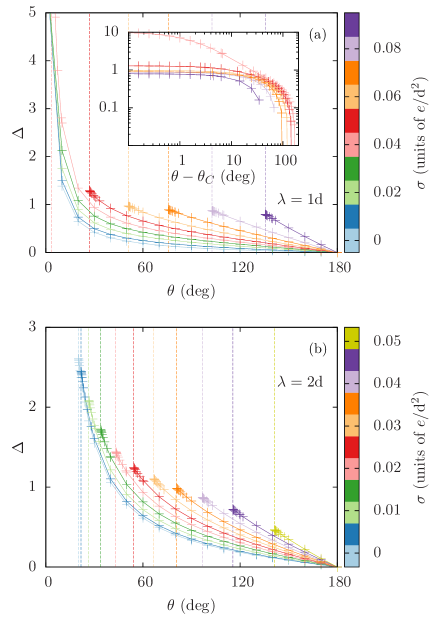
with the length of the wall shall be discussed. In the spirit of the excess adsorption at a planar wall (Eq. (9)), this quantity measures the excess of an inclined wedge above the excess adsorption of a planar wall. In Fig. 7 the wedge adsorption is shown as function of the opening angle and of the wall charge density for decay lengths (Fig. 7(a)) and (Fig. 7(b)). The ionic strength is and the wall-fluid interaction strength has been chosen as in Fig. 4(b). Upon decreasing the opening angle the wedge adsorption increases, regardless of the wall charge density , the decay length , or the non-electrostatic wall-fluid interaction strength . However, the limits of upon approaching the filling transition, , are finite, which signals a first-order filling transition (see in particular the inset of Fig. 7(a)). Moreover, for any fixed opening angle , the wedge adsorption increases with increasing wall charge density . Both observations can be understood in terms of the strength of the interaction between wall and fluid. In case of an increasing wall charge density , the increase of stems from an increase of the counterion density which is stronger than the accompanying decrease of the coion density. This phenomenon is well-known for non-linear Poisson-Boltzmann-like theories as the present one. For the case of a decreasing opening angle the growing overlap of the wall-fluid interactions, both the non-electrostatic as well as the electrostatic one, leads to an increase in the density.
Besides these general qualitative trends there are quantitative differences for the two cases in Fig. 7, which differ in the values of the decay length . One way to compare Figs. 7(a) and 7(b) is to consider the limits upon for a common value of the wall charge density . In this case, the shorter-ranged wall-fluid interaction, (see Fig. 7(a)), leads to higher values of than the longer-ranged one, (see Fig. 7(b)). However, since shorter decay lengths lead to smaller critical opening angles (see Fig. 5), which correspond to stronger overlaps of the wall-fluid interactions of the two walls of the wedge, an increase in the wedge adsorption is caused mostly for geometrical reasons. Alternatively, if one compares Fig. 7(a) and 7(b) for a fixed opening angle and a fixed wall charge density , the wedge adsorption is larger for the case of the longer-ranged wall-fluid interaction. This can be readily understood given the fact that, for fixed opening angle and wall charge, the interaction strength at a specific point in the system is the stronger the longer ranged the interaction is.
As a second quantity to describe the filling of a wedge the filling height
| (14) |
is considered, where denotes the excess adsorption along the symmetry plane (cell index ) of the wedge:
| (15) |
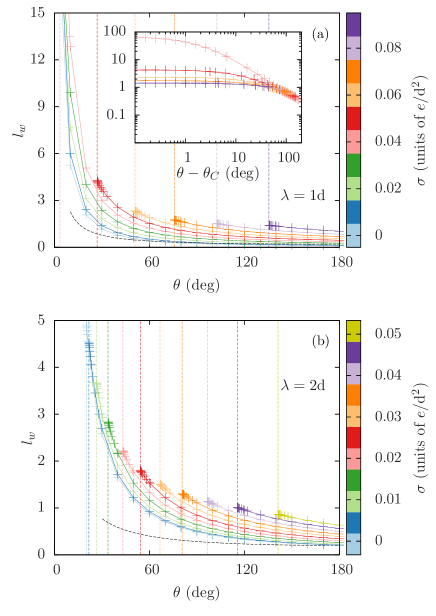
The definition of the filling height of a wedge is similar to that of the film thickness at a planar wall (see Eq. (10)). It expresses the distance of the liquid-gas interface of the adsorbed film from the tip of the wedge. Figure 8 displays the filling height as function of the opening angle and of the wall charge with the decay lengths in Fig. 8(a) and in Fig. 8(b). When discussing the filling height one has to account for the geometrical effect of an increasing side length of the elementary parallelograms in the direction of the symmetry plane (see Fig. 1) upon decreasing the opening angle . It is equivalent to a filling height of exactly one cell and it is displayed in Fig. 8 as a black dashed curve. By comparing the filling height with the trend given by the side length one infers a stronger increase of the former upon approaching the filling transition , which can be attributed to the filling effect. Similar to the wedge adsorption , the filling height increases either upon decreasing the opening angle towards the critical opening angle or, for fixed , upon increasing the magnitude of the wall charge density . The reason for these observed trends of the filling height is again, as for the wedge adsorption , a consequence of the increased magnitude of the wall-fluid interaction. Finally, the filling height , as the wedge adsorption, approaches a finite limit upon , which is in agreement with the expectation of a first-order filling transition.

As shown in Eq. (6), the equilibrium grand potential may contain a contribution scaling proportional to a linear extension of the system and the corresponding coefficient of proportionality of the dimension of an energy per length is called the line tension . In the present context of a wedge, the line tension measures the structural difference between a wedge and a planar wall, and the contribution scales with the length of the wedge along the -direction.
Figure 9 displays the line tension as function of the opening angle and of the wall charge density for decay lengths (Fig. 9(a)) and (Fig. 9(b)). The qualitative dependence of the line tension on the opening angle turns out to depend on the wall charge density : For small wall charge densities the line tension is negative and it decreases monotonically with decreasing opening angle. For sufficiently large wall charge densities the line tension is positive for large opening angles and, if the critical opening angle is small enough, negative for small opening angles, i.e., the line tension may depend non-monotonically on the opening angle. For molecular length scales and room temperature the order of magnitude of the line tension is in accordance with literature Ibagon et al. (2016); Getta and Dietrich (1998); Dussaud and Vignes-Adler (1997).
IV Conclusions and summary
In the present work the filling of charged wedges by electrolyte solutions has been studied within microscopic classical density functional theory of a lattice model (Fig. 1). As in previous studies Ibagon et al. (2013, 2014, 2016), considering lattice models offers technical advantages over continuum models, as the former allow for the explicit description of larger parts of the system. The electrolyte solution comprises a solvent and a univalent salt. A short-ranged attractive interaction between the fluid particles leads to a liquid-gas phase transition of the bulk electrolyte solution (Fig. 2). A fluid-wall interaction derived from a Gaussian pair potential (Eq. (4)) gives rise to first-order wetting transitions of a planar wall in contact with a gas bulk phase (Figs. 3). This first-order wetting transition of a planar wall can be driven by the wall-fluid interaction strength or by the surface charge density (Fig. 4). The critical opening angle, below which the wedge is filled, depends on the surface charge density and on the decay length of the wall-fluid interaction (Fig. 5). Upon approaching the critical opening angle from above, a macroscopically small but microscopically finite amount of fluid is accumulated close to the apex of the wedge (Fig. 6). This observation as well as the finite limits of the wedge adsorption (Fig. 7), the filling height (Fig. 8), and the line tension (Fig. 9) are compatible with a first-order filling transition. Upon increasing the surface charge density, the line tension as function of the opening angle changes from a monotonically increasing negative function via a function exhibiting a positive maximum to a monotonically decreasing positive function (Fig. 9).
The unequivocally first-order filling transitions found within the model of the present work are in full agreement with the general expectation for systems with barriers in the effective interface potential at the filling transition Parry et al. (2000, 2001). Moreover, this is expected to be the case for any electrolyte solution not too close to a critical point, as such systems exhibit barriers in the effective interface potential for all conditions of partial wetting Ibagon et al. (2014). Therefore, the optimistic point of view in Ref. Malijevskỳ and Parry (2013) expecting the experimental accessibility of systems displaying critical filling transitions requires to exclude the vast class of dilute electrolyte solutions as potential candidates. On the other hand, being assured of the first-order nature of filling transitions in the presence of electrolyte solutions allows one to numerically efficiently set up more realistic models, which are not restricted to a lattice for technical reasons, to quantitatively describe wetting and filling of complex geometries.
References
- Lin (2011) B. Lin, ed., Microfluidics (Springer, Berlin, 2011).
- Vogel (2012) N. Vogel, Surface Patterning with Colloidal Monolayers (Springer, Berlin, 2012).
- Nee (2015) A. Y. C. Nee, ed., Handbook of Manufacturing Engineering and Technology (Springer, London, 2015).
- Wen and Dušek (2017) M. Wen and K. Dušek, eds., Protective Coatings (Springer, Cham, 2017).
- Galindo-Rosales (2018) F. J. Galindo-Rosales, ed., Complex Fluid-Flows in Microfluidics (Springer, Cham, 2018).
- Dietrich (1988) S. Dietrich, in Phase transitions and critical phenomena, Vol. 12, edited by C. Domb and J. Lebowitz (Academic Press, London, 1988) p. 1.
- Schick (1990) M. Schick, in Liquids at interfaces, edited by J. Charvolin, J. Joanny, and J. Zinn-Justin (North-Holland, Amsterdam, 1990) p. 415.
- Dietrich and Napiórkowski (1991) S. Dietrich and M. Napiórkowski, Phys. Rev. A 43, 1861 (1991).
- Lüth (2015) H. Lüth, Solid Surfaces, Interfaces and Thin Films (Springer, Berlin, 2015).
- Checco et al. (2014) A. Checco, B. M. Ocko, A. Rahman, C. T. Black, M. Tasinkevych, A. Giacomello, and S. Dietrich, Phys. Rev. Let. 112, 216101 (2014).
- Pomeau (1986) Y. Pomeau, J. Colloid Inteface Sci. 113, 5 (1986).
- Hauge (1992) E. H. Hauge, Phys. Rev. A 46, 4994 (1992).
- Napiórkowski et al. (1992) M. Napiórkowski, W. Koch, and S. Dietrich, Phys. Rev. A 45, 5760 (1992).
- Napiórkowski et al. (1994) M. Napiórkowski, W. Koch, and S. Dietrich, Ber. Bunsenges. Phys. Chem. 98, 411 (1994).
- Parry et al. (1999) A. O. Parry, C. Rascón, and A. J. Wood, Phys. Rev. Lett. 83, 5535 (1999).
- Rejmer et al. (1999) K. Rejmer, S. Dietrich, and M. Napiórkowski, Phys. Rev. E 60, 4027 (1999).
- Parry et al. (2000) A. O. Parry, C. Rascón, and A. J. Wood, Phys. Rev. Lett. 85, 345 (2000).
- Parry et al. (2001) A. O. Parry, C. Rascón, and A. J. Wood, Fluid Phase Equil. 185, 139 (2001).
- Malijevskỳ and Parry (2013) A. Malijevskỳ and A. O. Parry, Phys. Rev. Lett. 110, 166101 (2013).
- Malijevskỳ and Parry (2015) A. Malijevskỳ and A. O. Parry, Phys. Rev. E 91, 052401 (2015).
- Baratian et al. (2015) D. Baratian, A. Cavalli, D. van den Ende, and F. Mugele, Soft Matter 11, 7717 (2015).
- Ibagon et al. (2014) I. Ibagon, M. Bier, and S. Dietrich, J. Chem. Phys. 140, 174713 (2014).
- Ibagon et al. (2013) I. Ibagon, M. Bier, and S. Dietrich, J. Chem. Phys. 138, 214703 (2013).
- Ibagon et al. (2016) I. Ibagon, M. Bier, and S. Dietrich, J. Phys.: Condens. Matter 28, 244015 (2016).
- Evans (1979) R. Evans, Adv. Phys. 28, 143 (1979).
- Kaatze and Woermann (1984) U. Kaatze and D. Woermann, J. Phys. Chem. 88, 284 (1984).
- Behrens and Grier (2001) S. H. Behrens and D. G. Grier, J. Chem. Phys. 115, 6716 (2001).
- Bier and Ibagon (2014) M. Bier and I. Ibagon, Phys. Rev. E 89, 042409 (2014).
- Getta and Dietrich (1998) T. Getta and S. Dietrich, Phys. Rev. E 57, 655 (1998).
- Dussaud and Vignes-Adler (1997) A. Dussaud and M. Vignes-Adler, Langmuir 13, 581 (1997).