A precessing Be disk as a possible model for occultation events in GX 3041
Abstract
We report on the RXTE detection of a sudden increase in the absorption column density, , during the 2011 May outburst of GX 3041. The increased up to atoms cm-2, which is a factor of 3–4 larger than what is usually measured during the outbursts of GX 3041 as covered by RXTE. Additionally, an increase in the variability of the hardness ratio as calculated from the energy resolved RXTE-PCA light curves is measured during this time range. We interpret these facts as an occultation event of the neutron star by material in the line of sight. Using a simple 3D model of an inclined and precessing Be disk around the Be type companion, we are able to qualitatively explain the evolution over time. We are able to constrain the Be-disk density to be on the order of g cm-3. Our model strengthens the idea of inclined Be disks as origin of double-peaked outbursts as the derived geometry allows accretion twice per orbit under certain conditions.
keywords:
X-rays: binaries – stars: Be – stars: neutron – occultations – pulsars: individual: GX 30411 Introduction
The H emission line observed in the optical spectra of many B-stars is believed to originate from a circumstellar disk (see, e.g., Hanuschik, 1996). The H line profile in these stars often shows a double-peaked structure due to intrinsic rotation of the disk. These emission features are denoted with an “e” in the stellar spectral type, which is why these stars are known as Be stars. The Be-star disks are supposed to form by the viscous diffusion of gas ejected from the central star (Lee et al., 1991). They are geometrically thin and rotating at Keplerian velocities (see Rivinius et al., 2013, for a recent review).
Circumstellar disks around main-sequence stars have been proposed to explain the transient nature of some X-ray binaries (Rappaport et al., 1978). In these so-called Be X-ray binaries (BeXRBs) a compact object is on a wide and eccentric orbit around a Be-type companion star. Around the periastron passage mass transfer from the Be-star disk becomes possible, which results in a sudden and luminous X-ray outburst. Furthermore, the Be disk in BeXRBs is tidally truncated at a certain resonance radius due to the presence of the orbiting neutron star (Reig et al., 1997; Negueruela & Okazaki, 2001; Okazaki et al., 2002). This truncation leads to higher surface densities of BeXRB-disks compared to disks around isolated stars (Okazaki et al., 2002, in agreement with findings by Zamanov et al. 2001). However, Zamanov et al. (2001) have drawn this conclusion based on measurements of H equivalent widths and the peak separation of the line profile.
BeXRBs offer the opportunity to measure directly the Be-disk density independently of other energy ranges such as optical wavelengths. The particle density in the line of sight determines the absorption of X-rays at energies below 10 keV. As the X-ray line of sight is fixed to the neutron star, which moves along its orbit, the particle density around the Be star can be probed.
The BeXRB GX 3041, detected in 1967 by a balloon experiment (Lewin et al., 1968), consists of a shell Be-star of type B2Vne (Mason et al., 1978; Parkes et al., 1980) or B0.7Ve (Liu et al., 2006) and a neutron star which shows X-ray pulsations around 272 s (McClintock et al., 1977). It is located at a distance of 2.4(5) kpc (Parkes et al., 1980) probably behind the Coalsack Nebula, a dark molecular cloud on the Southern sky at a distance of pc (see Nyman, 2008, and references therein).
GX 3041 often remained in states of quiescence as, e.g., between 1980 and 2008. On the other hand, it showed regular outbursts previously with intervals of 132.5(4) d as found by Priedhorsky & Terrell (1983), who interpreted this periodicity as the orbital period of the system. This makes GX 3041 a prime example of sources with a highly unpredictable outburst behaviour (Manousakis et al., 2008; Klochkov et al., 2012). The source again underwent regular outbursts in late 2009 until mid 2013. Recently, Sugizaki et al. (2015) confirmed the orbital period to be d based on the outburst spacing in the MAXI-GSC light curves during this series. Together with pulse frequency measurements by Fermi-GBM (Finger et al., 2009) they derived the remaining orbital parameters of GX 3041 (see Table 1).
In rare cases BeXRBs undergo so-called double-peaked outbursts, where two consecutive outbursts can be observed, which are not separated by the usually observed phase of quiescence. In order to explain the observed double-peaked outbursts of GX 3041 in 2012, Postnov et al. (2015) proposed that the Be disk is probably inclined with respect to the orbital plane. This is in line with smoothed particle hydrodynamic (SPH) simulations performed by Okazaki et al. (2013), who concluded that the occurrence of so-called “giant” type II X-ray outbursts are probably triggered by a misaligned Be disk.
| Orbital period, (d) | |
|---|---|
| Projected semi-major axis, (lt-s) | |
| Eccentricity, | |
| Time of periastron passage, (MJD) | |
| Longitude of periastron, (∘) | = |
This paper is based on the spectral results of the accompanying paper by Rothschild et al. (2017, hereafter R17), who analysed 72 RXTE observations taken during four outbursts between March 2010 and May 2011. Here, we particularly focus on the evolution of the absorption column density, , over time. The paper is organized as follows: in Section 2 we briefly describe the data reduction process performed by R17. Section 3 gives a summary and discussion of their spectral results, which are then modelled by a simple 3D-model of a precessing Be disk in Sect. 4. We present our conclusions in Sect. 5.
2 Observations and Data Reduction
2.1 Observations
RXTE has observed GX 3041 during four outbursts in 2010 and 2011 (see Fig. 1a). In total, 72 individual observations are available with exposure times from a few 100 s up to 18 ks each. The corresponding observation IDs and further basic informations about each observation can be found in R17 Tab. 1. The exposure times of three observations were less than the GX 3041’s pulse period of 272 s (McClintock et al., 1977). These observations have been excluded from the spectral analysis, which focuses on pulse phase averaged spectra.
2.2 Data Reduction
The data reduction process and the spectral results analysed further in Section 3 are the same as in R17. In the following a brief summary of the data reduction is given.
The Proportional Counter Array (PCA; Jahoda et al., 2006) onboard RXTE consisted of five identical Proportional Counter Units (PCU0–5). For spectral analysis only data from the top layer of PCU2 have been extracted since this PCU is known to be the best calibrated one (Jahoda et al., 2006). We used the tools distributed by HEASOFT v6.18 in order to extract spectra and lightcurves using the standard2f data mode. We avoided PCU2-events up to 30 minutes from the start of the previous passage of the South Atlantic Anomaly and for elevation angles smaller than above the Earth’s limb. Due to the high count rate of GX 3041 during many of the 72 observations we used 0.5 as the highest accepted value for the electron ratio. For spectral analysis the energy range of 3–60 keV range has been used and no further spectral binning was applied. Due to the high quality of the PCA-spectra during a few observations, we had to add systematic uncertainties of 0.5% at channel energies 15 keV and of 1.5% at higher energies in order to achieve a reduced , , near unity (see R17 for the affected ObsIDs). The PCU2 light curves were extracted with a 16 s time resolution in the detector channels 4–15 and 15–60 (corresponding to the energy bands 2.9–7.7 keV and 7.7–30.0 keV, respectively). These channels have been chosen such that the ratio of the light curves, i.e., a hardness ratio, provides a handle on X-ray absorption (see Sect. 3.2 for further details).
The High Energy X-ray Timing Experiment (HEXTE; Rothschild et al., 1998) is sensitive for X-ray photons between 15 and 250 keV and consisted of two identical clusters, HEXTE-A and -B. These clusters alternated between the on-source position and two background positions. This so-called “rocking” mechanism allowed one to simultaneously measure the X-ray source and background. Due to mechanical failures of this technique late in the mission, cluster A was fixed in the on-source position during all observations of GX 3041, while cluster B was fixed in one background position 1.5∘ off-source. In order to investigate background corrected spectra for GX 3041, we have extracted the source spectrum from cluster A and estimated its corresponding background from the background spectrum of cluster B using the hextebackest tool as described in Pottschmidt et al. (2006) and R17 Appendix A. The resulting HEXTE-spectra of GX 3041 have been analysed in the 20–100 keV energy range, no spectral binning was applied, and no systematic uncertainties have been added to the data.
3 Data Analysis
3.1 Absorption column density
We have used the Interactive Spectral Interpretation System (ISIS Houck & Denicola, 2000) v1.6.2-30 to perform a combined spectral analysis of the PCA- and HEXTE-spectra for each RXTE observation. We use the results of R17, who describe the RXTE spectra with two different continuum models. The cutoffpl model consists of a power-law in combination with a multiplicative exponential and an additional blackbody (CUTOFFPL BBODY). The second model highecut is a power-law continuum with an exponential roll-over, which sets in at higher photon energies (POWERLAW HIGHECUT). Both models take low energy X-ray absorption into account using the model TBnew111http://pulsar.sternwarte.uni-erlangen.de/wilms/research/tbabs/ which is and extended version of the model by Wilms et al. (2000) with interstellar element abundances. Here, the corresponding cross-sections were set to those of Verner et al. (1996). The emission lines of iron at 6.40 keV and 7.06 keV were modelled with Gaussians (GAUSS), and the cyclotron line known to be present in GX 3041 around 50–55 keV (Yamamoto et al., 2011) was described by a multiplicative Gaussian absorption component (GAUABS).
Furthermore, as discussed by R17 several systematic features are detectable in the RXTE spectra. Although the background for HEXTE-A can be estimated from HEXTE-B, the true background still differs from the estimated one. This results in four additional background lines at 30.17, 39.04, 53.0, and 66.64 keV, which we have modelled by additional Gaussian components. In some observations slight residuals in absorption are seen in PCA below 4.5 keV, which we attribute to an insufficient modelling of the Xenon L-edge and have modelled by a negative Gaussian fixed at 3.88 keV. A similar systematic feature appears at 10.5 keV for very high source fluxes, which we included in the model as well. Finally, we have introduced a flux calibration constant for HEXTE with respect to PCA and allowed the fit to adapt the background strength for both detectors (CORBACK in ISIS, which is similar to RECOR in XSPEC). A detailed discussion of these systematic features in the RXTE spectra, in particular the HEXTE background lines, is given in R17 Appendix C.
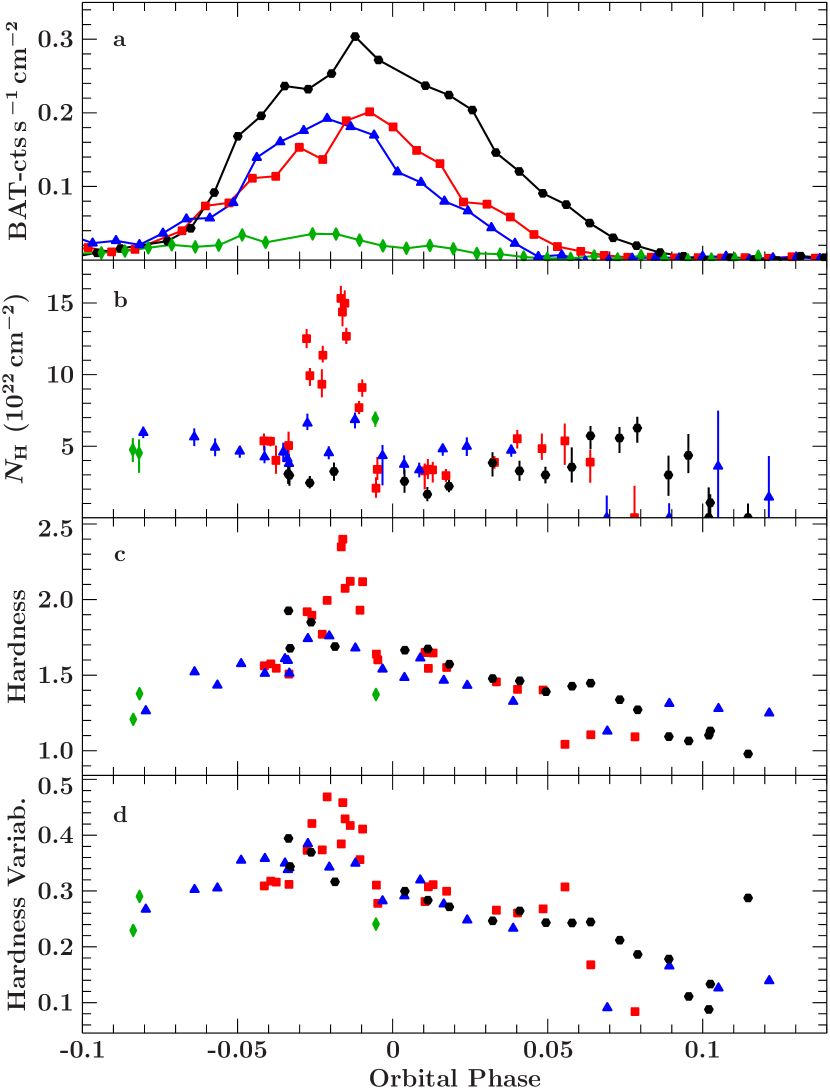
The resulting evolution of the spectral parameters, especially those of the power-law continuum and cyclotron line, for both continuum models (cutoffpl and highecut, see above) is presented in R17. In this work, we focus on the time evolution of the absorption column density, , which tracks the number of particles along the line of sight to the neutron star. As already noticed by R17 a large enhancement of the column density is detected during the 2011 May outburst (see Fig. 1b), where is about higher than what is usually observed in GX 3041 with RXTE. This enhancement event lasts for around 3 days until suddenly drops to the usual value. A weaker event () is also visible during the 2010 December outburst. This result is independent of the choice of continuum model (cutoffpl and highecut) and, thus, it is unlikely that the low energy continuum of the neutron star has been modelled improperly during these enhancement events. We will restrict the following discussions to the results of the cutoffpl model.
3.2 Light curve analysis
In order to confirm the enhancement in in an independent way of any phenomenological modelling of the X-ray spectra, we have investigated the energy resolved RXTE light curves of GX 3041. Since material in the line of sight results in absorption of X-ray photons at energies keV, the ratio between two light curves in different energy bands, a so-called hardness ratio, then tracks absorption variability without analyzing the full X-ray spectrum. We have computed the ratio of two PCA light curves (1 s time resolution) in the energy bands 2.9–7.7 keV and 7.7–30.0 keV. Due to the energy dependence of GX 3041’s pulse profile (see, e.g., Jaisawal et al., 2016), residual pulsations are still visible in the resulting hardness ratio over time, but the pulsed fraction is lower by a factor of 3–5 than compared to the individual light curves.
Figure 1c shows the resulting mean hardness ratio for each observation as determined from the energy resolved light curves. The hardness as defined via the energy bands given above is between 1.0 and 1.8 during most observations. At the same time when the enhancement in the absorption column density is observed during the 2011 May outburst (Fig. 1b), the hardness suddenly increases up to , i.e., by a factor of . Outside of the enhancement event the hardness is again consistent with the data from the other outbursts. This confirms the results of our spectral analysis.
We also found that the standard deviation of the hardness ratio over time during each observation (Figure 1d) shows a very similar increase by a factor of during the 2011 May outburst. We interpret this variability as evidence for inhomogeneities within the absorbing material in the line of sight, such as a clumpy wind (see, e.g., Hemphill et al., 2014).
4 Possible occultation by the Be disk
In order to investigate the origin of these enhancement events, we have used the orbital parameters by Sugizaki et al. (2015, see Table 1) to convert the date of each RXTE observation into an orbital phase. Figure 1b shows the measured absorption column density during all four outbursts over the resulting orbital phases. The two enhancement events nicely align between the orbital phases and , which is right before the periastron passage of the neutron star. In these events no significant flare was detected on top of the Swift-BAT light curve of GX 3041 (compare Fig. 1a), which is in agreement with the RXTE light curves (see Fig. 1 of R17, ). Thus, it is unlikely that the matter, which is responsible for the enhancement in , was accreted by the neutron star as this would result in an additional increase in X-ray luminosity.
From GX 3041’s orbital parameters we can estimate the dimension of the cloud of material within the line of sight. Assuming that the material is stationary and neglecting the eccentricity of the neutron star’s orbit, we find lt-s as the dimension of the cloud with the duration d of the enhancement event in 2011 May. Such small scale density fluctuations are not expected in a molecular cloud such as the Coalsack Nebula. Thus, the cloud of material has to be located within the GX 3041 system. The enhancement event took place right before the periastron passage of the neutron star. The location of the periastron within the binary system is determined by its longitude, (see Table 1), which means that this point, as seen from Earth, is behind the companion’s tangent plane of the sky. That is, the neutron star is farther away from Earth during the periastron passage than the Be companion. Thus, the X-ray line of sight, which is always fixed on the neutron star, might has passed through or behind the circumstellar material of the companion, such as its equatorial disk.
In this Section, we investigate the possibility of an occultation event of the neutron star by the Be disk. Therefore we introduce a simple 3D-model of a rigid Be disk with a physically motivated density profile and apply this model to the observed evolution.
4.1 Density profile of the Be disk
According to the viscous decretion disk scenario (Lee et al., 1991), Be disks are formed by viscous diffusion of gas ejected from the central star. They are Keplerian disks, radially supported by the rotation, and in hydrostatic equilibrium in the vertical direction, supported by the gas pressure. As the model of the Be disk in GX 3041, we assume for simplicity that the disk is isothermal at (Carciofi & Bjorkman, 2006). We also assume that the disk does not change over the X-ray activity period and its density profile, , is cylindrically symmetric, i.e., depending on the distance, , to the symmetry axis of the disk and the height, , above the disk plane:
| (1) |
where is the base density, i.e., the density at , is a constant that characterizes the radial density distribution (see, e.g., Okazaki et al., 2013), is the radius of the Be star, and is the vertical scale-height given by
| (2) |
where is the isothermal sound speed, with and being the mean molecular weight and the mass of the hydrogen atom, respectively, and is the Keplerian rotation velocity with the mass, , of the Be star. We adopt , , and K consistent with a B2Vne star (Parkes et al., 1980) and for fully ionized plasma with cosmic abundances. We fixed the density profile index as expected for a truncated disk as described in the following.
In a binary like GX 3041, the Be disk is thought to be truncated at a radius smaller than the binary separation at periastron. If the Be disk is coplanar with the binary orbital plane, the truncation occurs at a resonance radius, , which mainly depends on the orbital eccentricity and the disk viscosity (Negueruela & Okazaki, 2001; Okazaki & Negueruela, 2001). For instance, for the viscosity parameter and the above stellar and disk parameters for GX 3041, the disk is truncated at the 6:1 resonance radius (). If the Be disk is highly misaligned as we consider for GX 3041, however, it has a significantly larger radius than the coplanar disks, because of the weaker resonant torques, and is likely to fill the Roche lobe of the Be star (Lubow et al., 2015; Miranda & Lai, 2015). Given that there are large uncertainties in the viscosity parameter (according to Clark et al. 2001 and Wisniewski et al. 2010, , while Carciofi et al. 2012 assume ) and the misalignment angle, we examine the disk obscuration effect for two extreme disk cases, one truncated at the 6:1 resonance radius () and the other that fills the Roche lobe radius averaged over the binary orbit (). In the calculation of the latter radius, we applied the approximated formula by Eggleton (1983) to the averaged binary separation, , as
| (3) |
where is the binary mass ratio assuming the canonical neutron star mass of . For radii larger than the truncation radius, , we assume that the density distribution of the Be disk is
| (4) |
with the density at the truncation radius as calculated after Eq. 1. The constant leads to a faster decrease of the density profile than for radii and we assume , which is consistent with numerical results obtained by Okazaki et al. (2002).
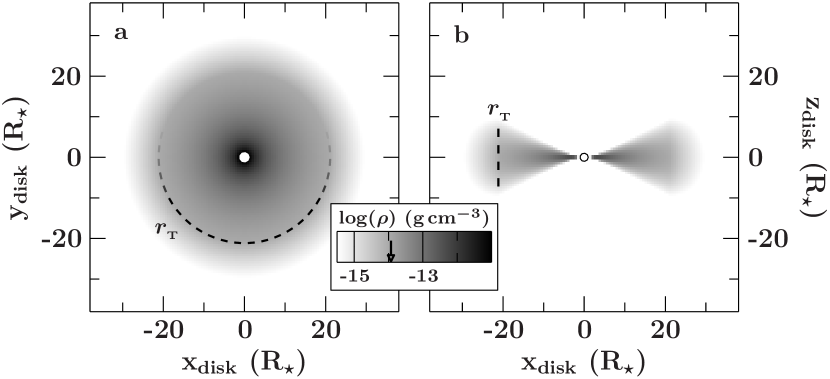
Figure 2 shows the radial (a) and height (b) dependence of the density profile as defined above in the case of with lt-s and .
4.2 Density along the X-ray line of sight
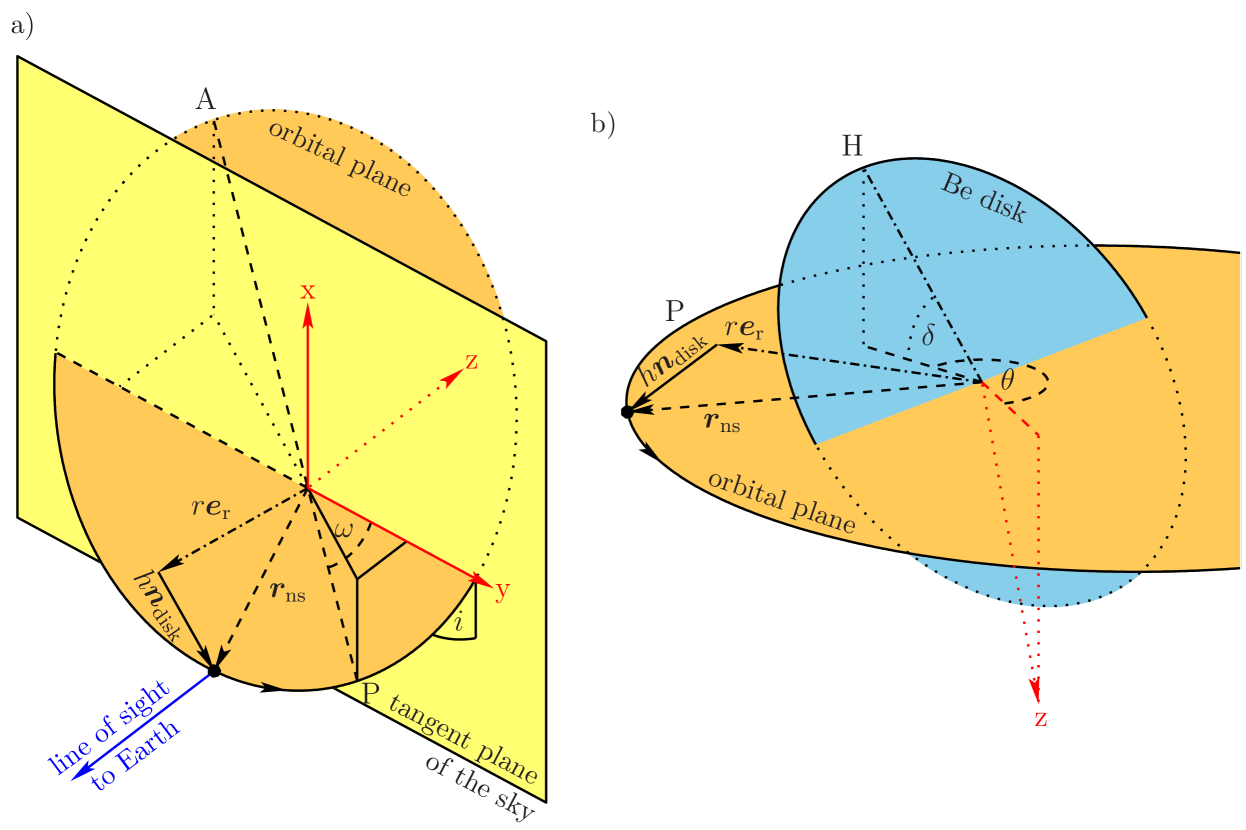
In order to calculate the absorption column density, , we need to transform the line of sight to the neutron star, given in the binary’s reference frame, into the Be-disk’s reference frame, i.e., into cylindrical coordinates. Figure 3 shows a sketch of the following definitions. We define the origin of the binary’s reference frame to be fixed at the position of the Be-type companion star. The xy-plane is equivalent to the tangent plane of the sky, i.e., the -axis is parallel to the line of sight to the companion and pointing away from Earth. The position of the neutron star on its orbit is found by solving Kepler’s equation,
| (5) |
for the eccentric anomaly, . Here, is the eccentricity of the orbit and
| (6) |
is the mean anomaly with the time of the observation, , the time of periastron passage, , and the orbital period, (see Table 1 for the orbital parameters of GX 3041). The position vector to the neutron star, , is then given by
| (7) |
with the rotation matrix, R, around the unit vector along the -axis, , and the angle with the inclination, , of the orbital plane with respect to the tangent plane of the sky. The semi-major axis, , is found using the measured value of , is the semi-minor axis, and is the argument of periastron.
In order to transform any vector in the binary’s reference frame into the reference frame of the Be disk with cylindrical coordinates (,), we first calculate the normal vector, , of the disk by taking the inclination of the orbit, , the misalignment angle of the disk, , and the position angle of the disk, , into account,
| (8) |
Here, , is the unit vector along the -axis (of the binary’s reference frame), and is the normal vector of the orbital plane,
| (9) |
Due to the fact that no enhancement event was detected in the earlier outbursts of 2010, the Be disk was not in the X-ray line of sight, while a strong occultation event occurred in 2011 May. A likely explanation is that the Be disk in GX 3041 is precessing. Since we expect the Be disk to precess in the retrograde direction compared to the orbital movement of the neutron star (Papaloizou & Lin, 1994; Papaloizou & Terquem, 1995), we calculate the position angle of the disk after
| (10) |
with the initial position angle at the time and the precession frequency, . Note that in the context of the binary’s reference frame defined above, the position angle, , is measured between the line of sight, , and the highest point of the disk, both projected onto the orbital plane (see Fig. 3). Finally, the transformation, , of any vector, r, given in the binary’s reference frame into the cylindrical coordinates of the reference frame of the Be disk is
| (11) |
| Be-star radius | (fixed) | |
| Be-star mass | (fixed) | |
| Be-disk temperature | K | (fixed) |
| Be-disk truncation radius (see text) | (fixed) | |
| Be-disk base density | ||
| Density profile index | (fixed) | |
| Density profile index (truncated) | (fixed) | |
| Orbital parameters (see Table 1) | , , , , | (fixed) |
| Orbit inclination | ||
| Be-disk inclination | ||
| Be-disk position angle at | ||
| Be-disk precession frequency | ||
| Precession reference time | (fixed) | |
| Foreground absorption |
The absorption column density is finally found by computing the integral of the Be-disk density, (Eqs. 1–4), along the line of sight, i.e., along the -axis up to the neutron star’s position:
| (12) |
Here, accounts for constant interstellar foreground absorption. Table 2 summarizes the fixed and free parameters of the full model.
4.3 Modelling the observed absorption column densities
Initial attempts to apply the model defined in Eq. 12 to the observed evolution over time shown in Fig. 1b revealed several issues. First, finding the best-fit using a commonly used -minimization is complicated by several local minima within the -landscape, where the actual observed enhancement event in 2011 May is not modelled at all. Furthermore, is much larger than unity even during outbursts where no occultation event is detected due to a significant scattering of the observed values (see discussion below). Finally, from the calculation of the disk’s normal vector, (Eq. 8), we expect a parameter degeneracy between the orbit inclination, , and the Be-disk inclination, .
In order to solve these issues, we applied a Bayesian analysis of the model to the evolution in form of a Markov chain Monte Carlo (MCMC) sampling approach after Goodman & Weare (2010). We used the emcee algorithm as implemented by Foreman-Mackey et al. (2013) and ported into ISIS by M.A. Nowak, which is distributed via the ISISscripts222http://www.sternwarte.uni-erlangen.de/isis. The advantages of this approach are that parameter degeneracies are automatically error propagated and the algorithm always provides the most probable answer even in cases of a bad goodness of the fit. The result of an emcee run is the probability distribution for each free parameter of the model used. The most probable parameters, i.e., the best-fit parameters, correspond to the maxima found in the probability distributions. These are sampled by so-called walkers, which move within the parameter space and are distributed uniformly at the beginning.
For each possible truncation radius ( or 0.29, see Sect. 4.1), we have performed an emcee run with 1 000 walkers per free parameter and 10 000 iteration steps. The resulting parameter chains were investigated on convergence, i.e, the acceptance rate is stable around 0.25 after iteration steps, which is in the range of 0.2–0.5 as expected in convergence (Foreman-Mackey et al., 2013). Thus, we ignored the first 500 iteration steps in the following analysis of the parameter distributions.
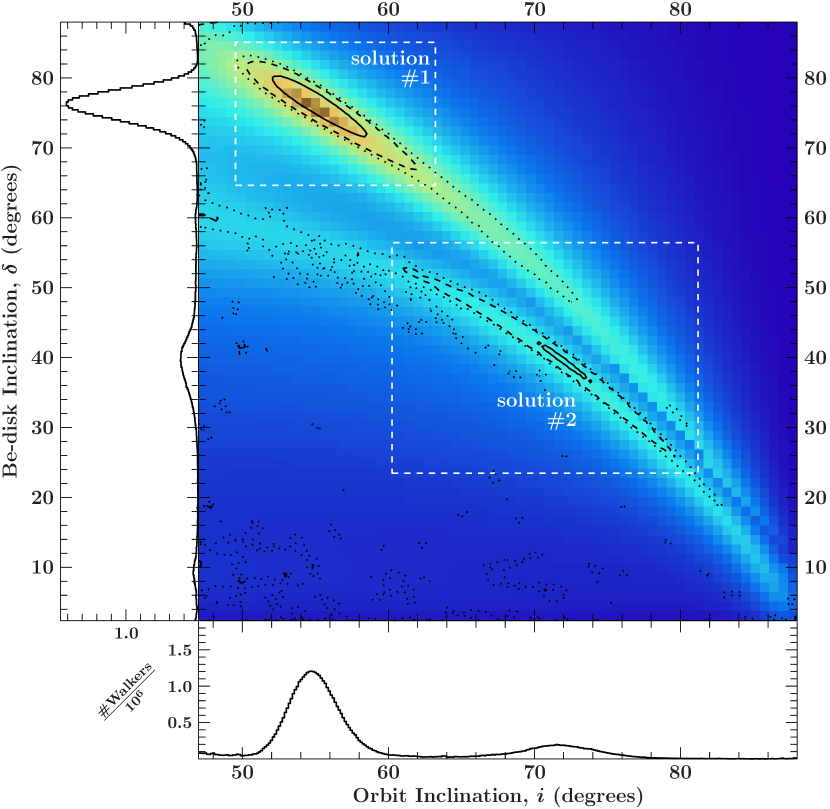
Almost all probability distributions, which are found by sorting the corresponding parameter chain into a histogram, show two or three distinct maxima, i.e., multiple possible solutions. These solutions are best seen in the 2D-probability distribution (i.e., similar to a contour map) between the orbit inclination, , and the Be-disk inclination, . Figure 4 shows this distribution for a Be-disk truncation radius of . The peak with the highest probability (solution #1) corresponds to a high disk misalignment angle, , and a moderate orbit inclination, , while its the other way around for the second highest peak (solution #2). Furthermore, the degeneracy between these parameters as expected from Eq. 8 is visible as diagonal valleys in the figure. In the case of even a third solution appears (solution #3).
| [solution no.] | [#1] | [#2] | [#1] | [#2] | [#3] | |
|---|---|---|---|---|---|---|
| Parameter | (unit) | |||||
| (degree) | ||||||
| (degree) | ||||||
| (degree) | ||||||
| (degree yr-1) | ||||||
| g cm | ||||||
| (cm-2) | ||||||
| / d.o.f. | 252.03 / 63 | 303.11 / 63 | 313.08 / 63 | 290.51 / 63 | 307.33 / 63 | |
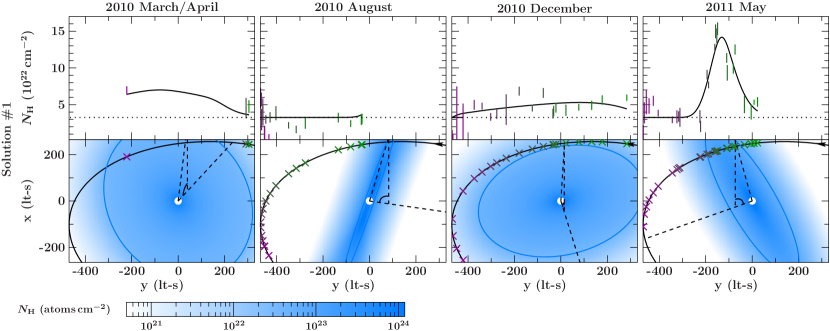
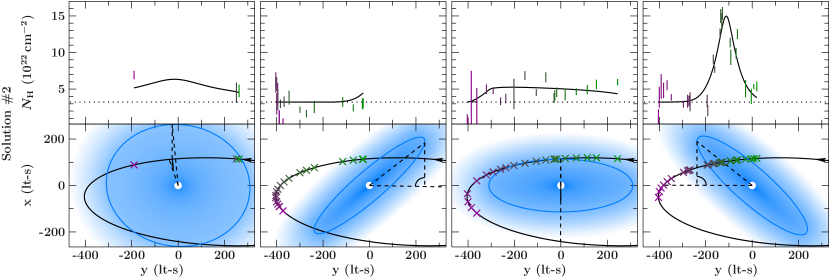
In order to reduce the influence of these solutions on the 1D-probability distributions, which are used to derive the parameter values and uncertainties, we have split the parameter chains into areas around each solution. Fig. 4 shows these areas for the case of . In this way, the number of peaks in the probability distribution of each parameter reduces to one, i.e., the solution is unique and we are able to provide the final parameter values for all possible solutions and the two extreme cases for the truncation radius. The most probable parameter value is found by determining the peak’s position using a polynomial fit around the maximum. The lower and upper confidence levels are determined such that 68% of the peak’s total area is within this confidence interval. Thereby, a linear continuum has been subtracted from the probability distribution in order to investigate the area of the peak only. Table 3 lists the resulting most probable parameters and uncertainties for each investigated truncation radius and solution found in the parameter space. For the case of , we compare in Fig. 5 the modelled evolution of for both solutions with the data. We also show the resulting geometries of the binary and Be disk projected onto the tangent plane of the sky, i.e., as seen from Earth.
5 Discussion & Conclusions
In this paper we have presented a study of the behaviour of GX 3041 during four outbursts in terms of an occultation by a precessing Be-star disk. The most probable parameters listed in Table 3 correspond to the different solutions discovered in the parameter space.
Formally, there are five solutions across the two truncation radii — two for and three for . However, these really reflect only three basic physical scenarios, which we refer to as solutions #1, #2, and #3. Solution #1 and #2 are found for both and , while Solution #3 only appears in the case. Solution #1 corresponds to a system with moderate orbital inclination and a highly-misaligned, high-density Be-disk which precesses relatively slowly. Solution #2 has a higher inclination, but a less-misaligned, lower-density Be-disk precessing more quickly. Finally, solution #3 has a very highly misaligned, very high-density Be-disk in a system with a precession frequency and inclination comparable to solution #1.
We have investigated additional truncation radii and found that the parameters of solutions #1 and #2 change nonlinearly with truncation radius. As the truncation radius is decreased, solution #3 migrates into the parameter space, starting at very high disk misalignment angles (the upper left corner in Fig. 4). Which solution is the most realistic cannot be decided easily, as discussed in the following.
The best nominal solution in terms of is a large Be disk with a high misalignment angle (, #1, first column in Table 3). From the statistical point of view this solution is, however, still not acceptable (). The unacceptable high values may have several reasons: first, our simple model assumes a rigid and cylindrically symmetric Be disk. In particular, we ignore any structures within the Be disk, such as warping and spiral density waves, which are known to be present due to the tidal interaction with the neutron star (see, e.g., Okazaki et al. 2002 and Martin et al. 2011). Such a behaviour might explain the observed scattering of the values, especially during the 2010 December outburst. Here, our most probable model suggests that the line of sight crosses the outermost parts of the Be disk near the truncation radius (Fig. 5), where the tidal effects are expected to be most prominent as discussed for the BeXRB 4U 0115634 by Negueruela & Okazaki (2001) and Reig et al. (2007) and for A0535+262 by Moritani et al. (2013). Secondly, the measurements itself might be influenced by systematic effects, such as the Xe L-edge, which R17 had to introduce in order to model calibration uncertainties in RXTE-PCA. Further evidence for these systematics is that the emcee runs prefer a large interstellar foreground absorption of . Although GX 3041 is located in direction of the Coalsack nebula, Suzaku observations during its 2010 August and 2012 January outbursts revealed (Jaisawal et al., 2016), which is consistent with the foreground absorption found in 21 cm surveys (Kalberla et al., 2005; Dickey & Lockman, 1990). Assuming a systematic uncertainty of to be consistent to these alternative foreground absorption measurements indeed results in a around unity. This does not, however, affect the significance of the occultation event in 2011 May.
We have found that the base density of the Be disk, , which is mainly determined by the measured values during the occultation event in 2011 May, is on the order of –. This result is in very good agreement with the commonly accepted value of (e.g., Okazaki et al., 2013) for disks of isolated Be stars. Although the Be disks in binaries are expected to be approximately twice as dense as compared to isolated stars (Zamanov et al., 2001), the solutions with densities significantly above would be unlikely, such as solution #3 with .
The precession period, , of solution #2 is about 30%–100% faster than that of solution #1. This difference decreases with increasing truncation radius. According to Larwood (1998), the precession period, , due to tidal forces on a misaligned disk is
| (13) |
with . Using the resulting disk misalignment angle, , of solution #1 for the truncation radius we find yr, which is longer than the emcee result of yr. Using other emcee solutions does not weaken this disagreement significantly. Since the material forming the Be disk originates from the central Be star, the disk’s precession might be induced by an intrinsically precessing Be star. This precession is the result of tidal forces on an oblate star such as a rapidly rotating Be star. Using the theoretical investigations by Kopal (1959) and Alexander (1976), we have estimated the precession period of the Be star in GX 3041 to be on the order of 5000 yr (see appendix A for the detailed calculation). This rules out Be star precession as the origin of the fast Be disk precession we have derived. However, in case of eccentric orbits, as usually present in BeXRBs, the eccentric Kozai-Lidov (KL) mechanism has to be taken into account for the torque on misaligned disks as calculated after Eq. 13. Following the formulation by Naoz et al. (2013) and Naoz (2016), we have numerically investigated the evolution of Be-disk particle orbits with initial radii between and and similar misalignment angles, , as listed in Table 3. As a result from the KL mechanism, the Be-disk particles precess much faster around the binary’s orbital momentum vector than compared to the circular approximation of Eq. 13. For a Be-disk radius of the precessing time-scale is yr and decreases to 4–5 yr for for all misalignment angles, which is in agreement with our best-fit within a factor of 2–3. A very similar time-scale was found in A 0535+262 by Moritani et al. (2013), who performed an optical spectroscopic monitoring of its Be-type companion star. From the measured radial velocity curve of an enhanced component in the H line profile, they have derived a period of d, which they interpret as the precession period of a warped Be-disk.
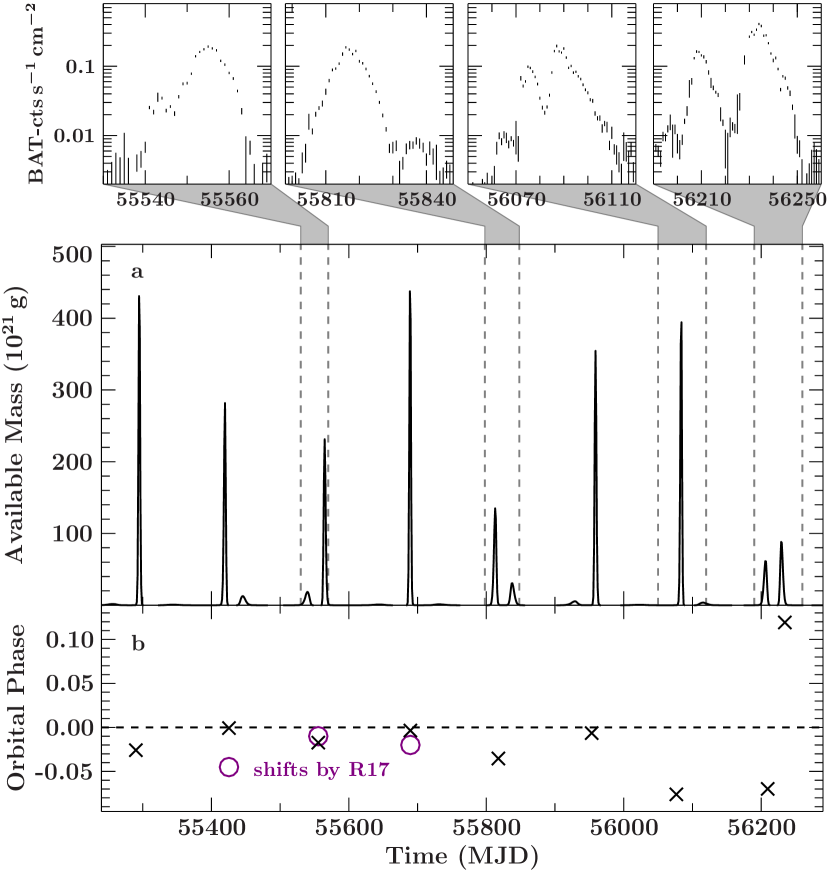
The misalignment angles of the Be disk found by our analysis are in the range of . The most probable solution (, #1) points, however, to a large misalignment angle of around . As discussed by Brandt & Podsiadlowski (1995) a high-velocity supernova kick of the neutron star’s progenitor might result in a large misalignment angle. In fact, they suggested that the Be disk in BeXRBs are typically not aligned with the orbital plane. An inclined Be disk in GX 3041 with respect to the orbital plane was also proposed by Postnov et al. (2015) as one possible explanation for the occurrence of the two observed double-peaked outbursts of the source in 2010 June and 2010 October. We have investigated this idea further and calculated the available Be-disk mass within the Roche radius of the neutron star as calculated after Eq. 3 for the mass ratio and with the true anomaly, , of the neutron star’s position. As shown in Fig. 6a the resulting mass within the Roche radius around the observed double-peaked outburst of GX 3041 at MJD 56220 indeed shows two distinct maxima. During this outburst, the orbital phase of the highest point of the disk is near zero, i.e., at the periastron passage of the neutron star. Thus, the neutron star orbit crosses the disk plane twice. This strengthens the idea that double-peaked outbursts are due to a misaligned Be disk, which moves into the orbit of the neutron star as proposed by Postnov et al. (2015) for GX 3041 and by Okazaki et al. (2013) in general. Furthermore, the model predicts weak leading and trailing flares to the periastron outbursts, which are indeed observed at MJD 55540 and MJD 55830 in the Swift-BAT light curve (shown on top of Fig. 6a). Our model fails to explain the observed double-peaked outburst around MJD 56080 and the available mass during each outburst does not scale with the observed count rate of GX 3041 as measured with Swift-BAT. The available mass can be modified, however, due to a warped disk, density fluctuations, or tidal streams. The latter results from overflowing gas of the Be disk close to periastron, which gets unbound as soon as the Roche radius of the companion star decreases below the disk’s truncation radius, which is the case for in GX 3041. Finally, deriving the mass accretion rate and, thus, the luminosity from the available mass requires further geometrical and hydrodynamical investigations, which is beyond the scope of this paper.
Figure 6b shows the orbital phases at which the available mass within the neutron star’s Roche lobe was at a maximum (including both maxima for the double-peaked outburst around MJD 56220). The orbital phases scatter around the periastron passage between and . For the 2010 August, 2010 December, and 2011 May outbursts of GX 3041, R17 noticed orbital phase shifts between the falling edges of these outbursts. Interestingly, our derived orbital phases match those of R17 to some extent (Fig. 6b, purple circles).
In summary, a precessing and inclined Be disk explains the observed -evolution of GX 3041 and supports the occurrence of double-peaked outbursts and phase shifts of the outburst light curves. Our model favours a large Be disk truncated close to the Roche radius for the averaged binary separation. The fast disk precession found can be explained by the eccentric Kozai-Lidov mechanism. However, some issues still remain such as the unacceptable goodness of the fit, the high number of possible solutions, and mismatches between some predicted and observed double-peaked outbursts. We stress that until these issues are solved any numbers derived from our analysis should be taken with care and understood in a qualitative way. Increasing the data sample of observed column densities towards GX 3041 in combination with optical observation of its companion, in particular H line profiles, would help solving these issues in the future.
Acknowledgements
MK acknowledges support by the Bundesministerium für Wirtschaft und Technologie under Deutsches Zentrum für Luft- und Raumfahrt grants 50OR1113 and 50OR1207 and by the European Space Agency under contract number C4000115860/15/NL/IB. SMN acknowledges support by research project ESP2016-76683-C3-1-R. JMT acknowledges research grant ESP2014-53672-C3-3P. We thank the Deutscher Akademischer Austauschdienst (DAAD) for funding JC through the Research Internships in Science and Engineering (RISE). Parts of this work can be found in the Ph.D. thesis of Müller (2013). All figures within this paper were produced using the SLXfig module, which was developed by John E. Davis. We thank the RXTE-team for accepting and performing our observations of GX 3041. Finally, we acknowledge the comments by the referee, which helped improving the content of our paper.
References
- Alexander (1976) Alexander M. E., 1976, Ap&SS, 45, 105
- Brandt & Podsiadlowski (1995) Brandt N., Podsiadlowski P., 1995, MNRAS, 274, 461
- Carciofi & Bjorkman (2006) Carciofi A. C., Bjorkman J. E., 2006, ApJ, 639, 1081
- Carciofi et al. (2012) Carciofi A. C., Bjorkman J. E., Otero S. A., Okazaki A. T., Štefl S., Rivinius T., Baade D., Haubois X., 2012, ApJ, 744, L15
- Clark et al. (2001) Clark J. S., Tarasov A. E., Okazaki A. T., Roche P., Lyuty V. M., 2001, A&A, 380, 615
- Dickey & Lockman (1990) Dickey J. M., Lockman F. J., 1990, ARA&A, 28, 215
- Eggleton (1983) Eggleton P. P., 1983, ApJ, 268, 368
- Finger et al. (2009) Finger M. H., et al., 2009, ArXiv Astrophysics e-prints
- Foreman-Mackey et al. (2013) Foreman-Mackey D., Hogg D. W., Lang D., Goodman J., 2013, PASP, 125, 306
- Goodman & Weare (2010) Goodman J., Weare J., 2010, Commun. Appl. Math. Comput. Sci., 5, 65
- Hanuschik (1996) Hanuschik R. W., 1996, A&A, 308, 170
- Hemphill et al. (2014) Hemphill P. B., Rothschild R. E., Markowitz A., Fürst F., Pottschmidt K., Wilms J., 2014, ApJ, 792, 14
- Houck & Denicola (2000) Houck J. C., Denicola L. A., 2000, in Manset N., Veillet C., Crabtree D., eds, Astron. Soc. of the Pacific Conf. Series Vol. 216, Astronomical Data Analysis Software and Systems IX. p. 591
- Jahoda et al. (2006) Jahoda K., Markwardt C. B., Radeva Y., Rots A. H., Stark M. J., Swank J. H., Strohmayer T. E., Zhang W., 2006, ApJS, 163, 401
- Jaisawal et al. (2016) Jaisawal G. K., Naik S., Epili P., 2016, MNRAS, 457, 2749
- Kalberla et al. (2005) Kalberla P. M. W., Burton W. B., Hartmann D., Arnal E. M., Bajaja E., Morras R., Pöppel W. G. L., 2005, A&A, 440, 775
- Klochkov et al. (2012) Klochkov D., et al., 2012, A&A, 542, L28
- Kopal (1959) Kopal Z., 1959, Close binary systems. The International Astrophysics Series, John Wiley & Sons Inc., New York
- Larwood (1998) Larwood J., 1998, MNRAS, 299, L32
- Lee et al. (1991) Lee U., Osaki Y., Saio H., 1991, MNRAS, 250, 432
- Lewin et al. (1968) Lewin W. H. G., Clark G. W., Smith W. B., 1968, Nature, 219, 1235
- Liu et al. (2006) Liu Q. Z., van Paradijs J., van den Heuvel E. P. J., 2006, A&A, 455, 1165
- Lubow et al. (2015) Lubow S. H., Martin R. G., Nixon C., 2015, ApJ, 800, 96
- Manousakis et al. (2008) Manousakis A., et al., 2008, INTEGRAL hard X-ray detection of HMXB GX 304-1 and H 1417-624, ATel 1613
- Martin et al. (2011) Martin R. G., Pringle J. E., Tout C. A., Lubow S. H., 2011, MNRAS, 416, 2827
- Mason et al. (1978) Mason K. O., Murdin P. G., Parkes G. E., Visvanathan N., 1978, MNRAS, 184, 45P
- McClintock et al. (1977) McClintock J. E., Nugent J. J., Li F. K., Rappaport S. A., 1977, ApJ, 216, L15
- Miranda & Lai (2015) Miranda R., Lai D., 2015, MNRAS, 452, 2396
- Moritani et al. (2013) Moritani Y., et al., 2013, PASJ, 65, 83
- Müller (2013) Müller S., 2013, PhD thesis, Friedrich-Alexander-Universität Erlangen-Nürnberg
- Naoz (2016) Naoz S., 2016, ARA&A, 54, 441
- Naoz et al. (2013) Naoz S., Farr W. M., Lithwick Y., Rasio F. A., Teyssandier J., 2013, MNRAS, 431, 2155
- Negueruela & Okazaki (2001) Negueruela I., Okazaki A. T., 2001, A&A, 369, 108
- Nyman (2008) Nyman L.-Å., 2008, in Reipurth B., ed., , Handbook of Star Forming Regions, Volume II. Astronomical Society of the Pacific Monograph Publications, p. 222
- Okazaki & Negueruela (2001) Okazaki A. T., Negueruela I., 2001, A&A, 377, 161
- Okazaki et al. (2002) Okazaki A. T., Bate M. R., Ogilvie G. I., Pringle J. E., 2002, MNRAS, 337, 967
- Okazaki et al. (2013) Okazaki A. T., Hayasaki K., Moritani Y., 2013, PASJ, 65, 41
- Papaloizou & Lin (1994) Papaloizou J. C. B., Lin D. N. C., 1994, in Duschl W. J., Frank J., Meyer F., Meyer-Hofmeister E., Tscharnuter W. M., eds, NATO ASI Series Vol. 417, Theory of Accretion Disks - 2. Kluwer Academic Publishers, Dordrecht, Netherlands, p. 329
- Papaloizou & Terquem (1995) Papaloizou J. C. B., Terquem C., 1995, MNRAS, 274, 987
- Parkes et al. (1980) Parkes G. E., Murdin P. G., Mason K. O., 1980, MNRAS, 190, 537
- Paxton (2004) Paxton B., 2004, PASP, 116, 699
- Postnov et al. (2015) Postnov K. A., Mironov A. I., Lutovinov A. A., Shakura N. I., Kochetkova A. Y., Tsygankov S. S., 2015, MNRAS, 446, 1013
- Pottschmidt et al. (2006) Pottschmidt K., Rothschild R. E., Gasaway T., Suchy S., Coburn W., 2006, BAAS, 38, 384
- Priedhorsky & Terrell (1983) Priedhorsky W. C., Terrell J., 1983, ApJ, 273, 709
- Rappaport et al. (1978) Rappaport S., Clark G. W., Cominsky L., Li F., Joss P. C., 1978, ApJ, 224, L1
- Reig et al. (1997) Reig P., Fabregat J., Coe M. J., 1997, A&A, 322, 193
- Reig et al. (2007) Reig P., Larionov V., Negueruela I., Arkharov A. A., Kudryavtseva N. A., 2007, A&A, 462, 1081
- Rivinius et al. (2013) Rivinius T., Carciofi A. C., Martayan C., 2013, A&ARv, 21, 69
- Rothschild et al. (1998) Rothschild R. E., et al., 1998, ApJ, 496, 538
- Rothschild et al. (2017) Rothschild R. E., et al., 2017, MNRAS, 466, 2752
- Sugizaki et al. (2015) Sugizaki M., Yamamoto T., Mihara T., Nakajima M., Makishima K., 2015, PASJ, 67, 73
- Torres et al. (2010) Torres G., Andersen J., Giménez A., 2010, A&ARv, 18, 67
- Verner et al. (1996) Verner D. A., Ferland G. J., Korista K. T., Yakovlev D. G., 1996, ApJ, 465, 487
- Walter (1975) Walter K., 1975, A&A, 42, 135
- Wilms et al. (2000) Wilms J., Allen A., McCray R., 2000, ApJ, 542, 914
- Wisniewski et al. (2010) Wisniewski J. P., Draper Z. H., Bjorkman K. S., Meade M. R., Bjorkman J. E., Kowalski A. F., 2010, ApJ, 709, 1306
- Yamamoto et al. (2011) Yamamoto T., Sugizaki M., Mihara T., Nakajima M., Yamaoka K., Matsuoka M., Morii M., Makishima K., 2011, PASJ, 63, S751
- Zamanov et al. (2001) Zamanov R. K., Reig P., Martí J., Coe M. J., Fabregat J., Tomov N. A., Valchev T., 2001, A&A, 367, 884
Appendix A Stellar precession in binaries
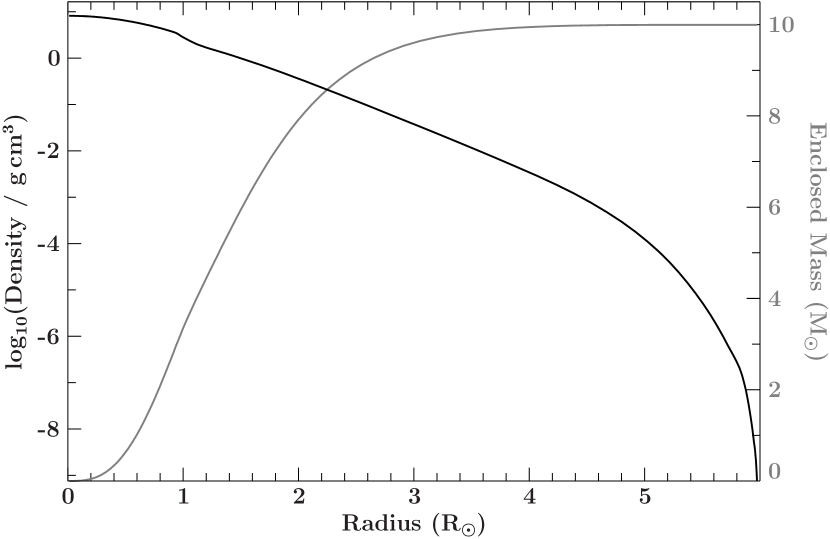
In BeXRBs, if the rotation axis of the Be star is inclined with respect to the orbital plane, the compact object will exert a tidal torque on the Be star and disk. The torque on the Be star will be non-zero if the Be star is oblate (due to, e.g., fast rotation). In the following we estimate the resulting precession period of the Be star using two formulations by Kopal (1959, hereafter K59) and by Alexander (1976, hereafter A76). For all calculations we assume the orbital parameters as listed in Table 1, a stellar mass and radius for the Be star of and , respectively (taken from Table 2), and a neutron star mass of . The radial density profile of the Be star as shown in Fig. 7 was calculated using the Evolve ZAMS (EZ) code333We have used the online tool EZ-Web developed by Richard Townsend, http://www.astro.wisc.edu/~townsend/static.php?ref=ez-web. (Paxton, 2004) for an initial stellar mass and metallicity of and 0.02, respectively. We simulated stellar evolution up to an age of 15.6 Myr in order to let the star expand up to the assumed radius of . When discussing other stellar radii or masses as shown in Fig. 8, we have linearly scaled the density profile for simplicity. In case of a different stellar mass, we scaled the density such that the total enclosed mass, i.e., the integral of the density profile over the full radius results in the assumed mass.
A.1 Formulation by K59
Assuming that the inclination of the rotation axis of the primary star to the binary orbit axis is small, K59 derived the period of stellar precession as (Eq. II.5-62 K59)
| (14) |
where is the orbital period, is the period of precession of the primary star, and and are quantities defined by (Eq. II.5-25 K59)
| (15) |
and (Eq. II.5-33 K59)
| (16) |
Here, is the mass of the primary, is the semi-major axis of the binary, and is the ratio of the rotation frequency of the primary, , to the binary orbital frequency (Eq. II.5-11 K59),
| (17) |
with the mass, , of the secondary and the gravitational constant, . The moment of inertia of the primary perpendicular, , and parallel, , to its rotational axis are given by (Eq. II.3-34 K59)
| (18) |
and by (Eq. II.3-39 K59)
| (19) |
respectively. Here, is the density of the primary star as a function of the distance, , to its centre up to the full radius, . In each equation, the first term on the right hand side is the moment of inertia of the primary at rest, which is calculated for the stellar structure as shown in Fig. 7. The second term describes the contribution of the rotational deformation to the moment of inertia, where is related to the apsidal constant, , as
| (20) |
We assume given that the apsidal constant of main-sequence stars are typically in the range of (5–8) (Torres et al., 2010).
The tidal bulge forming inside the primary star due to the gravitational pull of the secondary modifies the moment of inertia. In the rotating reference frame of the orbital plane, this moment of inertia, , is calculated by (Eq. II.3-46 K59)
| (21) |
where is the distance of the secondary from the primary, which is given by
| (22) |
with and being the eccentricity and the true anomaly. When orbit averaged, Eq. 21 is reduced to
| (23) |
Using Eqs. 17–19, the orbit average of can also be written as
| (24) |
Note that the factor is set to 1 in K59, where the orbit is assumed to be almost circular. We retain this factor in Eq. 24 since the orbits of BeXRBs are generally eccentric.
A.2 Formulation by A76
Alexander (1976) generalized the formulation of Kopal (1959) to an arbitrary angle, , between the angular momentum vectors of the primary and the binary orbit. If the angular momentum vectors of the Be star and its disk align, is then equal to the disk misalignment angle, , introduced in Sect. 4.2. In comparison to Eq. 14, Alexander (1976) derived (Eq. 2.21 A76)
| (27) |
for the precession period, , of the primary, which is negative for retrograde precession. Here, is a constant given by (Eq. 2.18 A76)
| (28) |
with the moment of inertia, , of the primary star at rest, which is calculated by (Eq. 2.4 A76)
| (29) |
and equal to the first term on the right hand side in Eq. 19. The rotational and tidal distortions to the total moment of inertia are are given by (Eq. 2.5 A76)
| (30) |
and (Eq. 2.14 A76)
| (31) |
respectively.
The total angular momentum, , of the binary is defined as (Eq. 2.19 A76)
| (32) |
The angular momentum of the primary, , is expressed as (Eq. 2.12 A76)
| (33) |
with its angular velocity vector, , and the normal vector, , of the orbital plane. Since the secondary is a compact object, which is a point mass in good approximation, its angular momentum is . The orbital angular momentum of the binary, , is given by (Eq. 2.11 A76)
| (34) |
A.3 Parameter dependencies
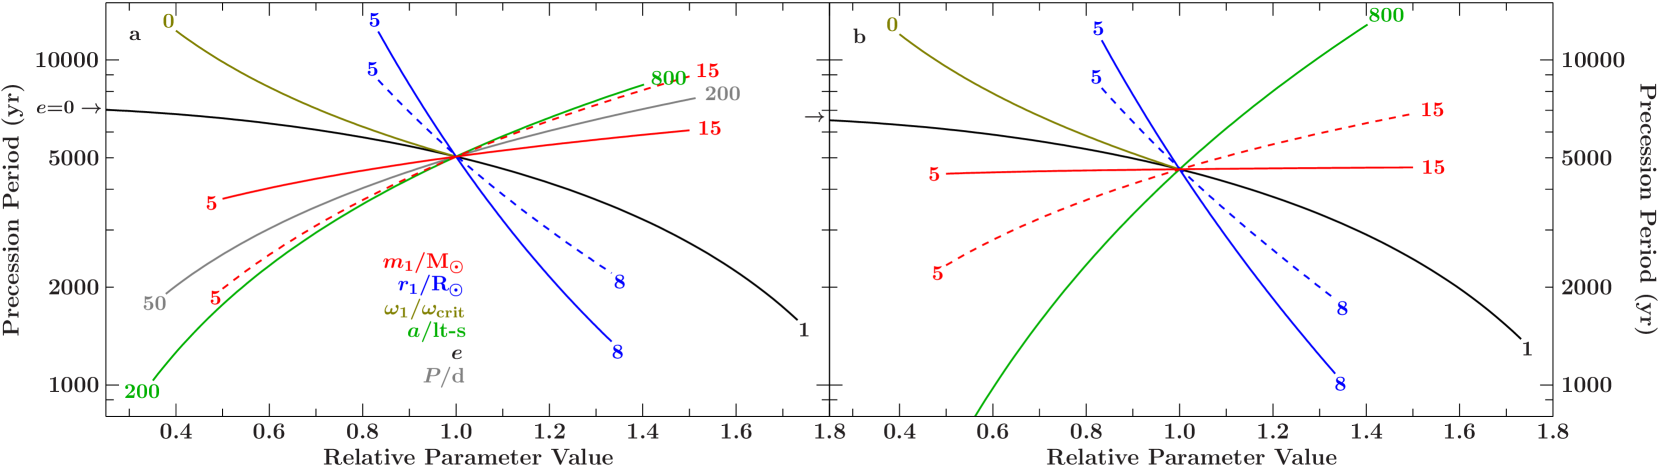
The precession period of the stellar companion star in GX 3041, which we derived following K59 and A76, is around 5000 yr and both formulations agree within a few hundred years. This period does not explain the short period of yr we have discovered by modelling the evolution of the absorption column density (see Sect. 4), which we interpret as the precession period of the Be disk.
Since we have fixed the stellar and binary parameters for the estimation of the stellar precession period to the values given above, different parameter values might change the resulting period significantly. Figure 8 shows the dependency of the stellar precession period after K59 and A76 on these parameters within a reasonable range. As can be seen, the precession period is larger than 1000 yr in almost all cases. Thus, it is unlikely that a certain combination of parameters indeed results in a precession period consistent with our findings.
We note that there is a difference between the formulations by K59 and A76, which is most prominent in the dependency on the primary mass, (red curve in Fig. 8), and the semi-major axis, (green curve). This is due to the fact that A76 uses Kepler’s third law,
| (35) |
to calculate the binary orbital period, , while the equations in K59 have a direct dependency. Indeed, when substituting in Eq. 14 with Eq. 35, both formulations agree very well.