Time-Dependent Cooling in Photoionized Plasma
Abstract
I explore the thermal evolution and ionization states in gas cooling from an initially hot state in the presence of external photoionizing radiation. I compute the equilibrium and nonequilibrium cooling efficiencies, heating rates, and ion fractions for low-density gas cooling while exposed to the ionizing metagalactic background radiation at various redshifts (), for a range of temperatures ( - K), densities ( cm-3) and metallicities ( - times solar). The results indicate the existence of a threshold ionization parameter, above which the cooling efficiencies are very close to those in photoionization equilibrium (so that departures from equilibrium may be neglected), and below which the cooling efficiencies resemble those in collisional time-dependent gas cooling with no external radiation (and are thus independent of density).
Subject headings:
ISM:general – atomic processes – plasmas – absorption lines – intergalactic medium1. Introduction
The radiative cooling efficiencies of low-density plasma are necessary quantities in the study of diffuse gas in and around galaxies. They are important in setting the rates at which gas accretes onto, and is ejected from, forming galaxies, and are therefore essential for modeling various aspects of galaxy formation and evolution.
The time-dependent radiative cooling of highly ionized gas, in the absence of any external sources of heating or photoionization, is a well-studied problem dating back to Kafatos (1973), that has been revisited by many other authors. Here I refer to such conditions as “collisional”, as opposed to “photoionized” gas. In photoionized gas non-collisional (i.e. radiative) processes become significant. Gnat & Sternberg (2007, hereafter GS07) studied the time-dependent ionization and cooling in collisional plasma. They calculated the equilibrium and nonequilibrium ionization states and radiative cooling efficiencies of low density gas cooling from an initial hot temperature. With no radiation, the collisional ionization equilibrium (CIE) ion fractions and radiative cooling efficiencies are functions of the temperature only.
In GS07 the main emphasis has been on the departures from equilibrium that occur when the cooling time becomes short compared with the electron-ion recombination time in collisional plasma. Below K, recombination becomes slow compared with cooling, and so the plasma tends so remain more highly ionized than expected for CIE. More highly ionized species generally have more energetic resonance line transitions, and so thermal electrons are less efficient in exciting over-ionized plasma, causing a suppression of the cooling efficiency at any temperature. Because metal-lines dominate the cooling over a wide range of temperatures, departures from equilibrium are more prominent for high-metallicity gas.
In astrophysical environments, low-density gas rarely exists in the absence of significant sources of ionizing radiation, either stellar or extragalactic. This radiation modifies the ionization states, thus directly affecting the observational signatures. For example, photoionizing radiation is key to understanding the absorption line signatures from circum-galactic gas (Churchill et al. 2015; Crighton et al. 2015); the origin of cold gas in galactic winds (Thompson et al. 2015); and the physical properties of gas around star-forming galaxies (Turner et al. 2015);
Crucially, when photoionization modifies the ionization states, it affects the cooling efficiencies which in turn determine the rates and epochs at which galaxies accrete their gas (this idea dates back to white & Rees 1978). At high redshifts, where the IGM is composed of primordial gas, photoionizing radiation has been shown to suppresses cooling significantly, thus quenching the formation rate of low-mass galaxies (e.g. Efstathiou 1992). More recent studies have shown that higher-mass galaxies also have their gas accretion- and star formation-rates regulated by the photoionizing radiation (e.g., Navvaro & Steinmetz 1997; Benson et al. 2002a; 2002b; 2003; Cantalupo 2010. See, however, Weinberg et al. 1997). The photoionized cooling efficiencies are therefore key to understanding both galaxy- and star-formation.
The ionization states in photoionization equilibrium have been studied extensively (E.g. recently by Churchill et al. 2014). The cooling and heating functions in photoionization equilibrium have been recently studied by Gnedin & Hollon (2012; for stellar and AGN spectral energy distributions) and Wiersma et al. (2009; for the CMB and metagalactic background). The nonequilibrium radiative cooling of hot ( K) photoionized gas, and the associated time-dependent ionization of the metal ions have been recently considered by Vasiliev (2011) and by Oppenheimer & Schaye (2013). Oppenheimer & Schaye (2013) presented results for gas densities between and cm-3, and for gas metallicities between and times solar. Departures from equilibrium cooling has been shown to affect the temperature of the IGM (Punchwein et al. 2015); the UV absorption signatures in the proximity of AGN (Oppenheimer & Schaye 2013); and the composition of galactic outflows (Richings & Schaye 2015);
In this paper, I reexamine the fundamental problem of nonequilibrium ionization of a time-dependent radiatively cooling gas in the presence of external photoionization. I focus on the impact that the photoionizing background has on the thermal evolution and ionization states. I consider the metagalactic background radiation (Haardt & Madau 2012, hereafter HM12) for redshifts between and , gas densities between and cm-3, and metallicities between and times solar. When photoionization and heating by the metagalactic background affect the physical properties of the cooling gas, the conditions become functions of the temperature, metallicity and density (or, equivalently, ionization parameter) of the gas.
The computations presented here indicate the existence of a threshold ionization parameter, above which the nonequilibrium cooling efficiencies are very close to those in photoionization equilibrium (so that departures from equilibrium may be neglected), and below which the cooling efficiencies resemble those in collisional time-dependent gas cooling with no external radiation (and are thus independent of density).
The outline of this paper is as follows. In §2 (and Appendix A) I summarize the numerical method and physical ingredients included in this computation. In §3 I describe how the photoionizing radiation affects the thermal evolution of radiatively cooling gas. I compare the equilibrium and nonequilibrium cooling efficiencies, and identify the threshold ionization parameter that separates the regime of photoionization equilibrium from the regime of time-dependent collisional cooling. §4 presents the ionization states as functions of gas temperature and density, for both photoionization equilibrium and nonequilibrium cooling. The full set of results, for metallicities - times solar, and for densities between and cm-3, are available as online data files. In §5 I discuss the evolution of the density ratios C IVO VI versus N VO VI in photoionized cooling gas. This density ratio can be used as a diagnostic tool for photoionized plasma. Additional diagnostic diagrams can be constructed using the online data presented in this paper. I summarize in §6.
2. Numerical Method and Processes
The goal of this paper is to study how an external radiation field affects the observational signatures in radiatively cooling plasma. I consider gas which is initially heated to a temperature K, and then cools radiatively. As in GS07, at the initial hot state, cooling is slower than recombination, and so the gas can reach ionization equilibrium before significant cooling takes place. As opposed to the situation discussed in GS07, here the gas is exposed to a continuous and constant source of heating and photoionization as it cools. The initial ionization equilibrium state is that of photoionization equilibrium (as opposed to CIE in GS07). In all cases considered here, the heating rate at the initial photoionization equilibrium state is lower than the cooling rate, and therefore the gas is not in thermal equilibrium, and will cool radiatively until the condition of thermal equilibrium is satisfied. I compute the coupled time-dependent evolution for clouds cooling at constant density (see §3.1 for a discussion of isobaric evolution), for a wide range of metallicities, taking into account departures from photoionization equilibrium.
In my computations I follow the numerical scheme outlined in GS07 and improved in Gnat & Sternberg (2009). The details of this numerical method and computational ingredients are summarized in Appendix A. I consider all ionization stages of the elements H, He, C, N, O, Ne, Mg, Si, S, and Fe. I include photoionization, collisional ionization by thermal electrons, radiative recombination, dielectronic recombination, neutralization and ionization by charge transfer reactions with hydrogen and helium atoms and ions, and multi electron Auger ionization processes. The photoionization rates are due to the externally incident radiation.
The ionization equations are coupled to an energy equation for the time-dependent heating and cooling, and resulting temperature variation. I follow the electron cooling efficiency, (erg s-1 cm3), and the heating rate (erg s-1), which depend on the gas temperature, the photoionizing background, the ionization state, and the metallicity . As in GS07, I adopt the elemental abundances reported by Asplund et al. (2005) for the photosphere of the Sun, and the enhanced Ne abundance recommended by Drake & Testa (2005; see Table 1 in GS07). In all computations I assume a primordial helium abundance (Ballantyne et al. 2000), independent of .
The electron cooling efficiency includes the removal of electron kinetic energy111I do not include the ionization potential energies as part of the internal energy but instead follow the loss and gain of the electron kinetic energy only. via recombination with ions, collisional ionization, collisional excitation followed by prompt line emission, thermal bremsstrahlung (GS07), and Compton cooling off the metagalactic background radiation. The compton cooling power is given by
| (1) |
where,
| (2) |
Most of the cooling processes (line-emission, recombinations, ionization, thermal bremsstrahlung) are two-body processes, and are therefore proportional to the density squared for the low densities considered here ( cm-3). However, Compton cooling is proportional to the electron density times the photon density, and therefore dominates at low densities, where all other processes are suppressed.
For the heating rate, (erg s-1) I include compton heating by high energy photons and photo-ionization by the background radiation, . Each photoionizing photon adds an energy to the kinetic energy of the electron gas, where is the absorbed photon frequency, and is the ionization threshold of the ionized ion.
The cooling efficiencies and heating rates were computed by passing the nonequilibrium ion fractions to the Cloudy cooling and heating functions. The results presented here have been obtained using Cloudy version 13.00. The net local cooling rate per volume is given by .
For an ideal gas, the pressure , and the thermal energy density . If is the amount of heat lost (or gained) by the thermal electron gas, then for isochoric cooling (for which ),
| (3) |
This leads to the relation,
| (4) |
(GS07, Kafatos 1973).
In the absence of external radiation (i.e. when and ) the evolution of the ion fractions as functions of temperature, , is independent of the gas density or pressure. When external radiation is present, the ion fractions at a given temperature and ionizing background are functions of the gas density or, equivalently, of the ionization parameter,
| (5) |
which measures the ratio of the ionizing photon density to the electron density.
The ionic rate equations and energy-balance equation 4 constitute a set of coupled ordinary differential equations (ODEs). I use the numerical schemed outlined in GS07 for isochorically cooling gas to solve for the non-equilibrium ion-fractions and temperature. Here the local errors for hydrogen, helium, and metal ions were set to be smaller than , , and , respectively. The high accuracy is crucial, because heating is sometimes dominated by trace species. The integration has been carried out to a minimum temperature , set by the condition of thermal equilibrium with the background radiation field. If the equilibrium temperature is lower than K, I set K, because molecular chemistry and dust cooling are not included in this work, and the results for temperatures below K may therefore be unreliable.
3. Cooling Efficiencies
In this section I describe the thermal evolution of the cooling gas, and examine its dependence on the controlling parameters: the ionizing radiation, gas density, and metallicity.
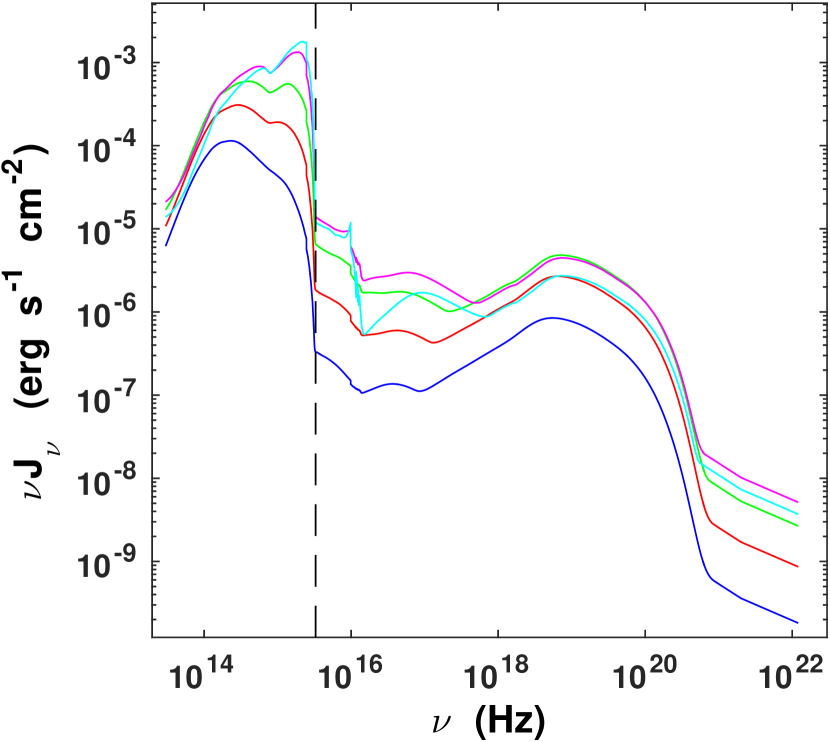
For the photoionizing radiation field, I consider the metagalactic background radiation at redshifts, and (HM12), between and Ryd ( eV keV). I show the full HM12 spectral energy distributions in Figure 1. The mean intensity of the metagalactic background increases between redshift and . It reaches a maximum at and then decreases again at higher redshifts. The ionizing photon densities () are listed in Table 1.
| Redshift | |
|---|---|
I consider gas densities between cm-3 (the cosmic mean) and cm-3, and explore five different values of gas metallicity from to times the metal abundance of the sun. For each redshift-density-metallicity combination, I have carried out computations of the ion fractions, cooling efficiencies and heating rates as functions of gas temperature. First, I assume photoionization equilibrium (hereafter PIE, see Table 2) imposed at all temperatures to calculate the PIE ion fractions and cooling efficiencies. Then I consider the non-equilibrium evolution of photoionized cooling gas, to compute the time-dependent ionization and cooling.
| Processes | Equilibrium | Time-Dependent |
|---|---|---|
| Collisional Only | CIE | TDC |
| Collisional Ionization Equilibrium | Time-Dependent Collisional | |
| Including Radiation | PIE | TDP |
| Photo-Ionization Equilibrium | Time-Dependent Photoionized |
Here I focus on the total cooling efficiencies, (ergs cm3 s-1), in the photoionized cooling gas. Figure 2 shows the cooling efficiencies as a function of gas temperature for solar metallicity gas. Panel (a) shows the cooling for collisional plasma, i.e., with no external radiation (GS07). The blue solid curve is for CIE. This familiar curve shows the hydrogen Ly peak at K, followed by dominant contributions from carbon, oxygen, neon and iron resonance-lines, and thermal bremsstrahlung (from low to high temperature). The black dashed curve is for time-dependent collisional cooling (hereafter TDC, see Table 2). The narrow contributions dominated by individual species that appear for CIE are smeared out in the TDC curves. This is due to the broader ion distribution that occur as overionized species persist down to low temperatures. The nonequilibrium collisional cooling efficiencies are suppressed, by factors of , compared to CIE cooling. This is because the gas remains ”overionized” as it cools, and consequently tends to have more energetic resonance line transitions (McCray 1987), which are less accessible to the “cooler” thermal electrons.
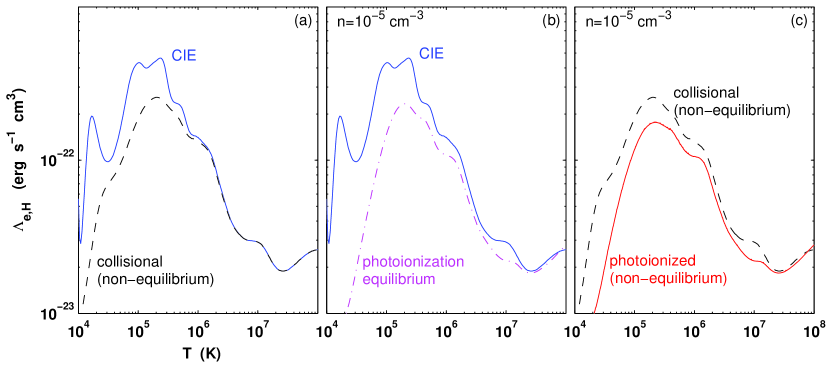
Panel (b) compares the CIE cooling curve (again, solid blue) with the cooling efficiencies assuming PIE in a cm-3 gas in the presence of the HM12 metagalactic radiation field (dash-dotted magenta curve). Photoionized gas is more highly ionized than gas in collisional equilibrium because of the additional ionization term due to radiation. Just as in the case of departures from equilibrium, the more highly ionized species are less efficiently excited by the thermal electrons, and cooling is suppressed.
Finally, panel (c) compares the non-equilibrium cooling efficiencies in the collisional case (TDC, dashed black) and in the photoionized case (solid red) assuming cm-3 gas in the presence of the HM12 metagalactic radiation field. For this gas density, even though the time-dependent collisional gas is overionized compared with CIE, the addition of photoionization by the metagalactic background increases the ionization states of the dominant coolants above and beyond those in the non-equilibrium collisional gas.
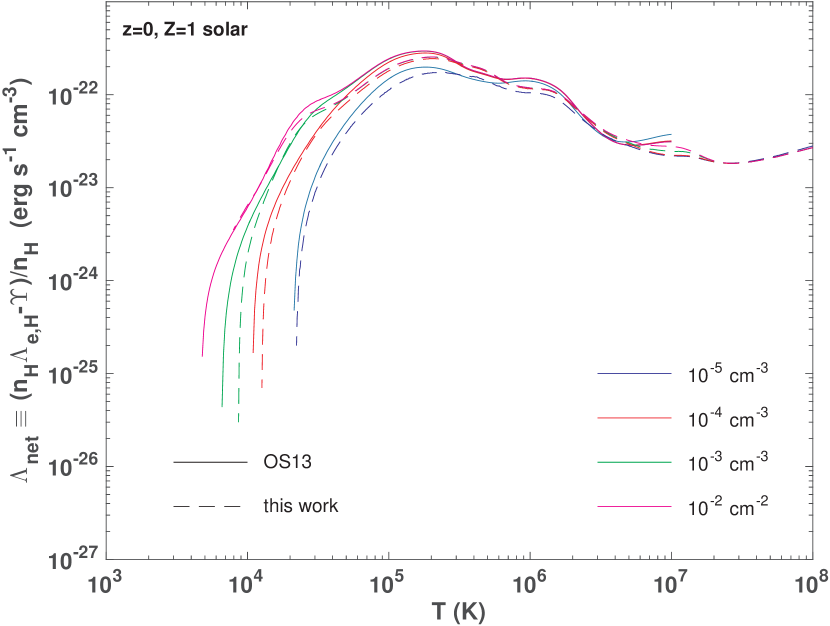
Figure 3 compares the TDP cooling efficiencies computed here to those of Oppenheimer & Schaye (2013, hereafter OS13). For a direct comparison, the figure shows the net cooling efficiencies, defined here as . OS13 provide online results for densities in the range cm-3 and cm-3, which are displayed in Figure 3. Note, that these densities are all “high densities” (i.e. above the threshold density) in the context of the discussion that follows. I display results for solar metallicity gas exposed to the HM12 radiation field. Figure 3 shows a very nice agreement between the results of this work (dashed curves) and OS13 (solid curves). The small differences seen between K and K have already been described in OS13, and are mainly due to differences in the solar composition assumed (see figure 5 and associated discussion in OS13). The low temperatures differences are all basically at thermal equilibrium, where cooling and heating become comparable, and the differences between them are minute. These results are also very sensitive to the high-energy cutoff of the input SED (see discussion in Appendix B). Overall, the agreement between the computed TDP cooling efficiencies presented in Figure 3, is better than the one presented in OS13 for the TDC rates, mainly due to the use of the more up-to-date atomic data included in the newer version of Cloudy (ver. 13.00).
| Temperature (K) | |||||
|---|---|---|---|---|---|
Note. — The complete version of this table is in the electronic edition of the Journal. The printed edition contains only a sample. The full table is divided into lettered parts ABC, and lists the equilibrium cooling efficiencies for for gas densities between and cm-3, for the metagalactic backgrounds at redshifts , and for , , , , and times solar metallicity gas (for a guide, see Table 3).
| Temperature (K) | |||||
|---|---|---|---|---|---|
Note. — The complete version of this table is in the electronic edition of the Journal. The printed edition contains only a sample. The full table is divided into lettered parts ABC, and lists the non-equilibrium cooling efficiencies for for gas densities between and cm-3, for the metagalactic backgrounds at redshifts , and for , , , , and times solar metallicity gas (for a guide, see Table 3).
The photoionization-equilibrium and non-equilibrium cooling efficiencies for the full parameter space considered in this work are presented in Tables 4 and 5, respectively. Full electronic tables are divided into lettered sections ABC, as described in Table 3. Each lettered section lists the cooling efficiencies as a function of temperature for the five metallicity values considered. The results are displayed in Figures 4-9.
Focus first on the results for , displayed in Figure 4. This figure shows the time-dependent cooling efficiencies as functions of temperature in gas photoionized by the HM12 metagalactic radiation field, for gas metallicities equal to and times (top to bottom rows), and for gas densities between and cm-3 (shown by different colors within each row).
The non-equilibrium cooling efficiencies for “high” gas densities, cm-3, are displayed in the left hand side panels. The left panels also show the TDC (i.e. no radiation) non-equilibrium cooling efficiency in the gray solid curve shown in the background (GS07). The TDC cooling efficiency (erg s-1 cm-3) is independent of gas density.
In the TDC case — shown by the thick gray curve — cooling is dominated by metal-line emission over a wide range of temperatures for metallicities above (three upper panels). For lower metallicities (, two lower panels), hydrogen and helium lines, which are suppressed by metal line cooling at higher-, dominate. At the highest temperatures, thermal bremsstrahlung emission dominates the energy losses. The transition between line-emission and bremsstrahlung occurs at a few K for solar metallicity gas, and at K for the primordial case.
Figure 4 shows that the various time-dependent photoionized (hereafter TDP, see Table 2) cooling curves overlap with the TDC curve for high densities, where the ionization parameter is low, and the impact of photoionization therefore remains limited: the solid blue, dashed red, and thick gray curves overlap. For densities cm-3, the TDP cooling efficiencies are identical to the TDC cooling efficiencies for all gas metallicities.
Below this density, a metallicity dependence emerges. For solar (or higher) metallicity, the TDP cooling efficiencies overlaps with the TDC cooling down to densities of cm-3, as is shown by the upper two panels. At lower metallicities (), the cooling efficiencies in cm-3 gas overlap with the collisional curve only for K. Below this temperature, cooling is suppressed, as the abundance of neutral hydrogen is reduced by the photoionizing radiation, leading to less efficient Ly cooling. This does not affect higher-metallicity gas, because for hydrogen remain almost completely ionized down to K even with no photoionization. Metal emission lines then dominate the cooling down to K.
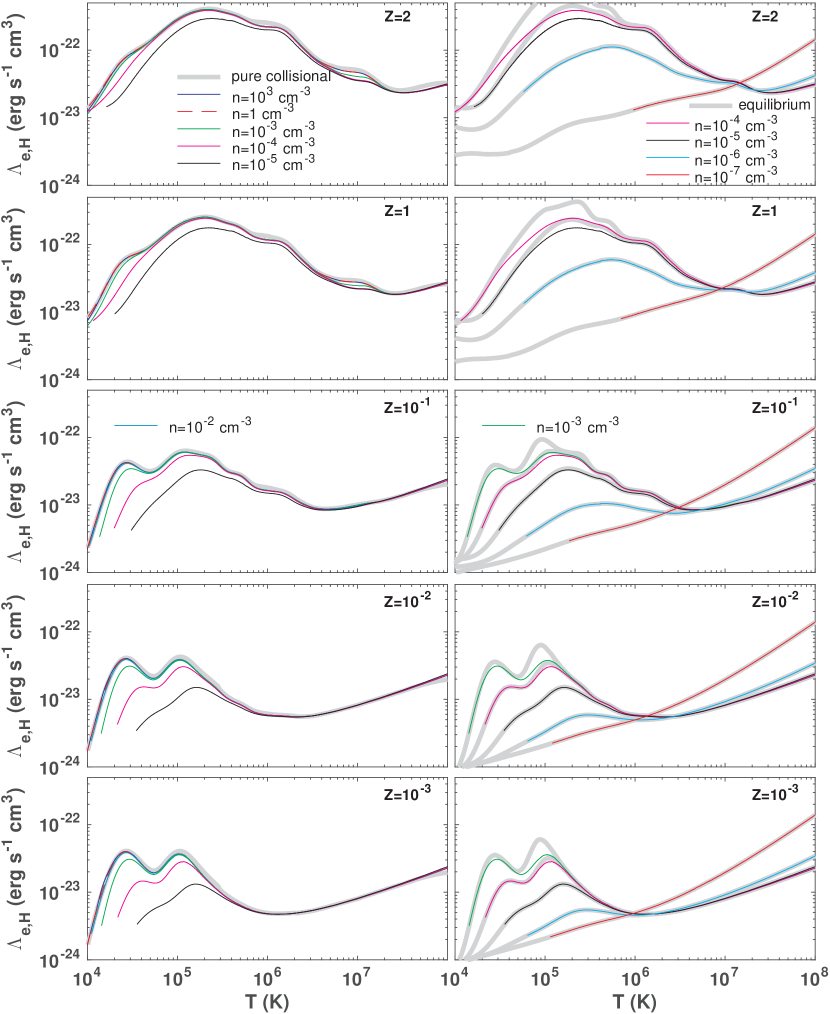
For even lower densities cm-3 the photoionizing radiation modifies the ion fractions of the dominant metal coolants, and TDP cooling curves start to deviate from the collisional curve. For example, for cm-3 and the TDP cooling efficiencies overlap with the TDC case for K, whereas for the curves overlap only for K .
The cooling efficiencies for “low” gas densities, cm-3, are shown in the right hand side panels. Again, the different rows are for different gas metallicities from (top panel) to (bottom panel). In each panel, the colored curves show the TDP cooling efficiencies at different gas densities. Here, the thick gray curves in the background show the cooling efficiencies assuming photoionization equilibrium with the background radiation. The PIE results do depend on the gas density, and there is a series of gray curves for the different densities displayed. The colored curves end at various temperatures, corresponding to the thermal equilibrium temperatures at the various densities.
For densities cm-3, the cooling is dominated by line emission at lower temperatures, and by thermal bremsstrahlung emission at the higher temperatures, just as for the higher densities displayed in the left hand side panels. However, at the lowest densities ( cm-3) an additional cooling process comes into play, namely Compton cooling off the metagalactic background radiation. Compton cooling gives rise to the sharp increase in at high temperatures. The cooling efficiency becomes significantly higher than the thermal bremsstrahlung efficiency. Because Compton cooling is proportional to the electron density times photon density (see equation 1), as opposed to all other cooling processes which are proportional to the electron density squared, it dominates at low densities, where all other processes are suppressed. Note that because is defined as the cooling rate per volume divided by , the compton cooling efficiency, .
The right-hand-side panels show that for the TDP cooling curves overlap with the PIE curves for all gas metallicities. At higher gas densities departures from photoionization equilibrium occur. For example, for cm-3 the TDP cooling curves are identical to those in PIE for , whereas for , slight deviations between the TDP curves and the PIE curves are apparent near the peak of the cooling curve, K.
An important conclusion from Figure 4 is that for every metallicity there exists a threshold density (or, equivalently, a threshold ionization parameter) below which the cooling efficiencies are close to those in PIE, and above which they resemble those is TDC cooling gas with no external radiation. Above the threshold density, departures from equilibrium ionization are significant, but the impact of the photoionizing radiation may be neglected. Below this critical density, photoionization plays a significant role, but departures from equilibrium may be neglected.
For example, for (top panels), the cooling efficiencies for cm-3 overlap with the TDC cooling efficiency, whereas for cm-3 the cooling curves overlap with the PIE curves. The threshold density, cm-3, corresponds to an ionization parameter . For (bottom panels) the TDP cooling efficiencies for cm-3 overlap with the TDC cooling efficiency, whereas for cm-3 the TDP cooling overlaps with the PIE curves. The threshold density, cm-3, corresponds to an ionization parameter . The threshold densities/ionization parameters for are listed in table 6.
| Metallicity | ||
|---|---|---|
| () | (cm-3) | |
This finding offers a great computational simplification: instead of following the time dependent cooling efficiencies in the presence of photoionizing radiation, it is possible to use pre-computed tables for the TDC cooling efficiency (i.e. GS07) and/or for PIE.
Within a dex around the threshold ionization parameter, both departures from equilibrium ionization and photoionization affect the cooling efficiencies. However, even in this case it is enough to know the TDC and PIE cooling efficiencies: The TDP cooling efficiency deviates from the minimum of the TDC and PIE efficiencies by at most () for () (for ).
The cooling efficiencies for redshifts , and are displayed in Figures 6-9, and listed in Tables 4 and 5. As in Figure 4, different rows are for different gas metallicities, and the different curves within each row represent different gas densities. “High” densities are on the left-hand side panels, and “low” densities are on the right hand side panels. Figures 6-9 confirm that for there also exists a threshold density above which the TDP cooling is similar to the TDC curve and below which it is similar to that in PIE.
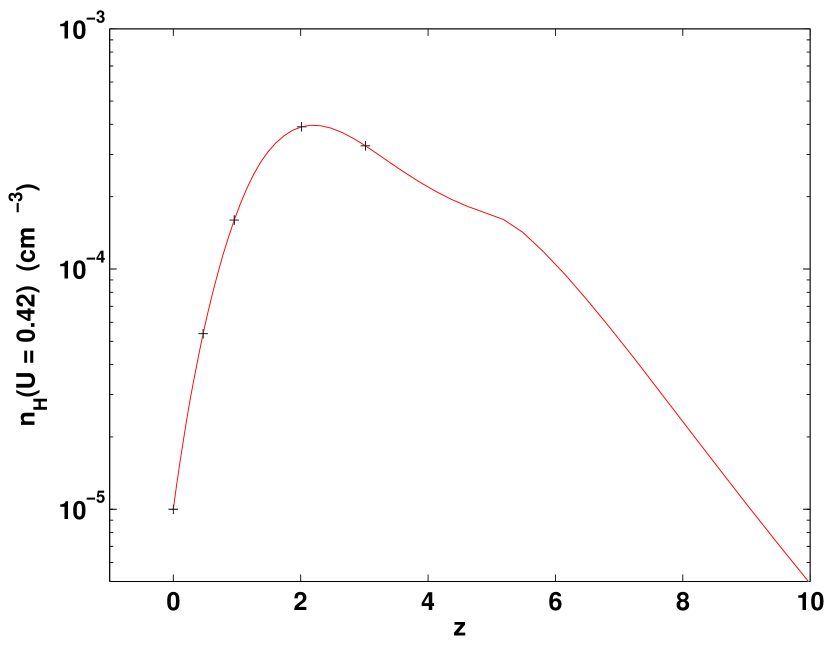
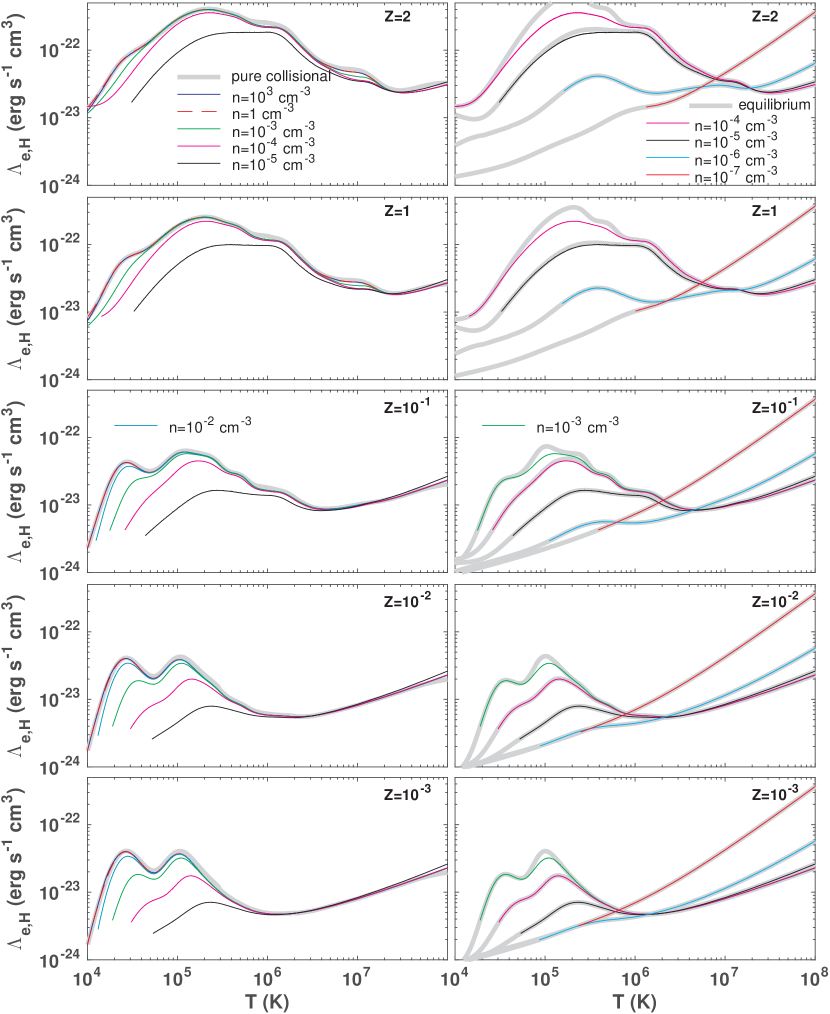
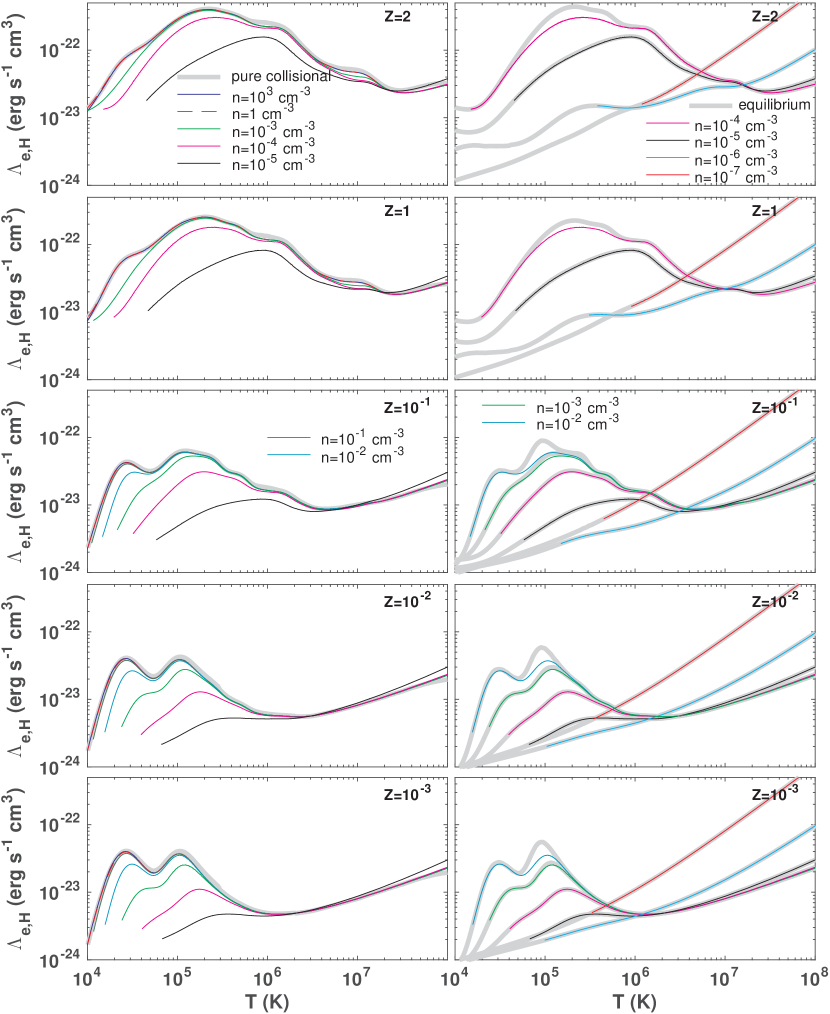
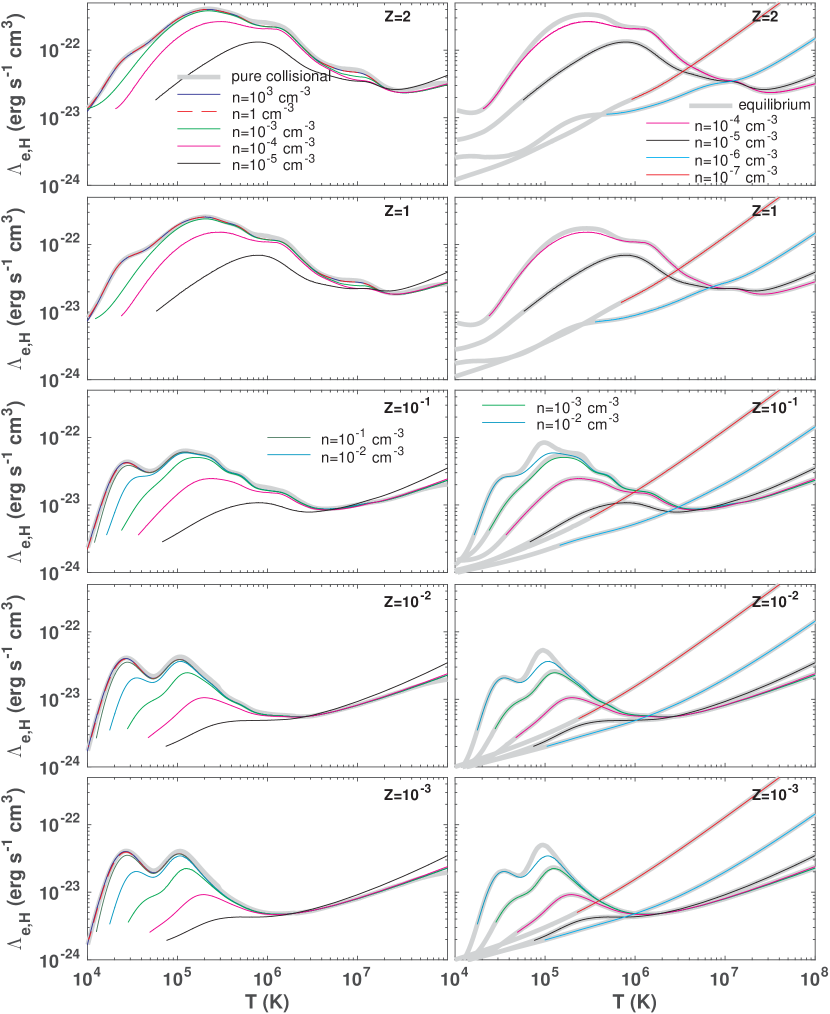
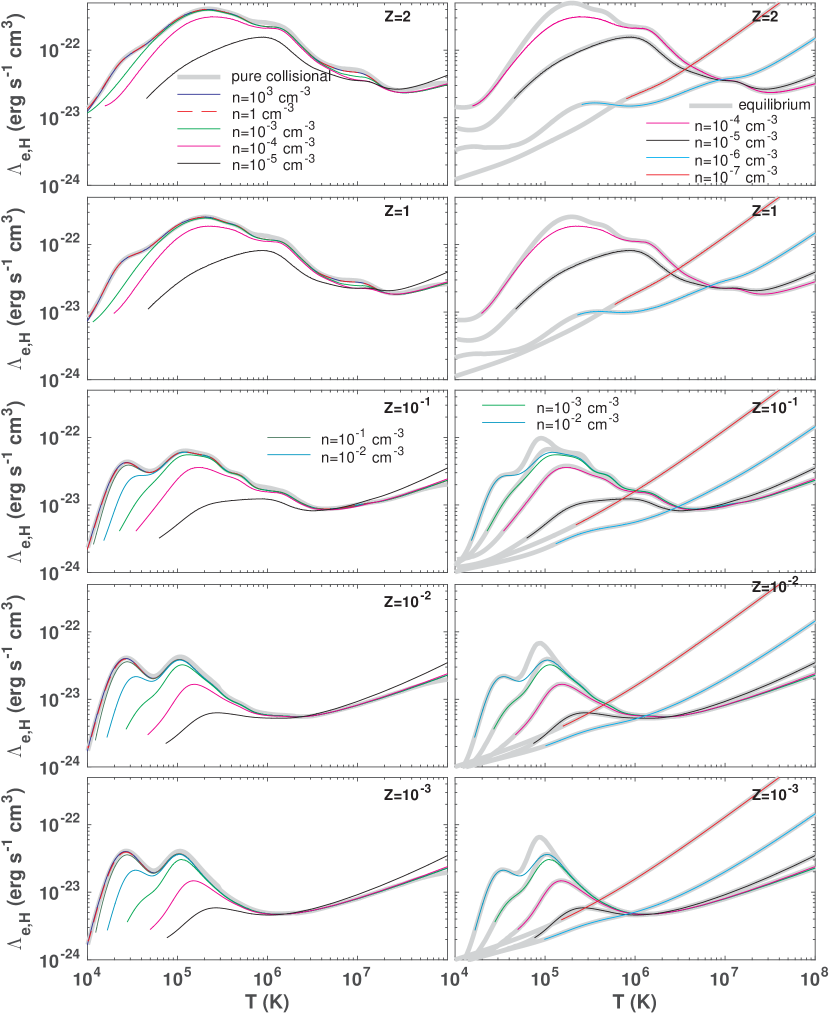
Figure 4 shows that the threshold ionization parameter corresponding to is . For , this corresponds to a critical density of cm-3. For higher redshifts, the density corresponding to this ionization parameter is modified as the spectral energy distribution of the metagalactic background evolves. The threshold densities corresponding to the threshold ionization parameter, are displayed in Figure 5. And indeed, Figures 6-9 verify that these threshold densities separate a high-density limit in which TDP cooling is equivalent to TDC cooling, from a low-density limit in which the TDP cooling is identical to that in PIE. For metallicities the threshold ionization parameter is a factor of lower than for solar metallicity (), and the threshold densities are therefore a factor of higher than those displayed in Figure 5.
Heating in photoionized plasma is due to photoionization of atomic and ionic species. The heating rates therefore depend on the specific spectral energy distribution impinging upon the gas. The heating rates are coupled to the ionization states in the gas, which are affected by the same background. Over most of the temperature range considered here, heating is negligible with respect to cooling, and has little impact on the thermal evolution of the gas. Hetaing only modifies the thermal evolution near the thermal equilibrium temperature. For completeness, I list in Tables 7 and 8 the equilibrium and non-equilibrium heating rates for gas cooling in the presence of the metagalactic background radiation at redshifts, and (HM12). A guide is provided in Table 3. As mentioned before, throughout this paper, the Haardt & Madau (2012) background radiation has been truncated at an energy of keV. While this high-energy truncation point has a negligible effect of the cooling efficiencies, which are the main focus of this paper, it plays a potentially important role in setting the absolute heating rates. Nevertheless, it is not expected to significantly affect the thermal evolution of low density plasmas. This point is further discussed in Appendix B.
3.1. Isobaric Cooling
Depending on the ratio between the cooling time and the dynamical time, cooling may proceed either isochorically (when cooling is rapid), or isobarically (when cooling is slow). The dynamical evolution is therefore determined by the ratio
| (6) |
where is the cooling time, and is the dynamical time in a gas cloud of size , and sound speed (see GS07 for a detailed discussion).
For isochoric cooling, and remain constant with time. As the gas cools, generally decreases, implying that cooling which is initially isochoric remains isochoric. For isobaric cooling, the gas contracts as it cools. After cooling to a temperature , the density will increase by a factor , and the diameter will decrease by a factor relative to the properties at the initial temperature, . Thus, as the cloud cools and contracts, decreases and a transition to isochoric cooling must eventually occur.
| Temperature (K) | |||||
|---|---|---|---|---|---|
Note. — The complete version of this table is in the electronic edition of the Journal. The printed edition contains only a sample. The full table is divided into lettered parts ABC, and lists the equilibrium heating rates for for gas densities between and cm-3, for the metagalactic backgrounds at redshifts , and for , , , , and times solar metallicity gas (for a guide, see Table 3).
| Temperature (K) | |||||
|---|---|---|---|---|---|
Note. — The complete version of this table is in the electronic edition of the Journal. The printed edition contains only a sample. The full table is divided into lettered parts ABC, and lists the non-equilibrium heating rates for for gas densities between and cm-3, for the metagalactic backgrounds at redshifts , and for , , , , and times solar metallicity gas (for a guide, see Table 3).
When the gas cools isobarically in the presence of photoionizing radiation the varying density also implies a varying ionization parameter. Consider the evolution of an isobarically cooling gas cloud. A gas cloud that begins the cooling process at a density larger than the threshold density, will always remain at a higher density. In this regime, one may consider the TDC cooling efficiency throughout the cooling process.
For a gas cloud that is initially at a density lower than the threshold density, cooling will initially proceed according to the PIE efficiencies. However, the density will increase by a factor () after cooling to a temperature T. The cloud may cross the threshold density, thus transitioning from the regime in which the PIE cooling efficiencies apply, into the regime where the TDC cooling efficiency apply.
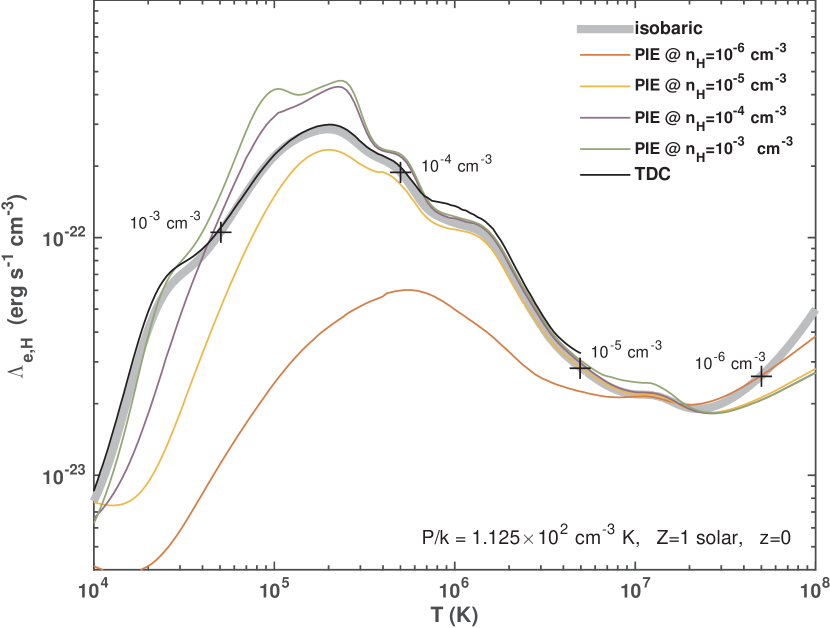
This point in demonstrated in Figure 10. The thick gray curve depicts the time-dependent cooling efficiency in an isobarically cooling gas cloud with a constant pressure cm-3 K, and solar metallicity, exposed to the metagalactic radiation field. This gas begins its cooling process at an initial temperature K, and density cm-3, and achieves thermal equilibrium at a temperature K, when its density is cm-3. The crosses and labels mark the hydrogen density at certain points along the cooling process.
The colored curves displayed in Figure 10 show the PIE cooling efficiencies at densities of cm-3 (from red to green). The black curve shows the (isobaric) TDC cooling efficiency (GS07). The cooling efficiency is indeed identical to the PIE cooling efficiency at the appropriate density, as long as the gas density is lower than the threshold density. For example, the isobaric thick gray curve and the PIE red curve intersect just when the density equals cm-3 (marked by the cross). The isobaric curve crosses the orange curve when the density equals cm-3, as expected. At cm-3 the gas crosses the threshold density, and at lower temperatures (higher densities) we therefore expect the cooling efficiency to match the TDC cooling efficiency. And indeed, at lower temperature, the isobaric gray curve matches the TDC black curve, and not the (purple, green) PIE curves.
Figure 10 demonstrates that the threshold density can be used to separate the regime in which PIE cooling efficiencies apply from the regime in which the cooling efficiency is the TDC efficiency, even for the case of isobaric cooling.
4. Ion Fractions
I have carried out computations of the photoionized ion fractions of the elements H, He, C, N, O, Ne, Mg, Si, S, and Fe, as functions of gas temperature for two sets of assumptions. First I assume PIE imposed at all T. Then I consider the nonequilibrium ion fractions in TDP gas as a function of the time-dependent temperature. The results are listed in tabular form in Tables 10 and 11 for the PIE and TDP ion fractions, respectively. These tables are divided into numbered parts , as described in Table 9.
In §3, I introduced the threshold ionization parameter, which separates the regime in which radiation significantly affects the cooling efficiencies (but departures from equilibrium may be neglected), from the regime in which non-equilibrium effects become important (but radiation may be neglected). Here I consider the corresponding behavior of the ion fractions for different gas densities.
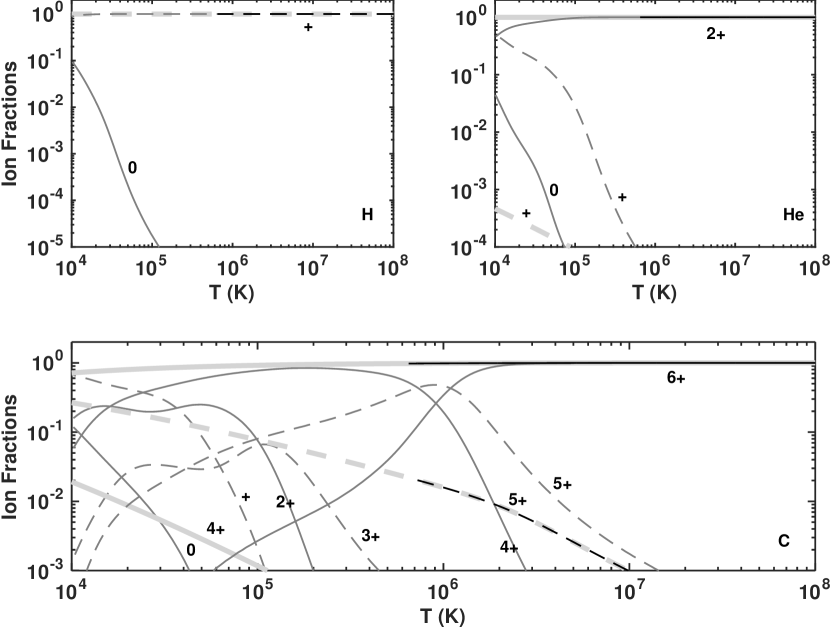
For solar metallicity gas exposed to the metagalactic background, the threshold ionization parameter corresponds to a threshold hydrogen density cm-3. Figure 11 presents the evolution of some ion fractions for this threshold gas density (for , and the metagalactic background). This is the density for which the impact of time-dependent photoionization should be maximal. In Figure 11, the dark curves present the results for the TDP ion fractions. This is compared to the ion fractions in PIE (thick gray curves), as well as to the ion fractions in TDC cooling gas (thin gray curves). The top panels display the ion fractions of hydrogen (left) and helium (right) as functions of temperature, and the bottom panel is for carbon. The different ionization states in each panel are denoted by dashed and solid curves (alternately), and are labeled next to the curves.
Figure 11 shows that for this density gas in PIE (thick gray) is more highly ionized than gas overionized due to time-dependent cooling in the absence of external radiation (TDC, thin gray). Moreover, TDP cooling leads to recombination lags which cause the gas to be ionized above and beyond the ionization in PIE. For example, at a temperature of K, the C3+, C4+, C5+, and C6+ fractions are , , , and in TDC gas, , , , and for PIE, and , , , and in TDP cooling gas. As far as the ionization states are concerned, the threshold density represents a case for which the ion fractions significantly deviate (by factors up to ) from both PIE and TDC ion fractions. This is in contrast to the cooling efficiencies which deviate from the minimum of the TDC and PIE efficiencies by at most (see Section 3).
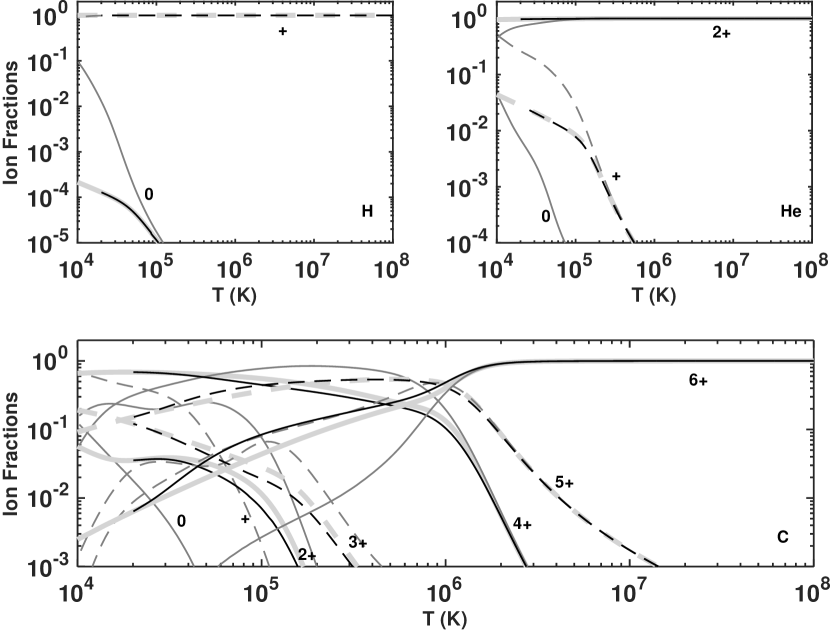
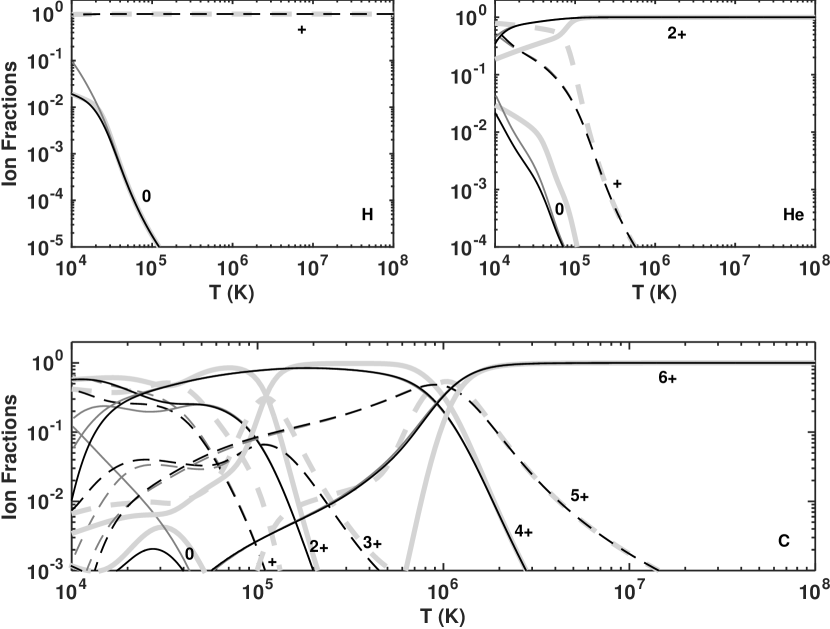
Figure 12 displays the ion fractions for gas dex above the threshold density, cm-3. For this density, the TDP cooling efficiencies are identical to the TDC cooling efficiencies for all temperatures above K, and even at for lower temperatures the differences remain limited. However, the abundance of certain species (e.g. Si5+) are more strongly affected by the recombination lags in the photoionized cooling gas, and may differ significantly (by factors up to ) from those of the TDC cooling gas even at higher temperatures.
Figure 13 considers a hydrogen density of cm-3, dex below the threshold density. In this case, the cooling gas reaches thermal equilibrium at a temperature K. Throughout the cooling process, all ion fractions are identical (to within a few ) to those in PIE.
| Temperature | ||||
|---|---|---|---|---|
| (K) | HH | HH | HeHe | |
| Temperature | ||||
|---|---|---|---|---|
| (K) | HH | HH | HeHe | |
Figures 14-17 display the ratio between the TDP ion fractions and the TDC ion fractions (top panels) of the dominant coolants C3+, N4+, O5+, and Ne7+ (for clarity, data is only presented when the absolute abundance in the TDP gas is ). The ratios for different gas densities are displayed by different curves. As expected, the TDPTDC ion fraction of these species is unity for all gas densities cm-3, expect at K.
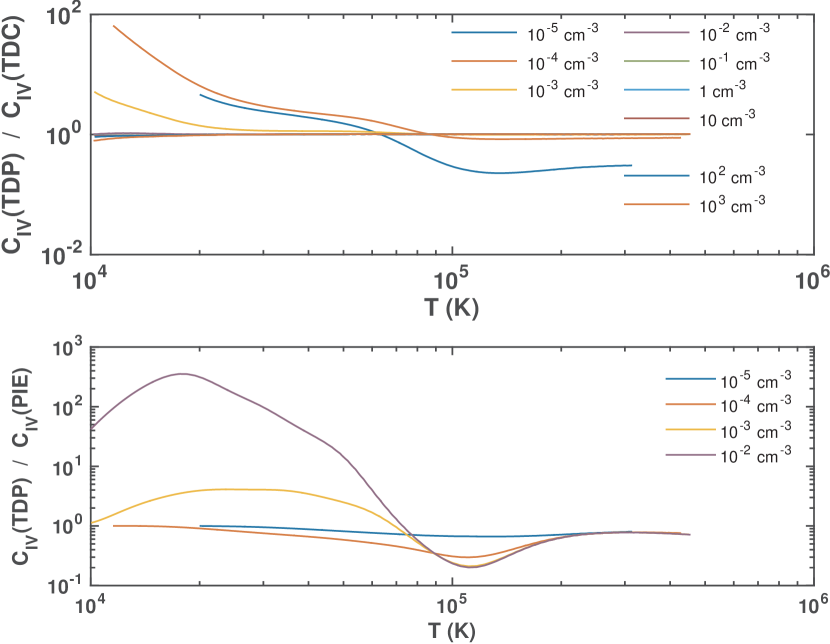
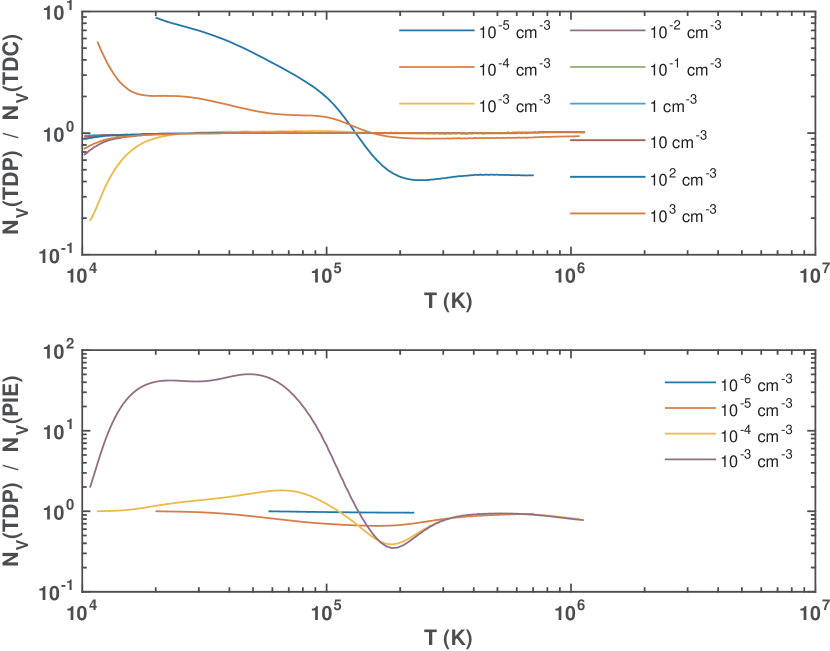
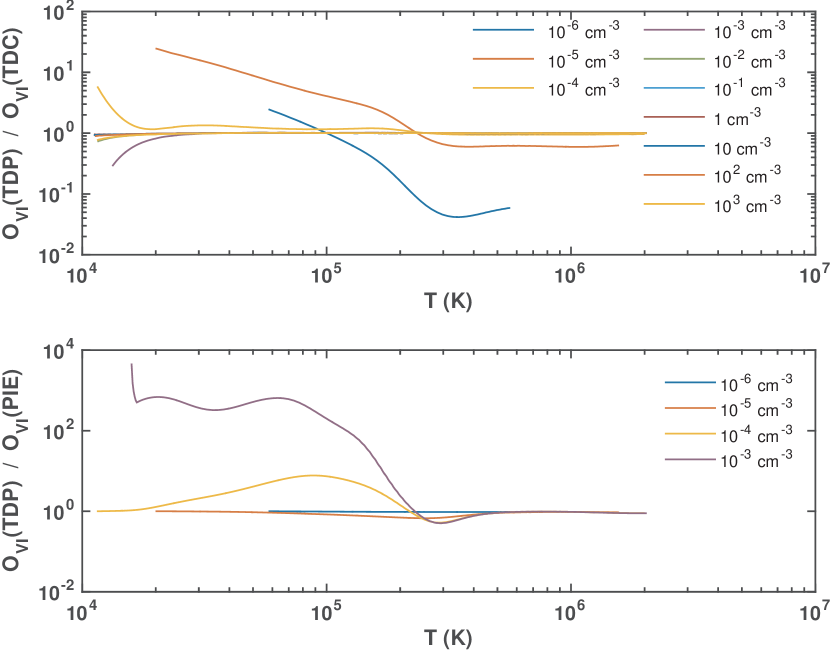
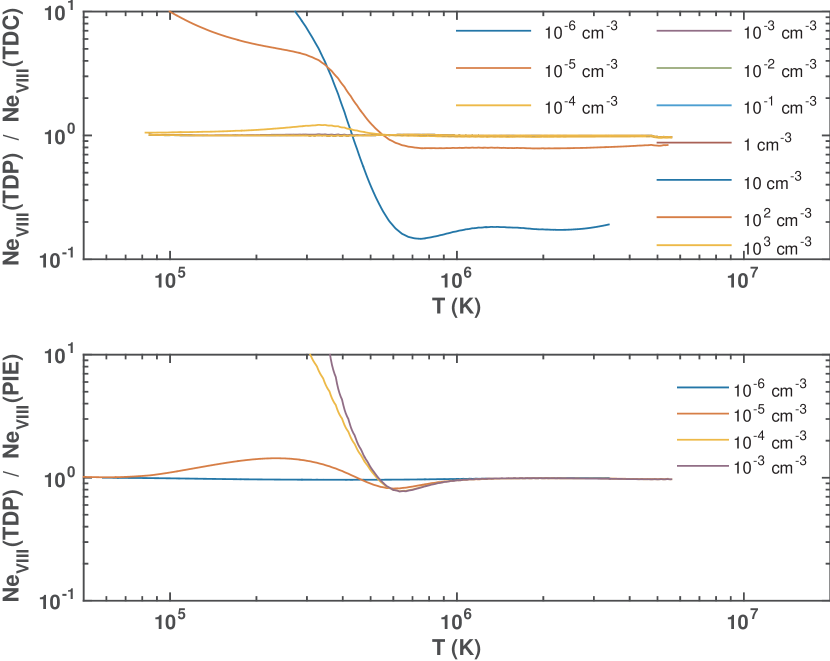
The bottom panels of Figures 14-17 display the ratio between the TDP ion fractions and the PIE ion fractions for the same species. These Figures demonstrate that the ion fraction ratio approaches unity for densities cm-3.
The convergence of the TDP ion abundance of the dominant coolants to the TDC abundances above the threshold density, and to the PIE abundances below the threshold density, confirm the results of section 3, and verify that the cooling efficiencies are only affected by both departures from equilibrium and photoionization at densities very close to the threshold density.
However, as discussed above, the TDP ion fractions of certain species – which do not contribute significantly to the gas cooling – may deviate by factors of a few from the TDC or PIE ion fractions. Therefore, while the thermal evolution of TDP cooling gas may be considered to be either in PIE or TDC cooling, depending on the density, the abundance of specific species must be followed with a full time-dependent photoionized calculation.
5. Diagnostics
Ion-ratios may be used as probes of the ionization state, temperature, metallicity, and density in photoionized cooling gas. For a uniform gas cloud, the column density ratio of the species and may be expressed as where is the abundance of element , and are the ion fractions computed above.
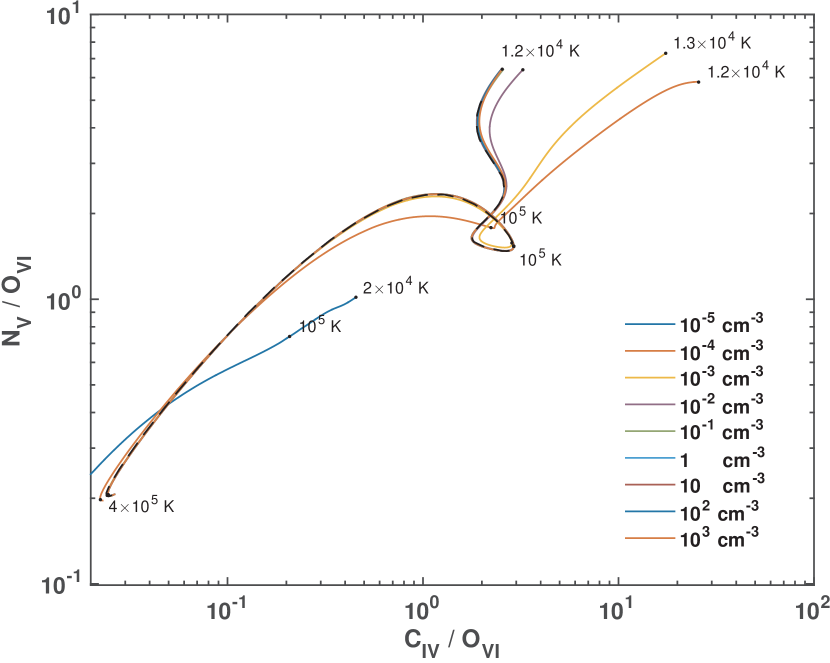
As an example, I present in Figure 18 “cooling trajectories” for ) versus ), for solar metallicity gas exposed to the metagalactic radiation, for temperatures between K and the thermal equilibrium temperature. Different gas densities are presented in Figure 18 by different curves (as indicated by the legend). For these three ions, O5+ is the most highly ionized, and so and are small at high temperature and become large at low temperature. The absorption line ratios therefore evolve from the lower left, to the upper right. For reference, some temperature legends are displayed along the curves (dots, labels).
The cooling trajectory for TDC cooling gas is displayed by the black dashed curve. Figure 18 show that for these ratios, the cooling trajectories for TDP cooling gas with densities cm-3 are identical to the TDC cooling trajectory. At lower densities the photoionizing radiation can be seen to affect the ion ratios, especially at low temperatures, as discussed in §4. Diagnostic diagrams for other species of interest may be constructed by using the online data listed in Tables 10 and 11 above.
6. Summary
In this paper I present computations of the equilibrium and non-equilibrium cooling efficiencies, heating rates, and ionization states of low-density radiatively cooling gas exposed to external photoionizing radiation. I consider gas containing the elements H, He, C, N, O, Ne, Mg, Si, S, and Fe. In the calculations I assume cooling in the presence of the metagalactic background radiation (HM12) at redshifts to , which photoionizes the gas and provides heating. I present results for gas temperatures, T, between and K, and for gas densities between and cm-3. I assume that the gas is dust free, and I consider metallicities Z ranging from to times solar. I carry out computations including rate coefficients for all relevant atomic recombination and ionization processes, and the energy loss and gain mechanisms.
For non-equilibrium cooling, I solve the coupled time-dependent ionization and energy-budget equations for the cooling gas. For such gas I assume that the cooling is from an initially hot photoionization equilibrium state down to its thermal equilibrium temperature. The equations and numerical method are presented in §2 and Appendix A. I calculate the nonequilibrium cooling efficiencies assuming isochoric evolution (constant density), and discuss the case of isobaric evolution in §3.1.
Because I include photoionization by external radiation, both the equilibrium and time-dependent properties depend on the assumed density. The radiative cooling efficiency at a given temperature is therefore a function of both the metallicity and density (or, equivalently, ionization parameter ). The results of the cooling computations are presented in Figures 4-9, and listed in Tables 4 and 5 (see Table 3 for guidance).
An important conclusion from §3 is that for every metallicity there exists a threshold density (or, equivalently, a threshold ionization parameter) below which the cooling efficiencies are close to those in photoionization equilibrium, and above which they resemble those in nonequilibrium gas with no external radiation. Above the threshold density, departures from equilibrium ionization are significant, but the impact of the photoionizing radiation may be neglected. Below this threshold density, photoionization plays a critical role, but departures from equilibrium may be neglected.
The threshold ionization parameter corresponding to is . For , this corresponds to a threshold density of cm-3. For metallicities the threshold ionization parameter is a factor of lower than for solar metallicity (), and the threshold densities are therefore a factor of higher ( cm-3). For higher redshifts, the densities corresponding to these ionization parameter are modified as the spectral energy distribution of the metagalactic background evolves. The threshold densities corresponding to at higher redshifts are displayed in Figure 5.
The results of the equilibrium and nonequilibrium ionization calculations are presented in §4. While the thermal evolution (and the associated abundances of the major coolants) in TDP cooling gas may be considered to be either in PIE or TDC, depending on the density, the abundance of some specific species may differ by factors of a few from the TDC / PIE values, and must be followed with a full TDP cooling computation. The full data for the time-dependent photoionized ion fractions are listed in online Tables 10 and 11, as summarized in Table 9.
Ion ratios are useful as diagnostic probes. In §5 I discuss one example, ) versus ), and show how this ratio evolves in photoionized cooling gas and how it varies with density for realistic nonequilibrium conditions.
Appendix A Appendix A. Numerical Details
The computations included in this work rely on the numerical scheme outlined in GS07 and improved in Gnat & Sternberg (2009). The details of this method are summarized here for completeness.
In this work, I consider all ionization stages of the elements H, He, C, N, O, Ne, Mg, Si, S, and Fe. The microphysical ionization and recombination processes included in this computation are photoionization (Verner et al. 1996), including multielectron Auger ionization processes (Kaastra & Mewe 1993) induced by X-ray photons, collisional ionization by thermal electrons (Voronov 1997), radiative recombination (Aldrovandi & Pequignot 1973; Shull & van Steenberg 1982; Landini & Monsignori Fossi 1990; Landini & Fossi 1991; Pequignot et al. 1991; Arnaud & Raymond 1992; Verner et al. 1996), dielectronic recombination (Aldrovandi & Pequignot 1973; Arnaud & Raymond 1992; Badnell et al. 2003; Badnell 2006; Colgan et al. 2003, 2004, 2005; Zatsarinny et al. 2003, 2004a, 2004b, 2005a, 2005b, 2006; Altun et al. 2004, 2005, 2006; Mitnik & Badnell 2004), and neutralization and ionization by charge transfer reactions with hydrogen and helium atoms and ions (Kingdon & Ferland fits222See http://www-cfadc.phy.ornl.gov/astro/ps/data/cx/hydrogen/rates/ct.html., based on Kingdon & Ferland 1996; Ferland et al. 1997; Clarke et al. 1998; Stancil et al. 1998; Arnaud & Rothenflug 1985), including the statistical charge transfer rate coefficients for high-ions with charges greater than (Kingdon & Ferland 1996).
The time-dependent equations for the ion abundance fractions, , of element in ionization stage , are
| (A1) |
In this expression, and are the temperature-dependent rate coefficients for collisional ionization and recombination (radiative plus dielectronic), and , , , and are the rate coefficients for charge transfer reactions with hydrogen and helium that lead to ionization or neutralization. The quantities , , , , and are the particle densities (cm-3) for neutral hydrogen, ionized hydrogen, neutral helium, singly ionized helium, and electrons, respectively. are the local rates of photoionization of ions which result in the ejection of electrons. are the total photoionization rates of ions due to externally incident radiation. For each element , the ion fractions must at all times satisfy .
The ionization equations (A1) and energy balance equation (4) form a set of coupled ordinary differential equations (ODEs). I use a Livermore ODE solver (Hindmarsh 1983) to integrate these equations. This solver integrates both stiff and nonstiff ODE systems, and transitions automatically between stiff and nonstiff solution methods as necessary (see http://www.netlib.org/odepack/). Along the solution, the pressure is advanced in small steps, , where is the current gas pressure, and . These small pressure steps are associated with small time steps , using equation 4. Over the small time step , the pressure is assumed to evolve linearly with time. The cooling efficiencies and heating rates at each point are computed using Cloudy (ver. 13.00), given the local nonequilibrium ion-fractions. When integrating, the local errors for hydrogen, helium, and metal ion-fractions were set to be smaller than , , and , respectively. The accuracy is higher than that used in GS07, because heating is sometimes dominated by trace species. This point is further discussed in Appendix B.
I verify convergence by repeating the computation at a higher resolution (i.e. smaller ) and confirming that the resulting cooling and heating rates and ion fractions as functions of time remain unaltered. I have carried out the integration of the ionization and energy-balance equations down to the thermal equilibrium temperature, at which point cooling will cease. However, if the thermal equilibrium temperature is lower than K, I stop the computation at K, because molecular chemistry and dust cooling, which are not included in this work, may significantly affect the results at lower temperatures.
Appendix B Appendix B. The Role of X-ray Heating
This Appendix considers the role that extreme X-ray radiation plays in setting the heating rates in dilute plasmas (e.g. Madau & Efstathiou 1999, Hambrick et al. 2011).
In order to examine the importance of high-energy photons for the energy budget in low-density gases, we considered the PIE heating rates under the influence of the HM12 metagalactic background radiation. First I consider the heating rates used throughout this paper, namely by the HM12 background up to an energy of keV. Then I considered the HM12 background truncated at an energy of keV. The PIE rates were computed using Cloudy, assuming equilibrium conditions, and taking into account the Klein-Nishina corrections (G. Ferland, private communication).
In figure 19, I plot the ratio between the heating rates, . I consider five different values of metallicity, and time solar, (top to bottom rows), and three different values of redshift, and (from left to right). For each metallicity-redshift combination, I display the ratio in PIE as a function of density (horizontal axis) and temperature (vertical axis). The ratio is indicated by the color-map, and by the labeled contours.
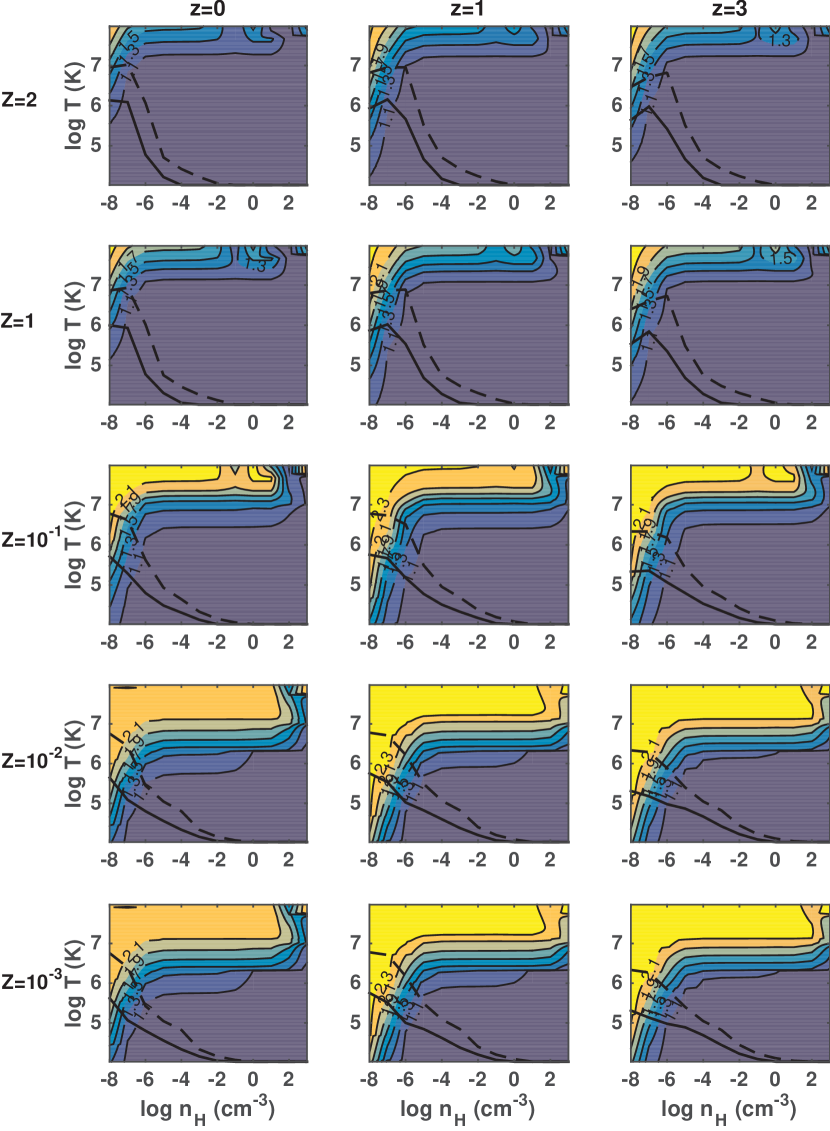
Figure 19 shows that at low temperatures and high densities (lower right in each panel) the X-ray radiation has a negligible contribution to the heating rate. However, at low densities and high temperatures (upper left), X-ray heating plays an important role, and including the keV radiation, may raise the heating rates by factors up to . For (two upper rows), extreme-X-ray heating only becomes important at highly rarified environments (with densities below the cosmic mean, cm-3), and extremely high temperatures ( K). For typical WHIM densities and metallicities (), extreme-X ray heating contributes to the heating budget for temperatures above a few K. For primordial plasma, it contributes above K. Figure 19 shows that in order to accurately estimate the heating rates in hot dilute plasmas, we need a solid knowledge regarding the intensity (and SED) of the extreme X-ray radiation.
Note, however, that while the absolute heating rate estimates should be taken with a grain of salt, our understanding of the thermal evolution of low-density gas is insensitive to details of the extreme X-ray radiation: The solid curve in each panel of Figure 19 shows, for each density, the photoionization equilibrium temperature at which cooling is exactly balanced by heating (computed here using the keV radiation). The dashed curves show, for each density, the temperature for which the heating falls an order of magnitude below cooling. Therefore, in the region to the upper right of the dashed line, heating is orders of magnitude lower than cooling. Below the dashed line, the exact value of the heating rate is important for the thermal evolution of the gas. In particular, it is important for determining the value of the equilibrium temperatures.
This demonstrates that within most of the region for which the ratio
is large, the heating has a negligible impact on the thermal evolution of the
plasma because it is orders of magnitude lower than the cooling.
The X-ray radiation therefore only affects the thermal properties of the
plasma when the value of
is large and heating is comparable to cooling (i.e. below the dashed
line). Figure 19 demonstrates that both conditions apply for low
metallicity gas () at extremely low densities
( cm-3). At these densities, the cooling times
are longer than a Hubble time, even for the less energetic SED (truncated
at keV). For physically relevant parameters (for which the cooling times
are shorter than a Hubble time), the exact details of the X-ray background
are not expected to significantly affect the thermal evolution of the gas.
Acknowledgments
This research was supported by the Israeli Centers of Excellence (I-CORE) program (center no. 1829/12); by the Israel Science Foundation (grant No. 857/14); and by program AR-12655 provided by NASA through a grant from the STScI, under NASA contract NAS5-26555.
References
- Aldrovandi & Pequignot (1973) Aldrovandi, S. M. V., & Pequignot, D. 1973, A&A, 25, 137
- Altun et al. (2004) Altun, Z., Yumak, A., Badnell, N. R., Colgan, J., & Pindzola, M. S. 2004, A&A, 420, 775
- Altun et al. (2005) Altun, Z., Yumak, A., Badnell, N. R., Colgan, J., & Pindzola, M. S. 2005, A&A, 433, 395
- Altun et al. (2006) Altun, Z., Yumak, A., Badnell, N. R., Loch, S. D., & Pindzola, M. S. 2006, A&A, 447, 1165
- Arnaud & Raymond (1992) Arnaud, M., & Raymond, J. 1992, ApJ, 398, 394
- Arnaud & Rothenflug (1985) Arnaud, M., & Rothenflug, R. 1985, A&AS, 60, 425
- Asplund et al. (2005) Asplund, M., Grevesse, N., & Sauval, A. J. 2005, ASP Conf. Ser. 336: Cosmic Abundances as Records of Stellar Evolution and Nucleosynthesis, 336, 25
- Badnell et al. (2003) Badnell, N. R., O’Mullane, M. G., Summers, H. P., et al. 2003, A&A, 406, 1151
- Badnell (2006) Badnell, N. R. 2006, A&A, 447, 389
- Ballantyne et al. (2000) Ballantyne, D. R., Ferland, G. J., & Martin, P. G. 2000, ApJ, 536, 773
- Benson et al. (2002a) Benson, A. J., Lacey, C. G., Baugh, C. M., Cole, S., & Frenk, C. S. 2002a, MNRAS, 333, 156
- Benson et al. (2002b) Benson, A. J., Frenk, C. S., Lacey, C. G., Baugh, C. M., & Cole, S. 2002b, MNRAS, 333, 177
- Benson et al. (2003) Benson, A. J., Frenk, C. S., Baugh, C. M., Cole, S., & Lacey, C. G. 2003, MNRAS, 343, 679
- Cantalupo (2010) Cantalupo, S. 2010, MNRAS, 403, L16
- Churchill et al. (2014) Churchill, C. W., Klimek, E., Medina, A., & Vander Vliet, J. R. 2014, arXiv:1409.0916
- Churchill et al. (2015) Churchill, C. W., Vander Vliet, J. R., Trujillo-Gomez, S., Kacprzak, G. G., & Klypin, A. 2015, ApJ, 802, 10
- Badnell et al. (2003) Badnell, N. R., O’Mullane, M. G., Summers, H. P., et al. 2003, A&A, 406, 1151
- Badnell (2006) Badnell, N. R. 2006, A&A, 447, 389
- Clarke et al. (1998) Clarke, N. J., Stancil, P. C., Zygelman, B., & Cooper, D. L. 1998, Journal of Physics B Atomic Molecular Physics, 31, 533
- Colgan et al. (2003) Colgan, J., Pindzola, M. S., Whiteford, A. D., & Badnell, N. R. 2003, A&A, 412, 597
- Colgan et al. (2004) Colgan, J., Pindzola, M. S., & Badnell, N. R. 2004, A&A, 417, 1183
- Colgan et al. (2005) Colgan, J., Pindzola, M. S., & Badnell, N. R. 2005, A&A, 429, 369
- Crighton et al. (2015) Crighton, N. H. M., Hennawi, J. F., Simcoe, R. A., et al. 2015, MNRAS, 446, 18
- Drake & Testa (2005) Drake, J. J., & Testa, P. 2005, Nature, 436, 525
- Efstathiou (1992) Efstathiou, G. 1992, MNRAS, 256, 43P
- Feldmann & Mayer (2015) Feldmann, R., & Mayer, L. 2015, MNRAS, 446, 1939
- Ferland et al. (1997) Ferland, G. J., Korista, K. T., Verner, D. A., & Dalgarno, A. 1997, ApJ, 481, L115
- Gnat & Sternberg (2007) Gnat, O., & Sternberg, A. 2007, ApJS, 168, 213
- Gnat & Sternberg (2009) Gnat, O., & Sternberg, A. 2009, ApJ, 693, 1514
- Gnedin & Hollon (2012) Gnedin, N. Y., & Hollon, N. 2012, ApJS, 202, 13
- Haardt & Madau (2012) Haardt, F., & Madau, P. 2012, ApJ, 746, 125
- Hambrick et al. (2011) Hambrick, D. C., Ostriker, J. P., Johansson, P. H., & Naab, T. 2011, MNRAS, 413, 2421
- Hindmarah (1983) Hindmarsh, A. C. 1983, in Scientific Computing, ed. R. S. Stepleman et al. (Amsterdam: North-Holland), 55
- Kaastra & Mewe (1993) Kaastra, J. S., & Mewe, R. 1993, A&AS, 97, 443
- Kafatos (1973) Kafatos, M. 1973, ApJ, 182, 433
- Kingdon & Ferland (1996) Kingdon, J. B., & Ferland, G. J. 1996, ApJS, 106, 205
- Landini & Monsignori Fossi (1990) Landini, M., & Monsignori Fossi, B. C. 1990, A&AS, 82, 229
- Landini & Fossi (1991) Landini, M., & Fossi, B. C. M. 1991, A&AS, 91, 183
- Madau & Efstathiou (1999) Madau, P., & Efstathiou, G. 1999, ApJ, 517, L9
- Mitnik & Badnell (2004) Mitnik, D. M., & Badnell, N. R. 2004, A&A, 425, 1153
- McCray (1987) McCray, R. A. 1987, Spectroscopy of Astrophysical Plasmas, 255
- Navarro & Steinmetz (1997) Navarro, J. F., & Steinmetz, M. 1997, ApJ, 478, 13
- Oppenheimer & Schaye (2013) Oppenheimer, B. D., & Schaye, J. 2013, MNRAS, 434, 1063
- Pequignot et al. (1991) Pequignot, D., Petitjean, P., & Boisson, C. 1991, A&A, 251, 680
- Puchwein et al. (2015) Puchwein, E., Bolton, J. S., Haehnelt, M. G., et al. 2015, MNRAS, 450, 4081
- Richings & Schaye (2015) Richings, A. J., & Schaye, J. 2015, arXiv:1506.08829
- Shull & van Steenberg (1982) Shull, J. M., & van Steenberg, M. 1982, ApJS, 48, 95
- Stancil et al. (1998) Stancil, P. C., Havener, C. C., Krstić, P. S., et al. 1998, ApJ, 502, 1006
- Thompson et al. (2016) Thompson, T. A., Quataert, E., Zhang, D., & Weinberg, D. H. 2016, MNRAS, 455, 1830
- Turner et al. (2015) Turner, M. L., Schaye, J., Steidel, C. C., Rudie, G. C., & Strom, A. L. 2015, MNRAS, 450, 2067
- Vasiliev (2011) Vasiliev, E. O. 2011, MNRAS, 414, 3145
- Verner et al. (1996) Verner, D. A., Ferland, G. J., Korista, K. T., & Yakovlev, D. G. 1996, ApJ, 465, 487
- Voronov (1997) Voronov, G. S. 1997, Atomic Data and Nuclear Data Tables, 65, 1
- Weinberg et al. (1997) Weinberg, D. H., Hernquist, L., & Katz, N. 1997, ApJ, 477, 8
- White & Rees (1978) White, S. D. M., & Rees, M. J. 1978, MNRAS, 183, 341
- Wiersma et al. (2009) Wiersma, R. P. C., Schaye, J., & Smith, B. D. 2009, MNRAS, 393, 99
- Zatsarinny et al. (2003) Zatsarinny, O., Gorczyca, T. W., Korista, K. T., Badnell, N. R., & Savin, D. W. 2003, A&A, 412, 587
- Zatsarinny et al. (2004) Zatsarinny, O., Gorczyca, T. W., Korista, K. T., Badnell, N. R., & Savin, D. W. 2004a, A&A, 417, 1173
- Zatsarinny et al. (2004) Zatsarinny, O., Gorczyca, T. W., Korista, K., Badnell, N. R., & Savin, D. W. 2004b, A&A, 426, 699
- Zatsarinny et al. (2005) Zatsarinny, O., Gorczyca, T. W., Korista, K. T., et al. 2005a, A&A, 438, 743
- Zatsarinny et al. (2005) Zatsarinny, O., Gorczyca, T. W., Korista, K. T., et al. 2005b, A&A, 440, 1203
- Zatsarinny et al. (2006) Zatsarinny, O., Gorczyca, T. W., Fu, J., et al. 2006, A&A, 447, 379