Radial pulsations of red giant branch stars
Yu. A. Fadeyev***E–mail: fadeyev@inasan.ru
Institute of Astronomy, Russian Academy of Sciences, Pyatnitskaya ul. 48, Moscow, 119017 Russia
Received May 15, 2017
Abstract — We performed hydrodynamic computations of nonlinear stellar pulsations of population I stars at the evolutionary stages of the ascending red giant branch and the following luminosity drop due to the core helium flash. Red giants populating this region of the Hertzsprung–Russel diagram were found to be the fundamental mode pulsators. The pulsation period is the largest at the tip of the red giant branch and for stars with initial masses from to ranges from day to day, respectively. The rate of period change during the core helium flash is comparable with rates of secular period change in Mira type variables during the thermal pulse in the helium shell source. The period change rate is largest () in stars with initial mass and decreases to for stars of the evolutionary sequence . Theoretical light curves of red giants pulsating with periods show the presence of the secondary maximum similar to that observed in many Miras.
Keywords: stars: variable and peculiar
1 introduction
The red giant branch (RGB) of the Hertzsprung–Russel diagram (HRD) is populated by the post–main–sequence stars with the hydrogen shell source surrounding the inert helium core. The central gas density of the red giant with mass is as high as whereas the central temperature is K, so that the electron gas of the helium core is in degenerate state. Due to the weak temperature dependence of the pressure of a degenerate gas the gradual increase of the central temperature in the contracting degenerate helium core leads to the helium flash, that is the explosive growth of energy generation by the triple–alpha reactions (Schwarzschild and Härm 1962; Härm and Schwarzschild 1964; Thomas 1967). The energy released during the helium flash is highest in low–mass stars and decreases with increasing mass of the star, that is with decreasing degeneracy of the electron gas. For example, in population II red giants with mass the maximum luminosity generated in the helium core is (Despain 1981), whereas for becomes as low as (Kippenhahn et al. 2012). The short–term increase of the helium core luminosity is responsible for cease of energy production in the hydrogen shell source and decrease of the surface luminosity by one or two orders of magnitude. Therefore, the stars at the evolutionary stage preceding the helium flash populate the tip of the red giant branch (TRGB).
Interest in TRGB stars was confined mainly to low–mass () population II red giants due to the fact that their luminosity is almost independent of the star age and is only a function of the mass of the degenerate helium core (Salaris et al. 2002; Greggio and Renzini 2011). Therefore, measurements of the brightness of TRGB stars allow us to determine the distances for galaxies of the Local Group with accuracy comparable with that based on the Cepheid period–luminosity relation (Lee et al. 1993). However one should bear in mind that a disadvantage of the distance scale based on the photometry of TRGB stars is due to uncertainties in bolometric corrections of red giants (Salaris and Cassisi 1997). These difficulties might, however, be avoided in the case of observed pulsational variability because the stellar radius can be determined by methods of stellar pulsation theory.
By this time, the pulsational variability is detected in RGB stars of the local solar neighbourhood (Tabur et al. 2009) and Magellanic Clouds (Ita et al. 2002). The goal of the present study is to investigate the evolutionary and pulsation models of population I RGB stars with initial mass fractional abundances of helium and heavier elements and , respectively. The initial masses of evolutionary models are . The results presented below are based on consistent stellar evolution and stellar pulsation computations. The methods of computations are described in our previous papers (Fadeyev 2016; 2017).
2 results of computations
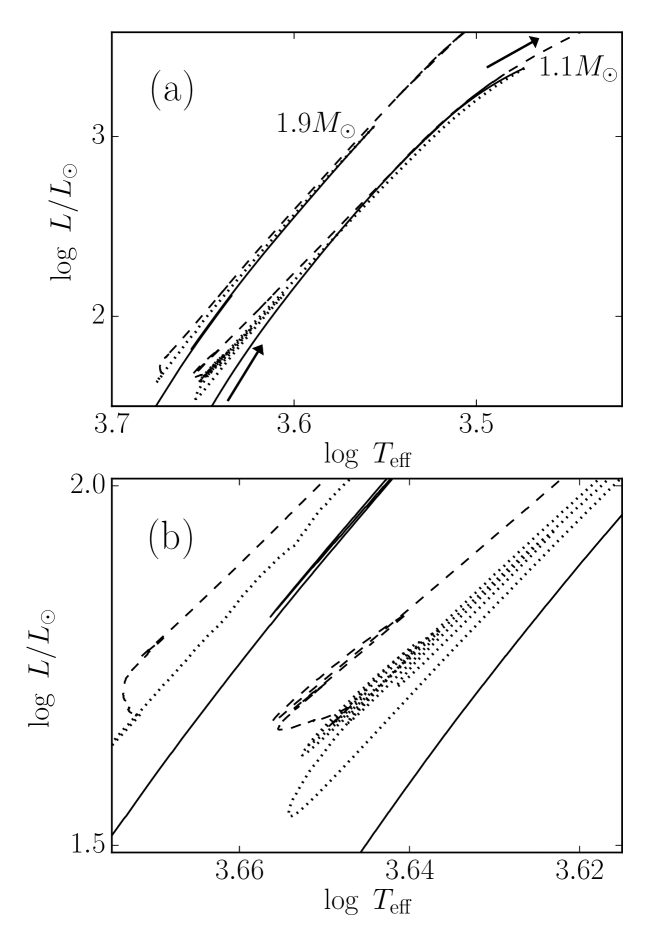
Evolutionary tracks of the stars with initial masses and in the RGB region are shown in Fig. 1(a). Each track is represented by the solid line (the ascending RGB), the dotted line (the stage of helium flash) and the dashed line (the early AGB phase). The initial masses are indicated near TRGB points and the direction of evolution is indicated by arrows. In the present work we investigated radial oscillations of red giants during ascent of the RGB and then during the helium flash. On the HRD the evolutionary tracks of these stages almost coincide, albeit the evolutionary time differ by several orders of magnitude. For the sake of more clarity, the zoomed evolutionary tracks near the minimum surface luminosity are shown in Fig. 1(b). Red giants are the fundamental mode pulsators and their oiscillations are driven by the –mechanism in the hydrogen ionization zone.
2.1 models of pulsating stars ascending the red giant branch
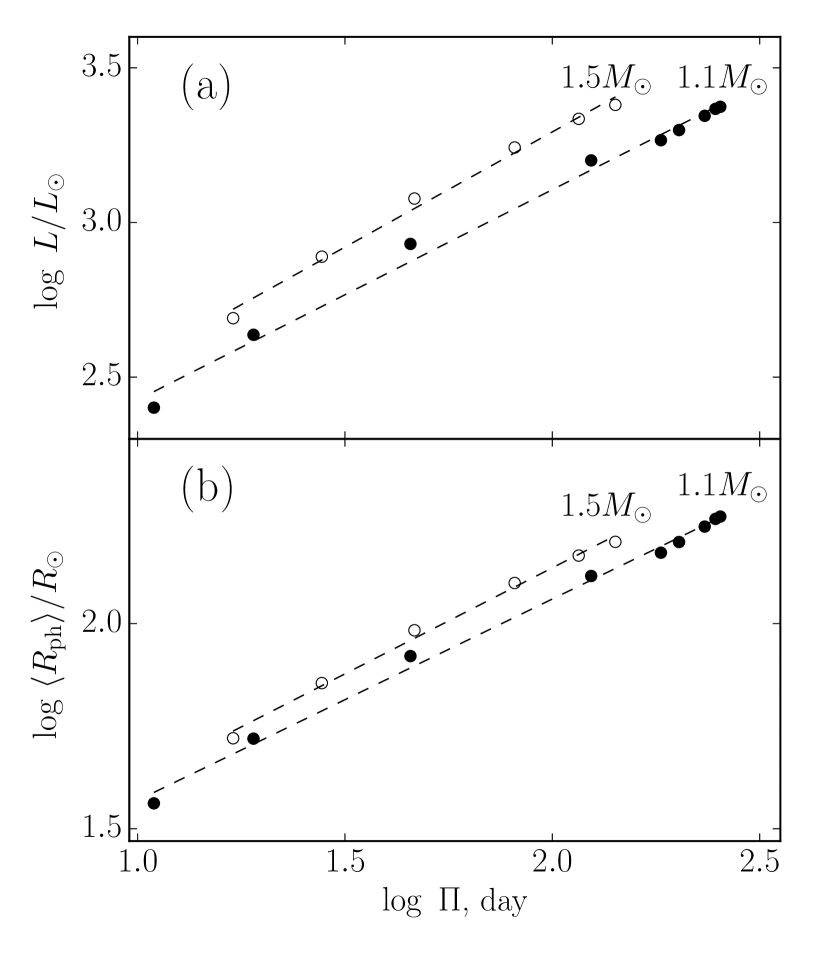
Evolution of the star during the hydrogen shell burning phase is accompanied by the growth of the mass of the degenerate helium core and the surface luminosity (Refsdal and Weigert 1970). Therefore during evolution along the ascending red giant branch the period of radial oscillations increases more than an order of magnitude, the increase of the period being more significant in stars with smaller masses due to the lower gas density of the outer convection zone. Evolutionary changes of pulsational properties of RGB stars with initial masses and are illustrated by the period–luminosity and period–radius relations shown in Fig. 2. One should be noted that for the period–radius relation we used the mean values of the photosphere radius obtained from the limit cycle hydrodynamic models.
The least–squares fits for the period–luminosity and period–radius relations are written as
| (1) |
и
| (2) |
respectively.
TRGB stars are of greatest interest and their evolutionary and pulsational properties are listed in the table, where , and are the mass, the age and the luminosity of the model of the evolutionary sequence, is the maximum luminosity of the helium core during the core helium flash, is the mass of the helium core, and are the pulsation period and the pulsation constant. For stars with initial masses the pulsation constant can be fitted as a function of the initial mass with relative deviation less than 2% by the following relation:
| (3) |
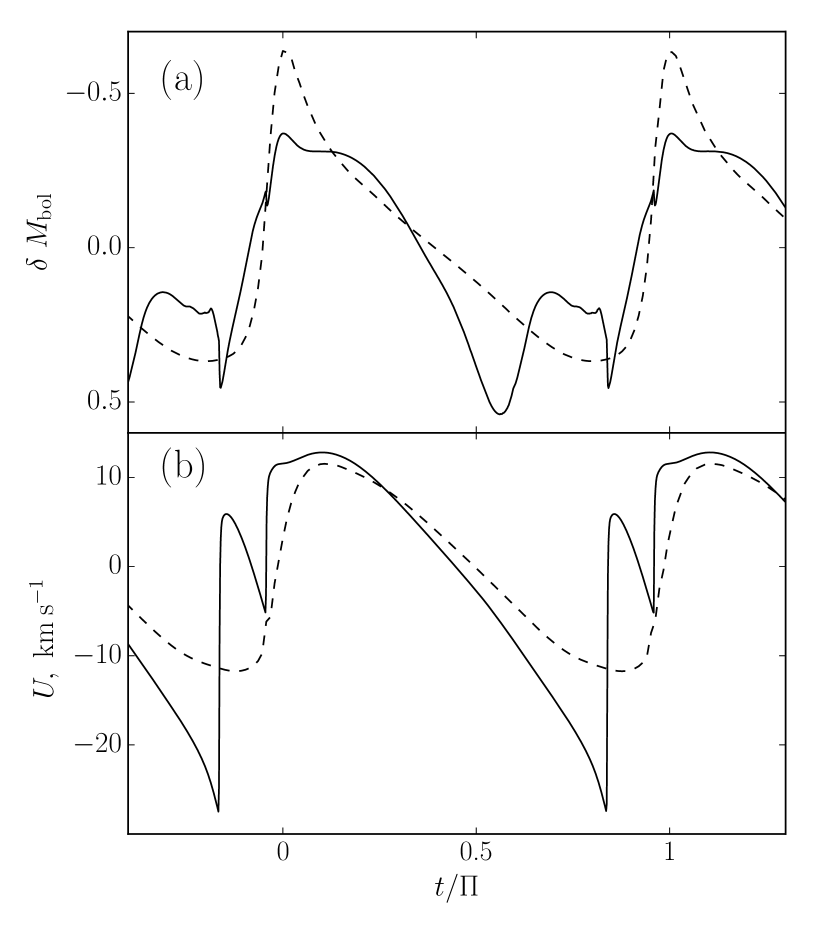
As seen from table, the fundamental mode period decreases by a factor of eight as the initial mass increases from to . Moreover, the light and the outer boundary velocity curves approach a sinusoidal shape with increasing stellar mass, whereas the amplitude of limit cycle oscillations remains almost unchanged (see Fig. 3). The light and velocity curves of the low–mass model () deserve attention due to the existence of the secondary maximum (the hump) which is usually considered as the typical feature of Mira type variables (Lockwood and Wing 1971) which are the stars at a more advanced AGB evolutionary stage.
2.2 stellar pulsations during the core helium flash
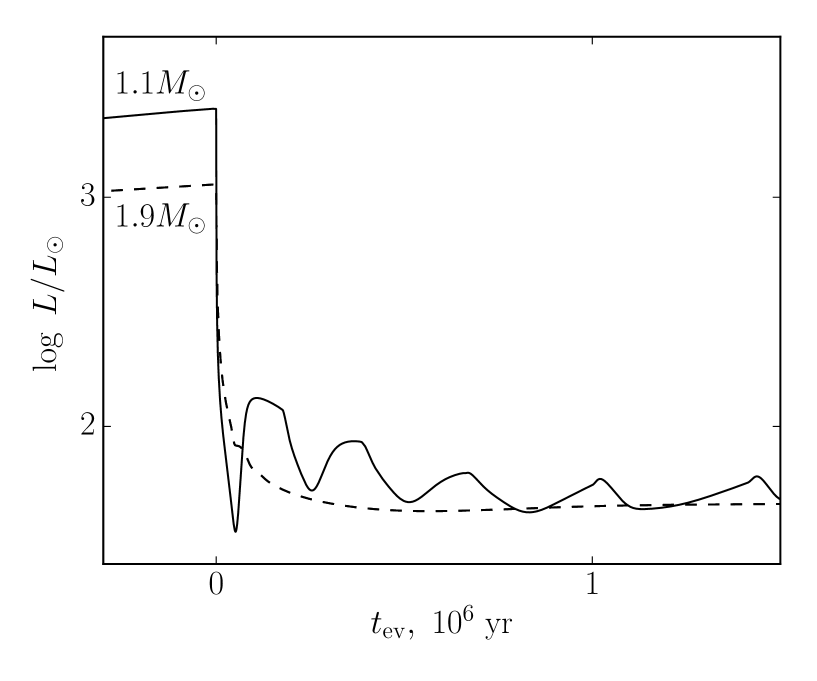
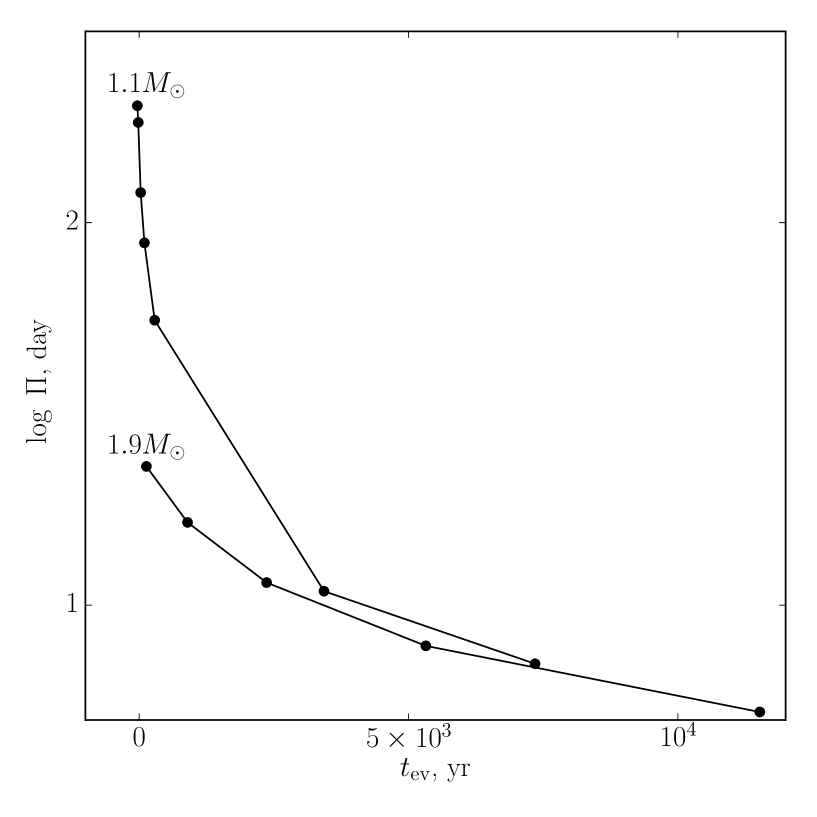
Fig. 4 shows the temporal dependencies of the surface luminosity after the core helium flash in red giants with initial masses and . For the sake of convenience the evolutionary time is set to zero at the maximum luminosity of the helium core. The initial conditions of hydrodynamic models were determined for .
One should be noted that the core helium flash occurs as a sequence of peaks of the helium core luminosity with gradually decreasing amplitude, i.e. relaxation oscillations (Schwarzschild and Härm 1967; Thomas 1967). Relaxation oscillations are most conspicuous in low–mass red giants and are responsible for oscillations of the surface luminosity (see Fig. 4). The present study was aimed to determine the rate of period change during the gradual drop of the surface luminosity, so that the stage of relaxation oscillations after the helium flash ( yr for the evolutionary sequence ) was ignored.
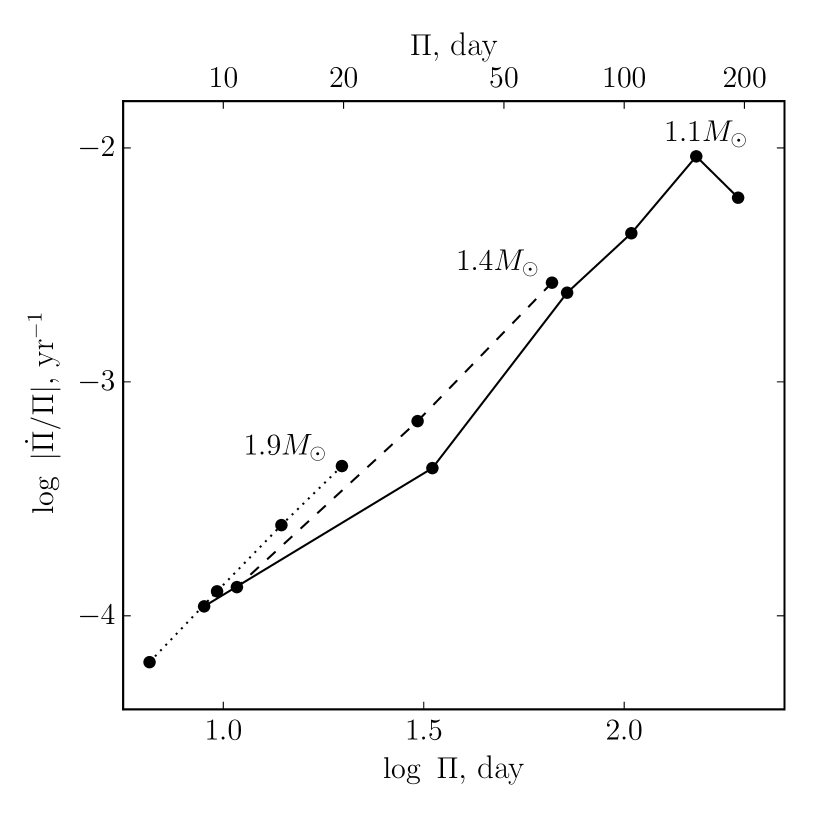
The results of hydrodynamic computations for the models of red giants during the evolutionary stage of the core helium flash are presented in Fig. 5, where the plots of the radial pulsation period of stars with initial masses and are shown as a function of evolutionary time . Theoretical estimates of the period change rate were evaluated by the second–order numerical differentiation. The diagram period–period change rate for models of evolutionary sequences with initial masses , and is shown in Fig. 6.
3 discussion
Results of evolutionary and hydrodynamic computations for models of RGB stars presented in this study supplement ones from our previous works devoted to investigation of pulsations in stars of the asymptotic giant branch (Fadeyev 2016; 2017). The main conclusion of these works is that the RGB stars as well as the more luminous AGB stars are the fundamental mode pulsators.
Of great interest is the role of the pulsation period as a criterion in establishing the evolutionary status of the red giant. As seen in table, the luminosity of TRGB stars with is almost independent of the initial mass and the star age, whereas the period of radial oscillations gradually decreases with increasing . If we assume that the age of red giants of the local solar neighbourhood observed by Tabur et al. (2009) is yr, then from table we find that the maximum period of the fundamental mode is day. A cursory inspection of Table 3 from the work Tabur et al. (2009) allows us to conclude that among 261 observed red giants 45 stars have periods longer than 200 day. In order to avoid such a contradiction one should either to verify the methods of period determination or to assume that these red giants belong AGB stars. It should be noted that division of red giants into RGB and AGB stars is complicated due to the fact hydrodynamic models of pulsating RGB stars show the presence of secondary maxima on their light curves. Furthermore, the rate of period decrease during the core helium flash is by an order of magnitude comparable with rates of secular period decrease during the thermal pulse of typical AGB stars (Fadeyev 2017).
references
-
1.
K.H. Despain, Astrophys. J. 251, 639 (1981).
-
2.
Yu.A. Fadeyev, Pis’ma Astron. Zh. 42, 731 (2016) [Astron. Lett. 42, 665 (2016)].
-
3.
Yu.A. Fadeyev, Pis’ma Astron. Zh. 43, in press (2017) [Astron.Lett. 43, in press (2017)].
-
4.
L. Greggio and A. Renzini, Stellar populations. A user guide from low to high redshift (Wiley-VCH, 2011).
-
5.
R. Härm and M. Schwarzschild, Astrophys. J. 139, 594 (1964).
-
6.
Y. Ita, T. Tanabé, N. Matsunaga, Y. Nakajima, C. Nagashima, T. Nagayama, D. Kato, M. Kurita, T. Nagata, S. Sato, M. Tamura, H. Nakaya, Y. Nakada, MNRAS 337, L31 (2002).
-
7.
R. Kippenhahn, A. Weigert, and A. Weiss, Stellar structure and evolution, 2nd ed. (Springer, 2012).
-
8.
M.G. Lee, W.L. Freedman, and B.F. Madore, Astrophys. J. 417, 553 (1993).
-
9.
G.W. Lockwood and R.F. Wing, Astrophys. J. 169, 63 (1971).
-
10.
S. Refsdal and A. Weigert, 1970, Astron. Astrophys. 6, 426 (1970).
-
11.
M. Salaris and S. Cassisi, MNRAS 289, 406 (1997).
-
12.
M. Salaris, S. Cassisi, and A. Weiss, Publ. Astron. Soc. Pacific 114, 375 (2002).
-
13.
V. Tabur, T.R. Bedding, L.L. Kiss, T.T. Moon, B. Szeidl, and H. Kjeldsen, MNRAS 400, 1945 (2009).
-
14.
H.–C. Thomas, Zeitschrift für Astrophys. 67, 420 (1967).
-
15.
M. Schwarzschild and R. Härm, Astrophys. J 136, 158 (1962).
-
16.
M. Schwarzschild and R. Härm, Astrophys. J 150, 961 (1967).
| , day | , day | ||||||
|---|---|---|---|---|---|---|---|
| 1.1 | 0.871 | 8.49 | 3.374 | 9.268 | 0.464 | 254.2 | 0.0791 |
| 1.2 | 0.999 | 6.24 | 3.385 | 9.276 | 0.464 | 226.3 | 0.0785 |
| 1.3 | 1.122 | 4.71 | 3.385 | 9.277 | 0.464 | 162.4 | 0.0721 |
| 1.4 | 1.241 | 3.64 | 3.384 | 9.278 | 0.464 | 157.6 | 0.0710 |
| 1.5 | 1.357 | 2.86 | 3.380 | 9.272 | 0.465 | 141.9 | 0.0690 |
| 1.6 | 1.475 | 2.29 | 3.362 | 9.236 | 0.460 | 116.1 | 0.0660 |
| 1.7 | 1.599 | 1.88 | 3.307 | 9.122 | 0.451 | 83.7 | 0.0624 |
| 1.8 | 1.728 | 1.58 | 3.207 | 8.824 | 0.433 | 54.3 | 0.0581 |
| 1.9 | 1.854 | 1.34 | 3.054 | 8.008 | 0.410 | 33.4 | 0.0555 |