reception date \Acceptedacception date \Publishedpublication date
astrochemistry — ISM: individual objects (Taurus Molecular Cloud-1) — ISM: molecules
LETTER
First Detection of HCN in the Interstellar Medium
Abstract
We report the first detection of HCN with the rotational line from the cyanopolyyne peak in Taurus Molecular Cloud-1 (TMC-1 CP) using the 45-m radio telescope of the Nobeyama Radio Observatory. The column density of HCN is derived to be () cm (). We apply the double isotope method to derive the N/N ratios of HCN and HCN in TMC-1 CP. The N/N ratios are calculated to be and for HCN and HCN, respectively. The N/N ratio of HCN is lower than the elemental ratio in the local interstellar medium () and slightly higher than that of HCN in TMC-1 CP. Since HCN is formed via the neutral-neutral reaction between CH and CN, the slightly higher N/N ratio of HCN may support our previous suggestions that the main formation mechanism of HCN is the ion-molecule reactions between hydrocarbon ions (CH) and nitrogen atoms.
1 Introduction
Carbon-chain molecules are unique species in the interstellar medium, and the studies about their chemical mechanisms have been progressed mainly by radio astronomical observations. Survey observations showed that carbon-chain molecules are good chemical evolutional tracers (1992ApJ...392..551S; 2009ApJ...699..585H; 2017ApJS..228...12T). Carbon-chain molecules such as CCS are abundant in young low-mass dark clouds and decrease in evolved star-forming cores. The tendency is explained by the chemical characteristics of carbon-chain species; they are formed from carbon cations (C) or carbon atoms (C) (1992ApJ...392..551S), destroyed by the reactions with H, He, or O, and depleted onto dust grains (2013ChRv...113...8981). However, since carbon-chain species have unsaturated bonds, they are unstable, and hence it is difficult to derive their main formation mechanisms from laboratory experiments. Consequently, the chemical network model calculations about carbon-chain molecules have large uncertainties despite many attempts.
Recent development of the radio astronomical equipment allows us to detect weak lines, including isotopologues of carbon-chain molecules, within reasonable time. In order to investigate main formation mechanisms of carbon-chain molecules using their C isotopic fractionation (the differences in abundance among the C isotopologues), various observations deriving C isotopic fractionation have been carried out in HCN (1998A&A...329.1156T), HCN (2016ApJ...817..147T), CCH (2010A&A...512A...31S), CCS (2007ApJ...663...1174), CS, and CH (2013JPCA...117...9831) toward the cyanopolyyne peak in Taurus Molecular Cloud-1 (TMC-1 CP; pc), and in cyclic-CH (2015ApJ...807...66Y) toward the low-mass star-forming region L1527 ( pc).
The main formation pathway of HCN in TMC-1 CP was suggested as the neutral-neutral reaction between CH and CN, from the abundance ratios of HCCCNHCCCNHCCCN = (1998A&A...329.1156T). The observed abundance ratios can be explained by the reaction of CH + CN, because CH has two equivalent carbon atoms and C tends to concentrate in CN via the exothermic reaction between C and CN (1991ApJ...379..267K). 2016ApJ...830..106T also carried out observations deriving C isotopic fractionation of HCN toward the low-mass star-forming region L1527 and the high-mass star-forming region containing a hot core G28.28-0.36 ( kpc). They suggested that the main formation pathways of HCN in the both star-forming regions are the same one as that in TMC-1 CP (CH + CN).
On the other hand, 2016ApJ...817..147T proposed that the main formation mechanism of HCN in TMC-1 CP is the ion-molecule reactions between hydrocarbon ions (CH; ) and nitrogen atoms followed by the electron recombination reactions, based on the observational results showing the abundance ratios of HCCCCCNHCCCCCNHCCCCCNHCCCCCNHCCCCCN = () (1). In the proposed ion-molecule reactions, all carbon atoms in HCN originate from the hydrocarbon ions. Such large hydrocarbon ions are produced through various processes, and there is no reason that C is concentrated in a particular carbon atom in large hydrocarbon ions. In other words, there should be no clear C isotopic fractionation. One difficulty using the C isotopic fractionation method is that the differences in the C/C ratio of each isotopologue are small, and we need long integration time to obtain spectra with sufficient signal-to-noise ratios.
In the present letter, we report the first detection of HCN from TMC-1 CP. We derive its column density and the N/N ratio of HCN. From the N/N ratio, we suggest the ion-molecule reactions as the main formation mechanism of HCN in TMC-1 CP also suggested from our previous work of the C isotopic fractionation of HCN.
2 Observations
We carried out observations of HCN (; 23.37544 GHz (2005JChPh.122s4319S)) with the Nobeyama 45-m radio telescope during 2014 December and 2015 January (2014-2015 season)1112016ApJ...817..147T described the observation date as 2014 March, April (2013-2014 season), December and 2015 January (2014-2015 season). In 2014 March and April, we carried out observations only in the 42 GHz band using the Z45 receiver. The observations in the 23 GHz band using the H22 receiver were conducted only in 2014 December and 2015 January; the data presented here were taken simultaneously with the normal species and the five C isotopologues of HCN in the 23 GHz band in 2014 December and 2015 January.. The observed position was (, ) = (044142\fs49, 25\arcdeg41\arcmin27\farcs0) for TMC-1 CP. The off-source position was set to be +30’ away in the right ascension. We checked the telescope pointing every 1.5 hr by observing the SiO maser line () from NML Tau. The pointing error was less than 3".
We used the H22 receiver, which enables us to obtain dual polarization data simultaneously. The H22 receiver is a single sideband (USB) receiver with its gain above 25 dB. The beam size and the main beam efficiency () were 72" and 0.8, respectively. The system temperatures were from 90 to 110 K, depending on the weather conditions and elevations. We used the SAM45 FX-type digital correlator in frequency setups whose bandwidths and frequency resolutions were 63 MHz and 15.26 kHz, respectively. The frequency resolution corresponds to the velocity resolution of 0.2 km s.
We used the chopper wheel method. We then estimated the absolute intensity calibration error at 10%, which is a typical value for the chopper wheel method.
We employed the Smoothed Bandpass Calibration (SBC) method (2012PASJ...64..118Y). The SBC method allows us to reduce the time for observing off-source positions. The scan pattern was set as 20 seconds and 5 seconds for on-source and off-source positions, respectively. We applied 60 channel-smoothing only for off-source spectra.
3 Results and Analysis
3.1 Results
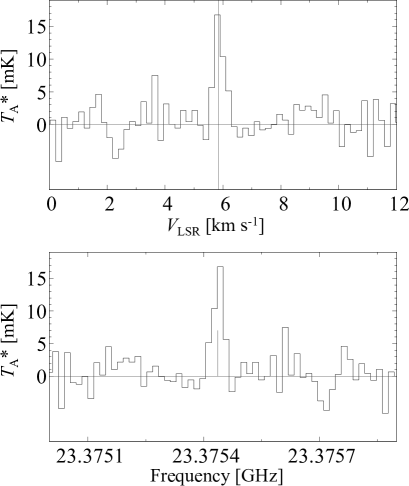
The rotational line of HCN was clearly detected with the signal-to-noise ratio of 7, as shown in Figure 1. The on-source integration time is 45 hours 2 minutes, and the rms noise level in the line-free region is 2.4 mK in with the velocity resolution of 0.2 km s. We fitted the spectra with a Gaussian profile, and obtained the spectral line parameters. The value of of the line is km s, which is consistent with the systemic velocity of TMC-1 CP (5.85 km s). The peak intensity (), the line width (FWHM), and the integrated intensity () are mK, km s, and K km s (), respectively. The errors of the line parameters were derived from the Gaussian fitting.
We verified the line identification from the line width and rest frequency. First, the derived line width ( km s) is consistent with the typical value in TMC-1 CP (0.5 km s, 2004PASJ...56...69K) and the spectrum does not appear a spiky instrumental spurious. Second, there is no other detectable line in TMC-1 CP in the 23.3523.4 GHz band according to the Splatalogue database for astronomical spectroscopy222http://www.cv.nrao.edu/php/splat/. Thus, we concluded that the detected emission line should be identified as HCN.
3.2 Analysis
We calculated the column density assuming the local thermodynamic equilibrium (LTE). We used the following formulae (2016ApJ...817..147T):
| (1) |
where
| (2) |
and
| (3) |
In Equation (1), denotes the antenna temperature, f the beam filling factor, the main beam efficiency (0.8, Section 2), and the optical depth. Since a size of the emitting region of carbon-chain molecules in TMC-1 CP is approximately 2.5’ according to the mapping observations by 1992ApJ...394..539H, we used 0.8 for f. is the excitation temperature, is the cosmic microwave background temperature ( K), and J(T) in Equation (2) is the Planck function. In the calculation, we adopted the excitation temperature of 6.5 K of the normal species (2016ApJ...817..147T). In Equation (3), N denotes the column density, the line width (FWHM), the partition function, the permanent electric dipole moment of HCN (4.33 D; 1976JMoSp..62..175A), and the energy of the lower rotational energy level.
The derived column density of HCN is () cm (). The N/N ratio of HCN is determined to be (), using the column density of the normal species (( cm, 2016ApJ...817..147T). 2016ApJ...817..147T derived the optical depth of the normal species to be (), and the uncertainty of the column density of the normal species should be small. The errors contain the errors from the Gaussian fitting and the 10% absolute intensity uncertainty from the chopper wheel method.
4 Discussion
4.1 Deriving the N/N ratio of HCN using the double isotope method
The N/N ratios are often derived with the double isotope method, using the two isotopologues (e.g., 2013Icarus...223...582). In the case of HCN, we can calculate five cases independently, and reduce the uncertainty in the N/N ratio statistically. We observed the normal species, the five C isotopologues, and the N isotopologue simultaneously. Therefore, we can exclude the pointing and calibration errors. We calculated the N/N ratios of HCN with the double isotope method, using the following formula:
| (4) |
where (). In Equation (4), HCN/HCCCN represents the C/C ratios (column of C/C in Table 4.1, taken from 2016ApJ...817..147T). We derived HCCCN/HCN using the integrated intensities (column of x/HCN in Table 4.1), because both N and C isotopologues are optically thin. < > denotes the mean value. We calculated the HCN/HCN ratio in the case of and using Equation (4). We repeated the calculations until and , and finally we averaged the five HCN/HCN ratios. The calculated five N/N ratios of HCN are summarized in Table 4.1 (column of N/N), and these values are consistent with each other. The averaged N/N ratio of HCN was derived to be (1). The derived N/N ratio of HCN using the double isotope method is consistent with () derived in Section 3.2. The N/N ratio of HCN in TMC-1 CP is smaller than that of the elemental ratio of (2011Sci...332.1533M).
The integrated intensity ratios between the five C isotopologues and N isotopologue, C/C ratios, and N/N ratios of HCN C isotopologues (X) X/HCN C/C N/N HCCCCCN 3.6 (0.5) 98 (14) 352 (98) HCCCCCN 3.4 (0.6) 101 (14) 345 (96) HCCCCCN 3.5 (0.5) 95 (12) 331 (90) HCCCCCN 3.6 (0.5) 93 (13) 337 (94) HCCCCCN 4.2 (0.6) 85 (11) 355 (96) Average value 344 (53) {tabnote} The numbers in parenthesis represent one standard deviation. The integrated intensities of C isotopologues of HCN and the C/C ratios were derived by 2016ApJ...817..147T.