ISM: clouds — Stars: formation — Methods: numerical — Hydrodynamics
FORMATION OF MASSIVE, DENSE CORES BY CLOUD-CLOUD COLLISIONS
Abstract
We performed sub-parsec ( 0.014 pc) scale simulations of cloud-cloud collisions of two idealized turbulent molecular clouds (MCs) with different masses in the range of and with collision speeds of 5 30 km/s. Those parameters are larger than Takahira, Tasker and Habe (2014) (paper I) in which the colliding system showed a partial gaseous arc morphology that supports the NANTEN observations of objects indicated to be colliding MCs by using numerical simulations. Gas clumps with density greater than g cm-3 were identified as pre-stellar cores and tracked through the simulation to investigate the effect of mass of colliding clouds and collision speeds on the resulting core population. Our results demonstrate that the smaller cloud property is more important for the results of cloud-cloud collisions. The mass function of formed cores can be approximated by a power law relation with index = -1.6 in slower cloud-cloud collisions ( km/s), in good agreement with observation of MCs. A faster relative speed increases the number of cores formed in the early stage of collisions and shortens the gas accretion phase of cores in the shocked region, leading to the suppression of core growth. The bending point appears in the high mass part of the core mass function and the bending point mass decreases with increasing of the collision speed for the same combination of colliding clouds. The high mass part of the core mass function than the bending point mass can be approximated by a power law with that is similar to the power index of the massive part of the observed stellar initial mass function. We discuss implications of our results for the massive star formation in our Galaxy.
1 INTRODUCTION
Massive star formation is very important in astrophysics, since massive stars play critical roles in galaxy formation and evolution. However, the processes of massive star formation are not well understood. Recent observations show possible connection between massive star formation and cloud-cloud collisions (Furukawa et al., 2009; Ohama et al., 2010; Torii et al., 2011; Fukui et al., 2014; Torii et al., 2015; Fukui et al., 2016; Torii et al., 2017). Molecular lines observations of the two Super Star Clusters, Westerland 2 and NGC 3603 (Furukawa et al., 2009; Ohama et al., 2010; Fukui et al., 2014) and the Trified Nebula (Torii et al., 2011) show two molecular clouds of relative velocities of 10 20 km/s associated with these objects. Notably, the relative velocities observed in these three events are too high for the clouds to be gravitationally bound to one another. Bridge features that appear in the position velocity diagrams in these observations are clear evidence of interaction by cloud-cloud collisions (Haworth et al., 2015; Bisbas et al., 2017). The resulting shock waves between the clouds compress the gas and form dense gas that is possible to form the massive stars.
Torii et al. (2015) report two molecular clouds with relative velocities in the Spitzer bubble, RCW 120, as an evidence of cloud-cloud collision. They also noted that the ring structure seen in RCW 120 is very similar to the product of cloud collisions by theoretical calculations by Habe & Ohta (1992), Anathpindika (2010), and Takahira, Tasker & Habe (2014) (paper I). Similar arc like structures are observed in galactic central molecular clouds (Higuchi et al., 2014; Tsuboi et al., 2015).
Habe & Ohta (1992) performed two dimensional, axisymmetric simulations of a head-on collision between non-identical smoothed clouds. They found that the larger cloud was disrupted by the bow-shock caused by the colliding smaller cloud which was also compressed by the same bow-shocked region. This compression caused the post-shock gas in the smaller cloud to become gravitationally unstable, even in the case where the cloud was initially below its Jeans mass. The geometric structure of the collision shows the ring-like morphology similar to the gas ring observed in RCW 120, with dense cores for the expected star formation forming in the compressed shock at the edge of the ring.
Studies of cloud collision frequency by performing numerical simulation of a Milky Way-type disk show that multiple collisions can occur per one orbital period (Tasker & Tan, 2009; Tasker, 2011). Recent numerical studies report the similar collision frequency (Fujimoto, Tasker, Wakayama & Habe, 2014; Dobbs, Pringle & Duarte-Cabral, 2015). This rate agrees with the analytical estimation made by Tan (2000) who studied the rate of cloud collision that can explain the star formation rate in the galaxy, producing the empirical Kennicutt-Schmidt relation between gas surface density and star formation rate (Kennicutt, 1998). Since the observational studies and theoretical studies of cloud collision frequency support an idea of an important role of cloud-cloud collisions in the massive star formation, theoretical studies on the possible connection between cloud-cloud collisions and massive star formation are very interesting.
In paper I, we have studied cloud-cloud collisions of rather less massive clouds (417 and 1635 ) by using numerical simulations, assuming hydrodynamic, turbulent internal motions in the colliding clouds before their collisions. We have shown that many clumps are formed by shock compression induced by the cloud-cloud collision, and a dense and massive clump as high as 100 is finally formed for collision speeds, 3 km/s and 5 km/s. Mass growth of dense clumps is mainly mass accretion of surrounding gas on the clump. In higher collision speed case, 10 km/s, clouds are highly compressed by shock wave induced by the cloud-cloud collision, but the duration time of collision is not long enough for growing of the clump mass by the gas accretion and no massive, dense clump is formed. The numerical results of paper I indicate that we should simulate more large and massive clouds collision cases with higher collision speeds.
In this paper, we study a cloud-cloud collision of more massive clouds with larger collision speeds than paper I to examine formation of massive, dense clumps and to investigate the impact of collision speed on properties and evolution of these clumps. We assume that the initial mass of the clouds are . For more massive clouds than this mass range, the cloud shape should be far from spherical. We will study collisions of such massive clouds by using numerical simulation, by picking up them from the numerical results of galaxy scale simulations by Benincasa et al. (2013) and Fujimoto, Tasker, Wakayama & Habe (2014) in a forthcoming paper. In order to resolve internal turbulent motion of dense clumps formed by cloud-cloud collision, we improve our numerical resolution from 0.06 pc (paper I) to 0.014 pc (this paper). We concentrate on the study of mass function of dense gas clumps formed by the cloud-cloud collisions, since the core mass function is very important for study of the stellar initial mass function (e.g. Tan et al. (2014)). In §2 we describe our simulation method. In §3 we show our numerical results and we give discussions in §4 and summary in §5.
2 NUMERICAL METHOD
We use the same simulation method as in paper I. Since the detailed information of the simulation method is already described in paper I, we briefly summarize it. We used Enzo; a three-dimensional hydrodynamical adaptive mesh refinement code (Bryan et al., 2014; Bryan, 1999; Bryan & Norman, 1997). A simulation boxsize of 120 pc 120 pc 120 pc, a root grid size of 128 128 128 and an additional six levels of refinement were used, giving a limiting resolution (smallest cell size) of 0.014 pc. We used the refinement criteria based on gas mass and the resolution of the Jeans length, which must be refined by at least four cells as suggested by Truelove et al. (1997). By using this resolution, we can resolve internal motions in a dense core of which size is larger than 0.21 pc (Federrath et al., 2010).
The hydrodynamics were solved by using the Zeus method (Stone & Norman, 1992). In order to prevent gas undergoing unrefined self-gravitational collapse on the finest grid level, we impose a pressure floor as in paper I. Gas cools radiatively down to 10 K using a cooling table created by using the CLOUDY cooling code with the solar metallicity and a density of 100 cm-3 (Ferland et al., 1998; Smith et al., 2008). For the densities achieved in our simulation, the cooling function remains relatively constant, allowing us to use this simplification. Dense cores are identified in the simulation via a constant density contour-finding algorithm (Turk et al., 2011). In the finding algorithm, we use four density thresholds, and g cm-3 and compare the time evolutions of core number defined by these density thresholds. In order to analyze the evolution of the cores, we track their motion over the time of the simulation. This process is performed in a similar manner to the cloud tracking scheme presented in Tasker & Tan (2009) and paper I.
2.1 The initial condition
We assume initial clouds with higher masses and larger sizes than paper I. The density profile of each cloud is assumed to be a Bonner-Ebert sphere (Bonnor, 1956); a hydrostatic isothermal self-gravitating gas sphere confined by its external pressure. The maximum mass of the Bonner-Ebert sphere is given by:
| (1) | |||||
where is the isothermal sound speed, = 1.18 is a constant, is the external gas pressure, is the Boltzmann constant and is the gravitational constant. A cloud with less than is dynamically stable. The simulated clouds initially fulfill this stability requirement. Their properties are summarized in Table 2.1. Once cooling begins, the cloud becomes self-gravitationally unstable and, without additional support will start to collapse by the self-gravity of the cloud. Adding to the Bonner-Ebert profile clouds, we use the constant density clouds that have a higher gas density and mass than the Bonner-Ebert mass. The clouds are not in free-fall collapse due to additional support by internal turbulent motions. In Table 2.1, is temperature of the clouds and is the velocity dispersion corresponding to . Initial clouds’ radius and velocity dispersion are roughly consistent with the Larson relation (Larson, 1981; Heyer et al., 2009).
The internal turbulent motions in initial clouds are assumed to have the power spectrum , corresponding to the Larson relation (Larson, 1981). Since the focus of this paper is on the impact of the cloud collision, we selected turbulence modes that would initially stabilize the isolated clouds, preventing collapse prior to collisional contact from the gas cooling. We summarize range in Table 2.1. The amplitude of the turbulence is given by the Mach number, /, where is the velocity dispersion inside the cloud and is the sound speed. In the initial cloud, we assume that . As shown in paper I, we confirmed that clouds are stabilized more than their free fall time by the turbulent motions.
When the turbulence is applied, the clouds remain in their initial positions for 0.5 Myrs to reach the turbulent supported cloud state, as measured by the probability density distribution function (PDF) evolving to the expected lognormal profile for super-sonic isothermal turbulent gas (Vazquez-Semadeni, 1994; Scalo et al., 1998; Ostriker et al., 1999).
Initial cloud model parameters. Small Medium Large Constant () ( pc) 14.4 20.9 28.0 10.0 () 24.47 15.94 11.86 120.4 ( km/s) 2.62 3.17 3.57 3.01 (K) 480 720 960 700 ( Myr) 10.4 13.0 15.0 4.71 k-mode
PDFs of the Small, Medium and Large clouds with the turbulence are shown in Figure 1 and closely follow a lognormal distribution
| (2) |
where and the constants have values and 1.2, above a density of 10.0 cm-3 , as shown in paper I.
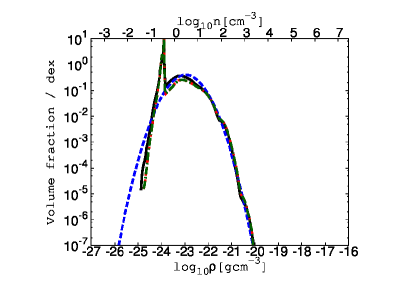
We note that spikes on PDF lines near g/cm3 correspond to gas near the cloud surfaces affected by the turbulent motions in the clouds. These spikes do not affect dense core formation, since the spikes correspond to rather low gas density regions. The collisions between these clouds in Table 2.1 were performed under a variety of (1) different collision speeds, (2) different combination of colliding cloud sizes, and (3) different cloud density profiles.
3 RESULTS
3.1 The effect of collision speeds
In this subsection, we show the simulation results of cloud-cloud collisions with the collision speeds, 5, 10, 20 and 30 km/s, for the same combination of clouds, Medium and Large clouds. These collision speeds are larger than paper I and are in the range of cloud collision velocities found in global numerical simulation of cloud formation in a barred galaxy (Fujimoto, Tasker, & Habe, 2014). We found formation of dense cores by cloud-cloud collisions in this speed range for more massive clouds than paper I.
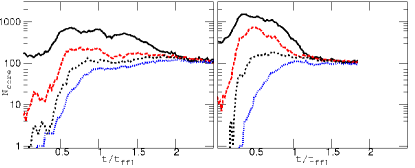
3.1.1 Core number evolution
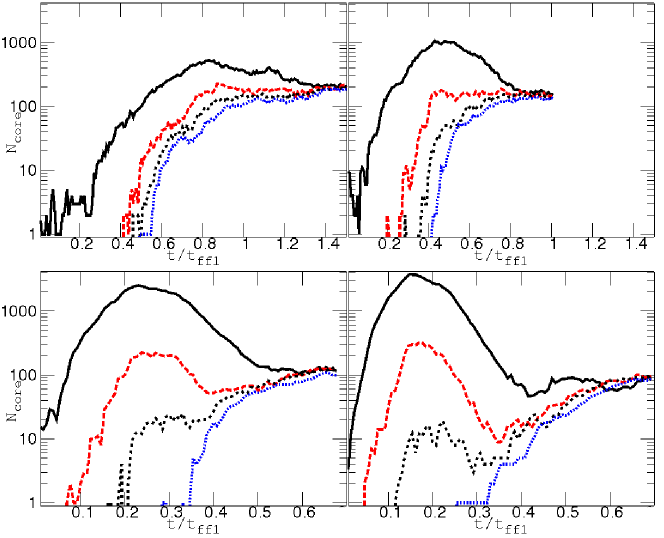
We show the time evolution of the core number as a fraction of the free-fall time of the Medium Cloud, in Figure 2 for the four collision speeds, 5, 10, 20 and 30 km/s. The initial time in the plots, , corresponds to the time when the clouds surfaces touch. In this figure, we show the core number evolutions for the four density thresholds, (black solid line), (red dashed line), (gray dot line) and g cm-3 (blue densely dotted line). We restrict the cores plotted to those containing more than 27 cells to ensure the best resolution.
Figure 2 shows that the core number for g cm-3 (black solid line) increases to its maximum, then decreases and finally attains a nearly steady-state. The time and value of the maximum core number depend on the collision speed, with the higher relative speed creating more numerous cores quickly. The decrease of core number after the peaks means that a large part of the cores selected by this density threshold is not tightly bound and hard to keep their structures in the later stage.
The early increase of the dense core number for g cm-3 is mainly caused by fragmentation of filamentary structures formed in the shocked cloud medium. The epoch of the first peaks of core number for this density threshold is roughly equal to the shock crossing time of the smaller (Medium) cloud, . After the shock crossing time, the shock compression becomes weaker due to decreasing of the velocity of the shocked medium and gravitationally unbound cores are destroyed by the internal irregular motions of the cores. This is the reason of the core number decreasing after the first peaks of the core numbers. We show an example of dense core formation by fragmentation in more denser filaments and core merging in middle and left panels of Figure 3.
The number of cores selected by more denser threshold, g cm-3 (blue densely dotted line), monotonically increases with time for km/s. This means that g cm-3 is large enough to select tightly, gravitationally bound cores in this collision speed range. The core numbers for the various core density thresholds converge in the later stage. This convergence means that surviving cores are very dense and compact. We call this stage the converging point.
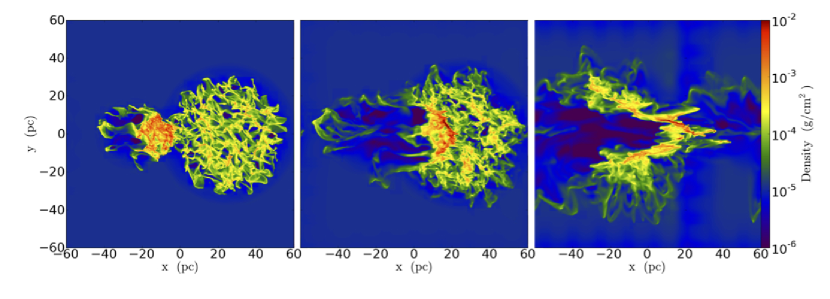
3.1.2 morphology of colliding clouds
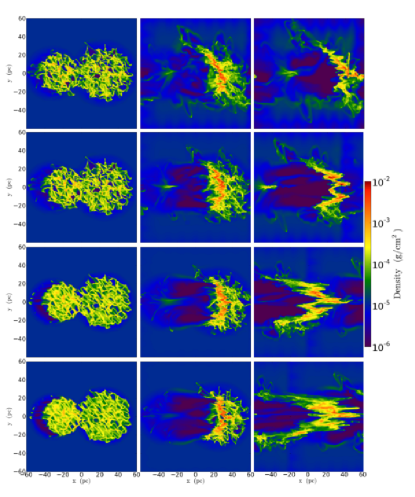
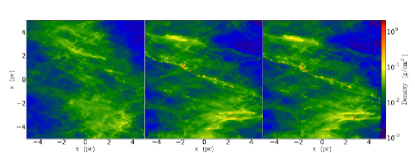
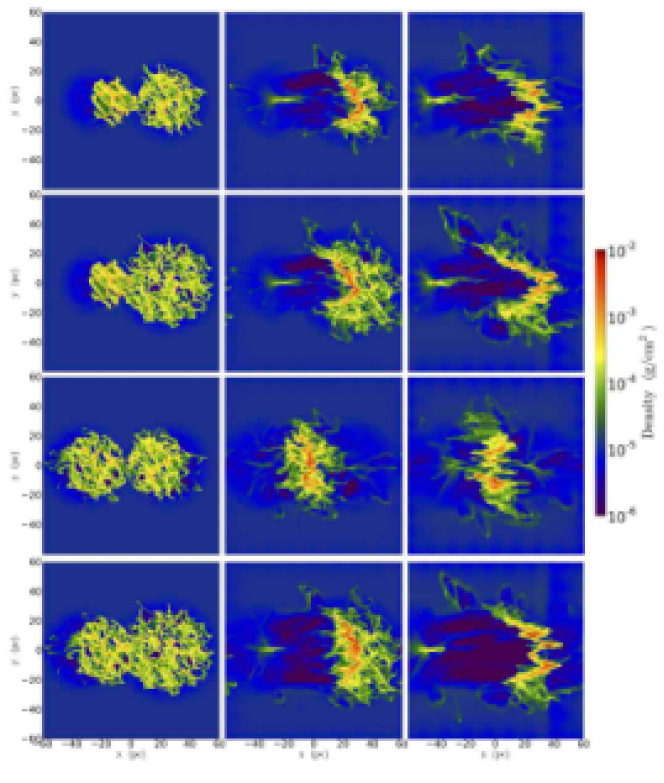
The time evolutions of these four simulations are shown in Figure 4. Each image shows slices of the Medium and Large clouds. Each vertical line of panels corresponds to the same event in each simulation: the left-hand panels show the first touching, the middle panels show the colliding clouds with the maximum number of cores. The final right-hand panels show the converging point, where we shift each -origin of the coordinate as, (5 km/s), +20 pc (10 km/s), +60 pc (20 km/s) and +80 pc (30 km/s).
In the middle panels, the Medium Clouds are compressed by shock waves and the partial arcs of dense gas are formed. These arcs have irregular ripple structures due to the Rayleigh-Taylor instability (Hester, Stone, & Scowen, 1996) and the thin shell shock instability (Vishniac, 1983; Ryu & Vishniac, 1987). Since the initial size of the Medium cloud is smaller than the size of Large cloud by only a factor 1.5, the arcs are rather widely open. As shown in subsection 3.2, the partial arcs are more close for collisions between the Small and Large clouds . At the converging points (the right panels) the elongated filament structures are formed and, in higher collision speed case, the filamentary structure appears more clearly and becomes oscillatory with a larger amplitude.
3.1.3 Probability distribution function
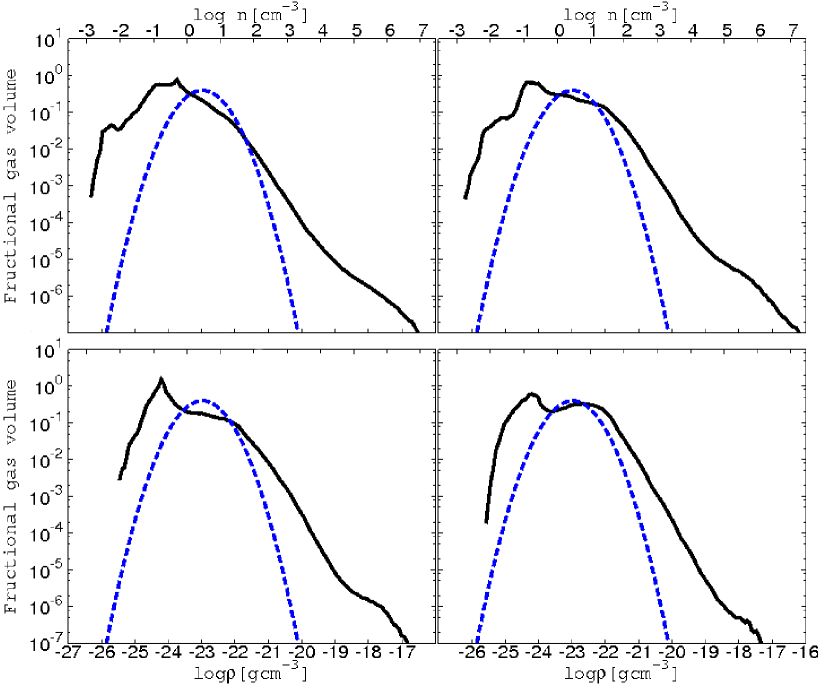
The probability distribution functions (PDF) is very useful to examine a turbulence property and self-gravitating structures of turbulent clouds (Federrath et al., 2010; Kritsuk et al., 2011). PDFs are shown for the four simulation results of the different collision velocities at the converging points in Figure 5. PDF is obtained for gas within a sphere of 30 pc radius centered on the Large Cloud. The blue dashed line in all panels is the log-normal profile shown in Figure 1. In Fig. 5,
the PDF tails extend from the log-normal to the higher gas density. The PDF tails consist of a power-law tail with a shallower extension. Power index of the power-law tail is approximately -1.5 that well agrees with the simulation results of a self-gravitationally collapsing, turbulent isothermal cloud (Kritsuk et al., 2011). Kritsuk et al. (2011) discuss that the index of the power-law tail can be explained by the self-gravitationally collapsing structures of isothermal gas. The power-law tail is evidence of self-gravitational collapse of dense gas in colliding clouds in our simulations. We note that the power-law tail agrees with the observations by Kainulainen et al. (2009), who show power-law tails in the PDFs of the column density in the giant molecular clouds with the star formation activity, while the giant molecular clouds with no star formation activity show the log-normal distribution.
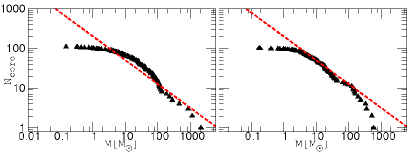
3.1.4 Cumulative core mass distribution
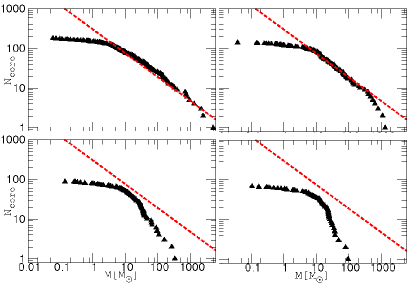
The core mass distribution at the converging point is shown by the cumulative core mass distribution (CMD) in Figure 6. The CMD is given by the core mass function, , as
| (3) |
We plot the red dashed line in Figure 6 to show a power-law relation which is given by
| (4) |
with = -1.6 and this relation fits the CMD for in the 5 km/s case. The power law fit with the same power index is applied to the CMDs in the smaller clouds collisions with the low collision speeds in paper I. It is very interesting that the power index agrees well with the observational results of Tatematsu et al. (1993), who show that molecular cores found in the Orion A molecular cloud can be fitted by a value of for . In the 5 km/s case, the CMD is nearly flat for . The nearly flat CMD means that almost all cores are limited in the mass range of . The flat part of the CMD shifts to more massive core mass with increasing the collision speed. For 10 km/s, another steeper power law part appears in in the CMD. We call the break point of the power law fit the bending point. The power index values of the steeper part increase with the collision speed as (20 km/s) and (30 km/s). The maximum mass of core and the total core number at the converging point decreases with increasing of the collision speed. This result can be understood by a core accretion growth argument as shown in the following.
Figure 7 shows the time evolution of three cores for 10 (top-row) and 20 km/s (bottom-row), plotted over the fraction of the Medium Cloud’s free-fall time. The black solid line marks the core mass. The blue dashed line shows the mass expected from the accretion rate defined as
| (5) |
where is
which includes the turbulent velocity dispersion of the internal gas motion, , and is the mean gas density in a sphere surrounding the core with radius, , given by the modified Bondi radius,
| (6) |
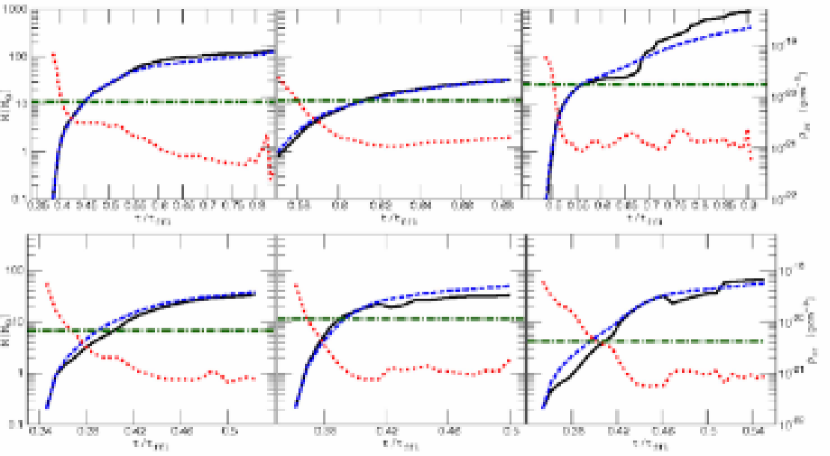
Note that we do not include the core mass and the others core mass within the modified Bondi radius in calculation and we add the core radius to the Bondi radius to ensure a reasonable sample of gas outside the core. Here, we call this accretion region the surrounding region. The red dotted line shows the mean gas density of the surrounding region. The green dot-dashed line shows the sum of mass of the surrounding region and the core mass when the core mass reaches the core’s effective Jeans mass,
| (7) |
where , , and are the averaged thermal sound speed, the mean turbulent gas velocity dispersion and the mean density of the core, respectively.
Figure 7 shows that the core mass (black solid line) is well fitted with the accretion mass (blue dashed line). This shows that these cores growth is predominantly by accretion. In the left and centre panels, after the core mass begins to increase, the surrounding gas density is rapidly decreasing after the core mass exceeds the green dot-dashed line. This suggests that the core mass grows rapidly until the core eats almost the all surrounding region mass and, during this stage, the surrounding gas density is decreasing. After the core eats almost the surrounding mass, the rate of core mass growth is decreasing and the slow growth of the core mass corresponds to the steeper part in the CMD plots. In the right panels, the growth of core mass is predominantly by accretion, but a jump seen after (10 km/s) and (20 km/s) indicates merger events after the surrounding density becomes low.
Based on the core mass evolution as shown in Figure 7, the single power law fit of the CMD means that the accretion growth of cores continues to the converging point in 5 km/s. Since density of the shock compression layer is low in 5 km/s, it takes long time to form the high density cores in the layer as shown in Fig. 2 and during core formation, the surrounding regions of cores also get gas. This means that the cores cannot consume all surrounding gas mass and the cores mass can grow continuously. Higher collision speed forms a denser layer. This process causes the rapid core formation and, due to short formation time, the surrounding regions cannot get gas enough to feed the cores continuously. This effect is more clearly in 20 and 30 km/s, there is no = -1.6 power-law slope as in Fig. 6. Note that, in these two cases, there are the mass excesses in the high mass range . These excesses are the results of the core merging events as shown in the right panel in Figure 7.
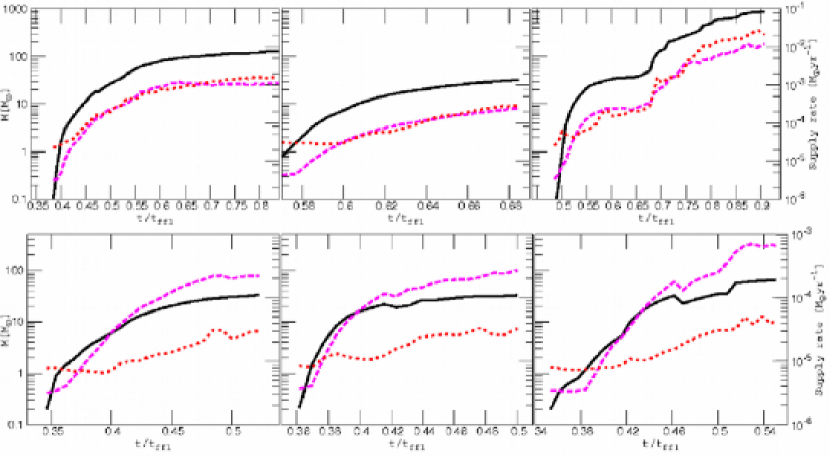
3.1.5 Mass supply rate inside the dense cores
The maximum mass of a star forming dense core will be limited by the radiation pressure from a protostar (McKee & Tan, 2002). McKee & Tan (2002) showed that the high accretion rate, /yr, can overcome the radiation pressure in the massive star formation of . Figure 8 shows time evolution of the core mass and the mass supply rate in the dense cores shown in Fig.7, where the mass supply rate is the rate of gas accretion to a protostar in a collapsing core and may be given by , where is mass of the dense core and is the free fall time of the dense core. We use half of the core’s mass or the effective Jeans mass, whichever is larger, for ,
| (8) |
We also show the effective Jeans mass in Figure 8. The core mass reaches the effective Jeans mass at approximately . If stars form at this point, stars will be formed, since the typical free fall time is 2.5 yr for g cm -3. However, if the cores are prevented from collapsing (for instance, by magnetic fields, turbulence or core rotation unresolved in our simulation) then the core mass may increase as shown in Figure 8 and their mass supply rate will be larger than yr-1. In this situation, the cores will collapse to form massive stars.
3.2 The effect of the cloud size
To explore the effect of sizes of colliding clouds on properties of the formed cores, we compare the numerical results of the four combinations, Small-Medium, Small-Large, Medium-Medium and Medium-Large clouds for the same collision speed, 10 km/s.
The evolution of these four simulations is shown in Figure 9. For the Small-Large clouds case, the arc-like structure is more clearly formed than the Medium-Large clouds case. We analyze the core number evolution, PDF and CMD as shown in Figures 10, 11, and 12.
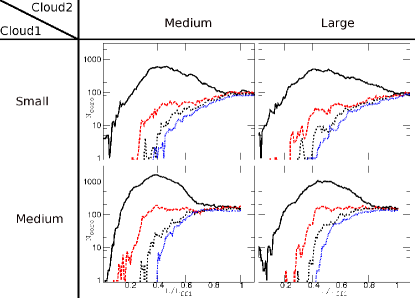
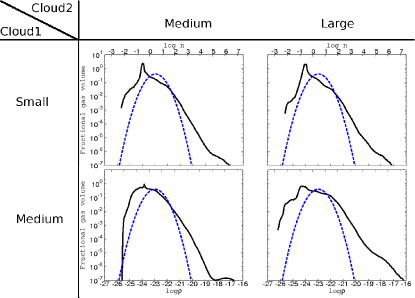
The evolution of the core number shown in Figure 10 show that the maximum core number, the core number at the converge point and the epoch of the converging point, strongly depend on smaller clouds. The PDFs shown in Figure 11 show the power-law tail in the denser gas than g/cm-3. In the Medium-Medium clouds, extension of the power-law tail is smaller than the other case. In this case, the shocked layer shows no arc-like structure at the converging point as shown in Fig. 9. This may be the reason of the small extension of the power-law tail in the Medium-Medium clouds, since the arc structures formed in the non-identical clouds help the core mass increase.
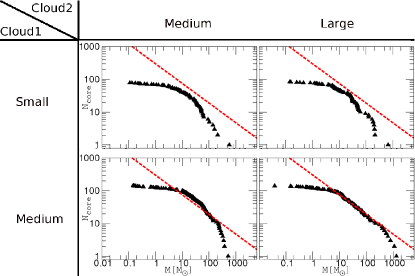
In Figure 12, we show the CMDs and the power-law fit of = -1.6 with the red dashed line. Same as the core number evolution, each CMD shape mainly depends on the smaller cloud property. For the Small cloud, the massive part of the CMDs can be fitted by the power-law of = -2. This means that gas accretion does not continue long enough for the core mass growth in the Small cloud case with the collision speed of 10 km/s .
3.3 The effect of initial density distribution - a compact cloud with constant density
To explore the effect of the initial cloud structure, we simulate the collision of a compact cloud with an initial constant density (Constant cloud) and the Large cloud. In Table 1 we show parameters of the Constant cloud. We assume the initial temperature for the Constant cloud to be in the virial equilibrium by its thermal energy. We also add turbulent motion of Mach number at . The turbulent motion can support the Constant cloud for more than 0.5 Myr. Same as the previous simulation, we give the collision speed to the Constant cloud at 0.5 Myr. The evolution of this simulation is shown in Figure 13. The evolution of the core number plotted as a fraction of the Constant cloud’s free-fall time, , is shown in Figure 14 for collisional speed, 10 km/s (left) and 20 km/s (right). In each plot lines show core numbers defined by the four threshold density values as in Figure 2. As in the Bonnor-Ebert cloud case, the time for the maximum number of cores depends on collision speed, with high relative speed creating cores more rapidly.
The cumulative core mass distributions are shown in Fig. 15. We also plot a line of the power index . The bending point appears at in 20 km/s. The mass of the bending point is much larger than the Medium-Large case for 20 km/s in which the bending point is at . This may be due to the fact that since the surrounding mass of cores in the Constant cloud case is much larger than the Medium cloud, the gas accretion to the core can continue and increase the core mass more than in the Medium cloud case. The power index of the cumulative core mass distribution in the range more than the bending point is .
4 DISCUSSION
Mass fraction of the formed massive dense cores to total mass of the colliding clouds is very interesting for discussion of a possible role of cloud-cloud collisions in massive star formation in our Galaxy. Since the number of dense cores for g/cm3 is almost constant for more than 1 Myr after the converging point, such massive dense cores have enough time for the massive star formation as discussed in section 3.1.5. We summarize the total mass of massive dense cores, , and a mass fraction of to the total mass of colliding clouds in Table 4, where is the total mass of massive dense cores more than 10 and is the total mass of the colliding clouds. is 0.046 - 0.288 for the collision speeds, 10 30 km/s, that are in the speed range of the observed colliding clouds (Torii et al., 2015). In numerical simulation of cloud formation and evolution in a weak barred galaxy by Fujimoto, Tasker, & Habe (2014), they showed that the collision events of 5 km/s is much smaller than that of 10 30 km/s. The low speed collisions with 5 km/s should have a minor role for the star formation than the 10 30 km/s collisions.
We discuss the role of cloud-cloud collisions in the star formation in the Galaxy by using our numerical results and the formula of Tan (2000) who estimated the star formation rate by cloud-cloud collisions as
where is the fraction of gravitational unstable mass produced by a cloud-cloud collision, is the mass fraction of newly formed stars to the gravitational unstable mass, is the cloud number, is the typical cloud mass and is the mean cloud collision time scale. Tan (2000) showed that star formation rate in our Galaxy can be explained for and . The value of is comparable to our numerical results of the mass fraction of total core mass for the collision speeds, 10 30 km/s. The typical collision time scale obtained by Fujimoto, Tasker, & Habe (2014) is comparable to the value adopted by Tan (2000). If these results can be used in the formula, our simulation results indicate that cloud-cloud collisions well contribute to the massive star formation in the Galaxy, although mass of colliding clouds in our simulation is smaller than the typical mass of molecular clouds adopted in Tan (2000).
The mass fraction of massive dense cores to the total mass of colliding clouds decreases with collision speeds as shown Table 4. This result indicates that in very high speed collision environments efficiency of massive dense core formation becomes smaller than lower speed collision environments. Fujimoto, Tasker, & Habe (2014) has shown that large part of colliding clouds in the bar region in the barred galaxy have high cloud collision speeds of much more than 30 km/s by their simulation. With this result, the low star formation efficiency observed in the bar regions (Momose et al., 2010; Hirota et al., 2014) is possible to be explained by the low core formation efficiency by the high velocity cloud-cloud collisions in the bar region.
For more detailed discussion of the role of cloud-cloud collision in star formation in the Galaxy, we should extend cloud-cloud collision simulations to more general cases, e.g. off-center cloud-cloud collisions, more general shape of colliding clouds, and more massive clouds. We should consider magnetic field effect and feedback effects by newly formed massive stars. These can affect the core formation and evolution during the cloud-cloud collision. In an off-center collision, a large shear flow will dominate in the interface layer of colliding clouds than the face-on collision cases and will affect the core formation and evolution in the interface layer. Massive clouds have internal substructures and their shapes are far from a spherical shape. Although MHD simulations are already made by Wu et al. (2017a), and Wu et al. (2017b) and radiative feedback effects are simulated by Shima et al. (2017), more extensive studies are needed for the detailed study of the role of cloud-cloud collision in star formation in the Galaxy. Massive star formation process in dense cores formed in our simulation is beyond our numerical simulation ability in this paper. Inoue & Fukui (2013) have shown that dense cores formed in magnetohydrodynamic colliding flows have strong internal turbulent motions and strong magnetic fields. Both can lead to high accretion rate in the cores that favors to high mass star formation, since protostars can grow via accretion against the radiation pressure barrier to massive stars.
We obtain the CMDs from our numerical results. The CMDs can be fitted by the power law with the index in the low collision speed and the steeper power law part appears with the bending points in the higher collision speed for the same combination of colliding clouds as shown in section 3.1.4. The presence of the bending points of the CMDs depends on the collision speeds and the smaller cloud property. We suggest that the steeper power law parts with bending points in the observed CMDs are the evidence of cloud-cloud collisions. The steeper power law fit with the bending point is reported in the CMD in the observed candidate of the cloud-cloud collision region in the Galactic center 50 km/s molecular cloud (Tsuboi et al., 2015). Their result support our suggestion.
Total mass of dense cores, Cloud1- Cloud2 S-M 10 6364 0.288 S-L 10 5204 0.166 S-L 20 3649 0.11 M-M 10 10667 0.36 M-L 5 19010 0.464 M-L 10 11705 0.288 M-L 20 3035 0.076 M-L 30 1825 0.046 Const-L 10 9344 0.201 Const-L 20 4360 0.097 {tabnote} is total mass of Cloud1 and Cloud2. g cm-3 at the converging point
5 SUMMARY
We have explored the formation and evolution of dense gas cores in collisions of non-identical clouds with the Bonner-Ebert density profiles and the constant density profile using hydrodynamical simulations. Mass range of clouds is 0.76 - 2.67 that is larger than paper I. The limiting resolution was 0.014 pc that is small enough to resolve formation of molecular cores. We have shown the effect of collision speeds, cloud sizes and initial density distributions of clouds on the core formation and evolution. Our numerical results show that the smaller cloud property is important for the core formation and evolution. Collision speeds are also important for the early formation of dense cores and the late mass evolution of massive dense cores. As a result of core evolution, the shape of core mass function changes with the cloud collision speeds for the same combination of colliding clouds.
Collision between two clouds produces a shocked gas layer that contains dense gas filaments, since the pre-collision clouds have filamentary structures produced by the internal turbulent motions. Many dense cores are formed by fragmentation of the dense gas filaments. Due to the size difference between the two clouds, the shocked gas region becomes oblique as the clouds merge and forms a partial arc-like structure that is commonly observed in observations of candidates of cloud-cloud collision events (Torii et al., 2015; Fukui et al., 2016; Torii et al., 2017).
The CMDs of cores formed by cloud-cloud collisions show that most of the dense cores have mass more than two or three solar mass for the collision speeds more than km/s in our simulation results. The CMDs are well approximated by the power law for the high mass cores. For higher collision speeds, the CMDs can be described by the two power law fits with the bending point that is the break point of the two power law fits of the CMDs. The bending point shifts to the lower mass with the higher collision speed because the surrounding gas mass rapidly decreases in the higher collision speed case. The bending point also depends on the smaller cloud property. In the smaller cloud with lower mass, the bending point will appear in more earlier stage of cloud cloud collision than the more massive smaller cloud case. The bending points in the CMDs can be evidence of cloud-cloud collisions with higher collision speeds. The power law index of CMDs is similar to the stellar initial mass function (Salpeter 1955; Chabrier 2003).
ACKNOWLEDGMENTS
The authors thank Yasuo Fukui, Takashi Okamoto, Kazuo Sorai, Kazufumi Torii and Tsuyoshi Inoue for their fruitful discussions. The authors also thank an anonymous referee for constructive comments. Thanks to the yt development team (Turk et al., 2011) for support during the analysis of these simulations. Numerical computations were carried out on the Cray XT4 and Cray XC30 at the Center for Computational Astrophysics (CfCA) of the National Astronomical Observatory of Japan. EJT is funded by the MEXT grant for the Tenure Track System. EJT and AH are supported by the Japanese Promotion of Science Society KAKENHI Grant Number 15K05014.
References
- Alves et al. (2001) Alves J. F., Lada C. J., Lada E. A. 2001, Nature, 409, 159
- Anathpindika (2010) Anathpindika S. 2010, MNRAS, 405, 1431A
- Benincasa et al. (2013) Benincasa S. M., Tasker E. J., Pudritz R. E., Wadsley J., 2013, ApJ, 776, 23
- Bisbas et al. (2017) Bisbas, T. G., Tanaka, K. E. I., Tan, J. C.,Wu, B. & Nakamura, F., 2017, ApJ, 850, 23
- Bolatto et al. (2008) Bolatto, A. D., Leroy, A. K., Rosolowsky, E., Walter, F., & Blitz, L. 2008, ApJ, 686, 948
- Bondi (1951) Bondi H. 1951, MNRAS, 112, 195B
- Bonnor (1956) Bonnor, W.B. 1956, MNRAS, 116, 351B
- Bryan (1999) Bryan, G. L. 1999, Comput. Phys. Eng., 1, 46
- Bryan & Norman (1997) Bryan, G. L. & Norman, M. L. 1997, Computational Astrophysics, 12th Kingston Meeting on Theoretical Astrophysics (ASP Conf. Ser. 123), ed. D. A. Clark & M. J. West (San Francisco, CA: ASP), 363
- Bryan et al. (2014) Bryan, G. L. et al. 2014, ApJS, 211, 19
- Chabrier (2003) Chabrier, Gilles, PASP, 115, 763
- Dobbs, Pringle & Duarte-Cabral (2015) Dobbs, C. L., Pringle, J. E. & Duarte-Cabral, A. 2015 MNRAS, 446, 3608 The frequency and nature of ‘cloud-cloud collisions’ in galaxies
- Federrath et al. (2010) Federrath. C., Roman-Duval. J., Klessen. R. S., Schmidt W., & Mac Low. M.-M. 2010, A&A, 512, A81
- Ferland et al. (1998) Ferland G. J., Korista K. T., Verner D. A., et al. 1998, PASP, 110, 761
- Fukui et al. (2014) Fukui, Y.; Ohama, A.; Hanaoka, N.; Furukawa, N.; Torii, K.; Dawson, J. R.; Mizuno, N.; Hasegawa, K.; Fukuda, T.; Soga, S.; and 10 coauthors 2014, ApJ, 780, 36
- Fukui et al. (2016) Fukui, Y.; Torii, K.; Ohama, A.; Hasegawa, K.; Hattori, Y.; Sano, H.; Ohashi, S.; Fujii, K.; Kuwahara, S.; Mizuno, N.; and 6 coauthors 2016, ApJ, 820, 26
- Fujimoto, Tasker, Wakayama & Habe (2014) Fujimoto, Yusuke; Tasker, Elizabeth J.; Wakayama, Mariko; Habe, Asao 2014 MNRAS, 439, 936
- Fujimoto, Tasker, & Habe (2014) Fujimoto, Yusuke; Tasker, Elizabeth J.; Habe, Asao 2014, MNRAS, 445, L65
- Furukawa et al. (2009) Furukawa, N., Dawson, J. R., Ohama, A., et al. 2009, ApJ, 696, L115
- Ginsburg et al. (2012) Ginsburg, A., Bressert, E., Bally, J., & Battersby, C. 2012, ApJ, 758, L29
- Habe & Ohta (1992) Habe A., Ohta K. 1992, PASJ, 44, 203 H 1.000 07/1994 A F G R C S U
- Haworth et al. (2015) Haworth, T. J., Tasker, E. J., Fukui, Y., Torii, K., Dale, J. E., Shima, K., Takahira, K., Habe, A. & Hasegawa, K. 2015, MNRAS, 450, 10
- Hester, Stone, & Scowen (1996) Hester, J. J., Stone, J. M., & Scowen, P. A. et al. 1996, ApJ, 456, 225
- Heyer et al. (2009) Heyer, M., Krawczyk, C., Duval, J., & Jackson, J. M. 2009, ApJ, 699, 1092
- Higuchi et al. (2014) Higuchi, A. E., Chibueze, J. O., Habe, A., Takahira, K., & Takano, S. 2014, AJ, 147, 141
- Hirota et al. (2014) Hirota, A.; Kuno, N.; Baba, J.; Egusa, F.; Habe, A.; Muraoka, K.; Tanaka, A.; Nakanishi, H.; Kawabe, R., 2014, PASJ, 66, 46
- Inoue & Fukui (2013) Inoue, T.; Fukui, Y., 2013, ApJ, 774, L31
- Kainulainen et al. (2009) Kainulainen. J., Beuther. H., Henning. T., & Plume. R. 2009, A&A, 508, L35
- Kennicutt (1998) Kennicutt, R. C., Jr. 1998, ApJ, 498, 541
- Klessen et al. (1998) Klessen, R. S., Burkert, A., & Bate, M. R. 1998, ApJ, 501, L205
- Kritsuk et al. (2011) Kritsuk, A. G., Norman, M. L., & Wagner, R. 2011, ApJ, 727, L20
- Kroupa (2001) Kroupa, P. 2001, MNRAS, 322, 231
- Lada, Lombaridi & Alves (2010) Lada C. J., Lombaridi M. & Alves J. F. 2010, ApJ, 724, 687
- Larson (1981) Larson, R.B. 1981, MNRAS, 194, 809
- McKee & Tan (2002) McKee, C. F., & Tan, J. C. 2002, Nature, 416, 59
- Momose et al. (2010) Momose, R.; Okumura, S. K.; Koda, J.; Sawada, T., 2010, ApJ, 721, 383
- Ohama et al. (2010) Ohama, A., Dawson, J. R., Furukawa, N., et al. 2010, ApJ, 709, 975
- Ostriker et al. (1999) Ostriker, E. C., Gammie, C. F., & Stone, J. M. 1999, ApJ, 513, 259
- Ryu & Vishniac (1987) Ryu, D. & Vishniac, E. T. 1987, ApJ, 313, 820
- Salpeter (1955) Salpeter, E. E. 1955, ApJ, 121, 161
- Scalo et al. (1998) Scalo, J., Vazquez-Semadeni, E., Chappell, D., & Passot, T. 1998, ApJ, 504, 835
- Shima et al. (2017) Shima, K., Tasker, E. J., Habe, A., 2017, MNRAS, 467, 512
- Smith et al. (2008) Smith B., Sigurdsson S., Abel T., 2008, MNRAS, 385, 1443
- Stone & Norman (1992) Stone, J. M. & Norman, M. L. 1992, ApJS, 80, 753
- Takahira, Tasker & Habe (2014) Takahira, K.,Tasker, E. J., & Habe, A. 2014, ApJ, 792, 63
- Tan (2000) Tan, J. C. 2000, ApJ, 536, 173
- Tan et al. (2014) Tan, J. C., Beltrán, M. T., Caselli, P., Fontani, F., Fuente, A., Krumholz, M. R., McKee, C. F., Stolte, A. 2014, Protostars and Planets VI, ed. Henrik Beuther, Ralf S. Klessen, Cornelis P. Dullemond, and Thomas Henning (University of Arizona Press, Tucson), p.149-172
- Tasker (2011) Tasker, E. J. 2011, ApJ, 730, 11
- Tasker & Tan (2009) Tasker, E. J., & Tan, J. C. 2009, ApJ, 700, 358
- Tatematsu et al. (1993) Tatematsu, K., Umemoto, T., Kameya, O., et al. 1993, ApJ, 404, 643
- Torii et al. (2011) Torii, K. Torii, K.; Enokiya, R.; Sano, H.; Yoshiike, S.; Hanaoka, N.; and 14 coauthors, 2011, ApJ, 738, 46
- Torii et al. (2015) Torii, K. Torii, K.; Hasegawa, K.; Hattori, Y.; Sano, H.; Ohama, A.; and 9 coauthors, 2015, ApJ, 806, 7
- Torii et al. (2017) Torii, K.; Hattori, Y.; Hasegawa, K.; Ohama, A.; Haworth, T. J.; Shima, K.; Habe, A.; and 5 coauthors 2017, ApJ, 835, 142
- Tsuboi et al. (2015) Tsuboi, M., Miyazaki, A., & Uehara. K, 2015, PASJ, 67, 109
- Turk et al. (2011) Turk, M. J., Smith, B. D., Oishi, J. S., Skory, F., Skillman, S. W., Abel, T., & Norman, M. L. 2011, ApJS, 192, 9
-
Truelove et al. (1997)
Truelove, J. K., Klein, R. I., McKee, C. F., Holliman, J. H., Howell, L. H., & Greenough, J. A.
1997, ApJ, 489, L179 - Vazquez-Semadeni (1994) Vazquez-Semadeni, E. 1994, ApJ, 423, 681
- Vishniac (1983) Vishniac, E. T. 1983, ApJ, 274, 152
- Wu et al. (2017a) Wu, B., Tan, J. C., Nakamura, F., Van Loo, S., Christie, D., & Collins, D., 2017, ApJ, 811, 137
- Wu et al. (2017b) Wu, B.; Tan, J. C.; Christie, Duncan; Nakamura, F.; Van Loo, S.; & Collins, D., 2017, ApJ,841, 88