A Millennium-Long Evolution of One-Year-Recurrence-Period Nova – Search for Any Indication of the Forthcoming He Flash
Abstract
We present 1500 cycles of hydrogen shell flashes on a white dwarf (WD) for a mass accretion rate of yr-1, the mass ejection of which is calculated consistently with the optically thick winds. This model mimics the one-year-recurrence-period nova M31N 2008-12a. Through these hydrogen flashes a helium ash layer grows in mass and eventually triggers a helium nova outburst. Each hydrogen flash is almost identical and there is no precursor for the forthcoming He flash either in the outburst or in the quiescent until the next He flash suddenly occurs. Thus, M31N 2008-12a is a promising candidate of He novae, outbursting in any time within a millennium years. The prompt X-ray flash of He nova lasts as short as 15 min with the X-ray luminosity being about a half of the Eddington luminosity, making the observation difficult. In the very early phase of a He flash, the uppermost H-rich layer is convectively mixed into the deep interior and most of hydrogen is consumed by nuclear burning. In comparison with hydrogen shell flashes of M31N 2008-12a, we expect the forthcoming He nova with a very short prompt X-ray flash (15 min), a very bright optical/NIR peak ( mag brighter than M31N 2008-12a), a much longer nova duration ( years), and a longer supersoft X-ray source phase (40-50 days or more).
Subject headings:
nova, cataclysmic variables – stars: individual (M31N 2008-12a) – white dwarfs – X-rays: binaries1. Introduction
A nova is a hydrogen flash on a mass-accreting white dwarf (WD) (Nariai et al., 1980; Iben, 1982; Prialnik, 1986; Sion et al., 1979; Sparks et al., 1978). Multicycle nova outbursts have been calculated with Henyey-type evolution codes. Those codes, however, meet numerical difficulties when the nova envelope expands to a giant size. To continue the numerical calculation beyond this stage, various authors have adopted various mass-loss schemes and approximations (Prialnik & Kovetz, 1995; Kovetz, 1998; Denissenkov et al., 2013; Idan et al., 2013; Wolf et al., 2013a, b; Kato et al., 2014, 2015; Tang et al., 2014). In the previous paper (Kato et al., 2017), we established an iteration method for calculating the extended stage of novae with time-dependent mass-loss rates of optically thick winds, and presented a model for one full cycle of a nova outburst for the recurrent nova M31N 2008-12a.
M31N 2008-12a has exploded almost every year which makes this object as the shortest record of the recurrence period of yr (Darnley et al., 2014, 2015, 2016; Henze et al., 2014, 2015a; Tang et al., 2014; Darnley et al., 2016) or yr.111Henze et al. (2015b) proposed a 0.5 yr recurrence period to explain the discrepancy between the early (around 2000) and recent trends of the outburst cycles. Even if an outburst occurred in the middle of the 1 yr cycle, we could not observe it due to Sun constraint. Kato et al. (2015, 2017) presented the outburst model of a WD with a mass-accretion rate of yr-1. During the outburst of the model, a part of the envelope mass is blown in the optically thick wind, and the rest is processed to helium and accumulates on the WD. Thus, we expect that, after many flashes, the helium mass gradually increases and eventually reaches a critical value for ignition, leading to a He flash. In other words, M31N 2008-12a is a promising candidate of He novae.
Helium novae were theoretically predicted by Kato et al. (1989) as a
nova explosion caused by a helium shell flash on a WD.
Binary systems of He nova progenitors were categorized into three types
(Kato et al., 1989, 2008).
(1) WDs accreting helium matter from a helium star companion.
(2) WDs accreting hydrogen with rates high enough to keep steady
hydrogen burning, i.e., the accretion rate is higher than the stability line
(Kato et al., 2014).
Such objects correspond to persistent supersoft X-ray sources.
(3) WDs accreting hydrogen with rates lower than the stability line,
but high enough to increase the helium layer mass.
Such objects correspond to recurrent novae.
Kato et al.’s (1989) prediction was realized as a type (1) when V445 Pup was discovered on UT 2000 December 30 by K. Kanatsu (Kato & Kanatsu, 2000). V445 Pup is the first and only identified helium nova that underwent a helium shell flash (Kamath & Anupama, 2002; Kato & Hachisu, 2003; Ashok & Banerjee, 2003; Iijima & Nakanishi, 2007; Kato et al., 2008; Woudt et al., 2009). The other two types of helium nova systems were not detected yet. As mentioned above, the recurrent nova M31N 2008-12a is a promising candidate of type (3) He novae. As M31N 2008-12a is the shortest recurrence period nova, we expect that the He layer is now growing in mass at high rates that result in He ignition in the near future. Thus, the theoretical description for He nova outbursts could be useful for making observational plans.
A successive shell flash calculation is not easy, because we need substantial computer resources. Only few groups have ever presented such calculations. Epelstain et al. (2007) calculated successive cycles of nova outbursts on a WD for the mass-accretion rate of yr-1 and on a WD for yr-1. In these models, the WDs are eroded in every outburst and the WD masses secularly decrease. As the He ash is lost, no He flashes occur.
Idan et al. (2013) calculated a few thousand successive hydrogen flashes for 1.0, 1.25, 1.35, and 1.4 WDs with yr-1, and showed that the He layers grow in mass to result in He flashes. This accretion rate is much higher than that of the stability line, i.e., hydrogen should steadily burn without flashes, unless the accretion is stopped and restarted artificially. We call such novae “the forced novae” (see Kato et al., 2014; Hachisu et al., 2016). This accretion rate is too high to be applicable to M31N 2008-12a.
Hillman et al. (2016) also presented successive hydrogen flashes starting from a hot WD with yr-1, which result in a He flash after 2573 cycles of hydrogen flashes. The recurrence period of the H flashes is about 2 years, close to 1 yr of M31N 2008-12a. These authors, however, paid little attention to describing the flash properties in detail. Moreover, the adopted parameters are not appropriate for M31N 2008-12a, which makes difficult drawing practical information for observation.
The aim of this work is to calculate a number of hydrogen flashes until a He flash occurs for the appropriate parameters of M31N 2008-12a. This paper is organized as follows. Section 2 introduces our numerical method and various parameters for the model. Section 3 describes physical properties in our thousands of nova outbursts. Section 4 shows the physical properties of the early phase of helium burning. Discussion and conclusions follow in Sections 5 and 6.
| Subject | units | quantity |
|---|---|---|
| 1.380 | ||
| 2.00 | ||
| cm s-2 | 9.72 | |
| cm s-1 | 9.15 | |
| K | 8.03 | |
| yr-1 | 1.6 | |
| 6.47 | ||
| 4.08 | ||
| 4.05 | ||
| K | 6.05 | |
2. Numerical Method
We have calculated 1500 consecutive nova outbursts leading to a helium flash. We adopt the WD mass of and the mass-accretion rate of yr-1, taken from the model for the one-year-recurrence-period nova M31N 2008-12a (Kato et al., 2016). We use the same Henyey-type code as in the previous work (Kato et al., 2016, 2017). The chemical compositions of the accreting matter and initial hydrogen-rich envelope of the WD are assumed to be , and . To save computer time, we use a small nuclear reaction network up to magnesium. Convective mixing is treated diffusively adopting the effective diffusion coefficient derived by Spruit (1992). Although the coefficient was derived for semiconvective mixing (corresponding to the Schwarzschild type), it leads to a uniform chemical composition distribution in the fully convective zone. Therefore, we use the coefficient whenever radiative temperature gradient exceeds adiabatic temperature gradient (Schwarzschild-Kato criterion, Kato, 1966, for the occurrence of convection). Neither convective overshooting nor diffusion processes of nuclei are included. We neglect the effects of rotation for simplicity. Including rotation into the evolution code is difficult and beyond the scope of the present work. Also, accretion energy outside the photosphere is not included. For technical simplicity, we assume that gas is accreted with the same temperature as the stellar surface. These assumptions are discussed in Section 5.2.
It should be noted that the quiescent luminosity, , which appears in Figures 2, 3, 4, and 6, cannot be directly compared with observation because it does not include the accretion energy outside the photosphere that is reprocessed with the accretion disk surface (e.g., Hachisu et al., 2000; Hachisu & Kato, 2001, 2006).
During the extended stages of nova outbursts, the optically-thick wind mass-loss occurs. Kato et al. (2017) presented two series of time-dependent wind mass-loss rates for a nova outburst model of M31N 2008-12a. To avoid time consuming process of iterative numerical fitting with optically thick wind solutions in each stage, we here simply assumed wind mass-loss rates in our Henyey-code calculation and followed a few thousand flashes. The adopted mass-loss rates (the dotted green line in Figure 11 in Kato et al., 2017) reasonably mimic those of the optically thick winds, but are slightly overestimated.
We adopt mass zones to cover the entire configuration including a carbon-oxygen (CO) WD core, a He layer, and a H-rich envelope. Such a large number of (i.e., very fine) mass zones are necessary to guarantee numerical accuracy especially in rapidly changing physical variables, such as the temperature, density, and chemical composition of nuclear burning region and also expanding region. Rezoning is adopted when it is necessary in a way to conserve mass, energy, and chemical composition. The time step is chosen to be short enough ( seconds) in calculation of the 1500 cycles of hydrogen shell flashes, but much shorter (1 second) for the He ignition. It took about a week of CPU time on a PC (Xeon E5-1660, 3.70 GHz) for entire sequence of 1500 hydrogen shell flashes followed by the He flash until we stop calculation.
We adopted an initial WD model in which an energy balance is already established between heating (by the mass accretion and nuclear energy generation) and cooling (by the radiative transfer and neutrino energy loss) (Kato et al., 2014). This is a good approximation of the long time-averaged evolution of a mass accreting WD. Starting from such an equilibrium state, the nova cycle approaches a limit cycle (Kato et al., 2014) in a short time. We will discuss in more detail on the initial model in Section 5.1. Parameters of our initial WD model is summarized in Table 1.
3. 1500 Hydrogen Flashes
3.1. Nearly Identical Flashes with No Indication of Forthcoming Helium Flash
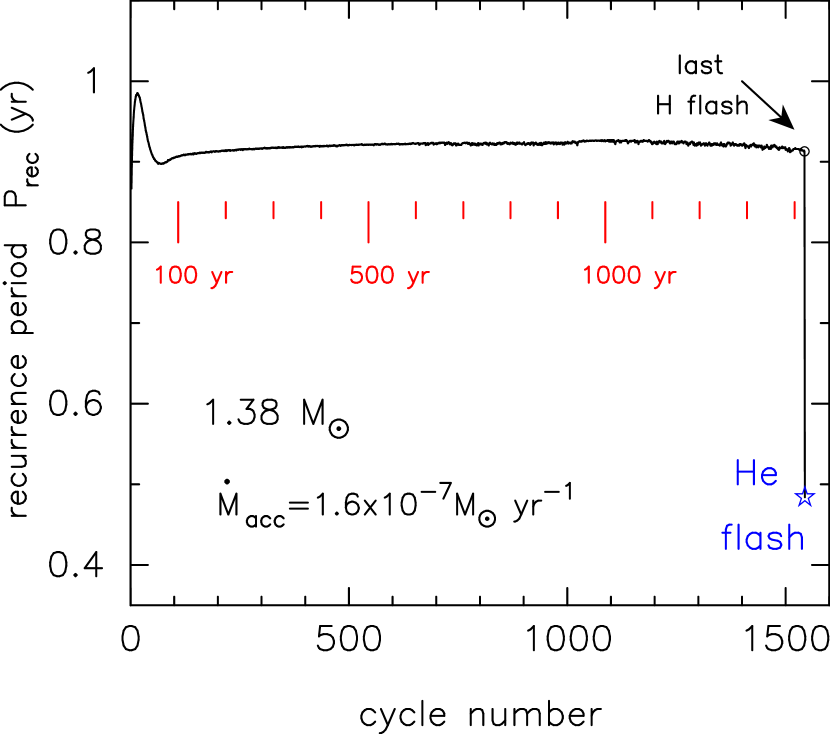
Figure 1 shows the change of the recurrence period, , throughout our calculation. After 1543 hydrogen flashes, a He flash occurs passing half a period from the last H flash (open blue star). The recurrence period increases by just after the start of calculation and then decreases during the first 70 cycles. After that, it stays at yr. This early period change is caused by our choice of the initial WD model which is slightly different from the thermal equilibrium structure (see Section 5.1 for the effects owing to the choice of initial models).
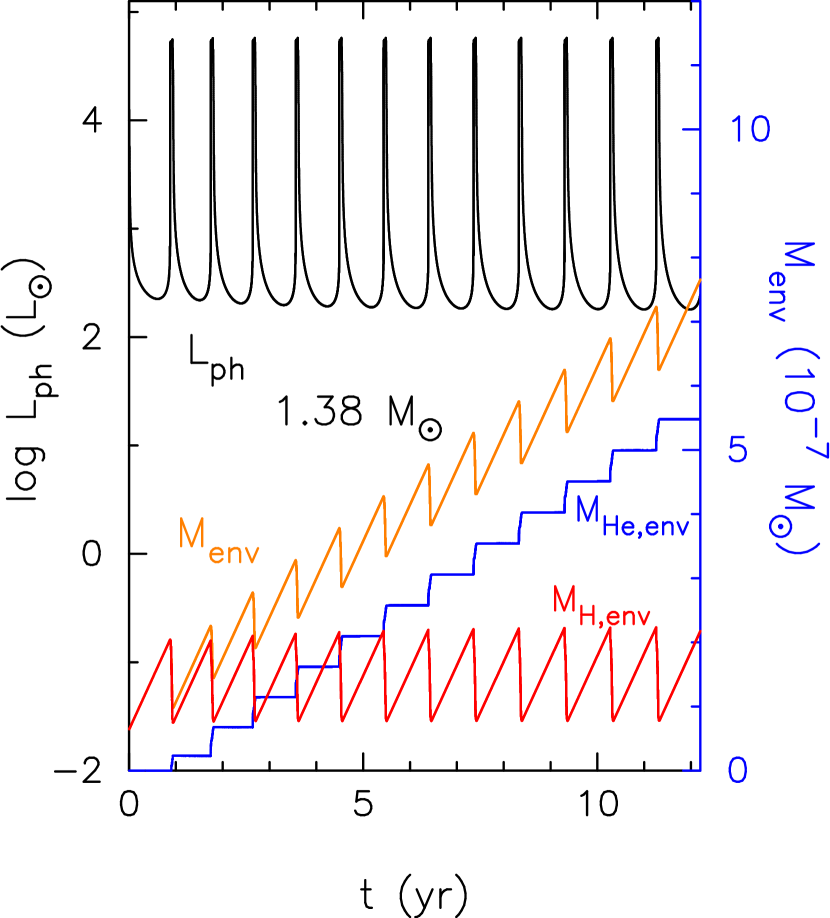
Figure 2 shows the first 12 years of our calculation. There are 12 outbursts as shown by the change in the photospheric luminosity . The mass of the hydrogen-rich envelope (defined as the mass above ) increases during the inter-pulse phase owing to accretion, and decreases during the outburst, owing partly to wind mass-loss and partly to hydrogen nuclear burning. The He envelope (defined as the region between the CO WD boundary and the bottom of a H-rich envelope) increases its mass during the outburst phase. The envelope mass, , which is the summation of the H-rich and He envelopes, increases in the quiescent phases, and sharply decreases due to wind mass-loss during the outburst phases.
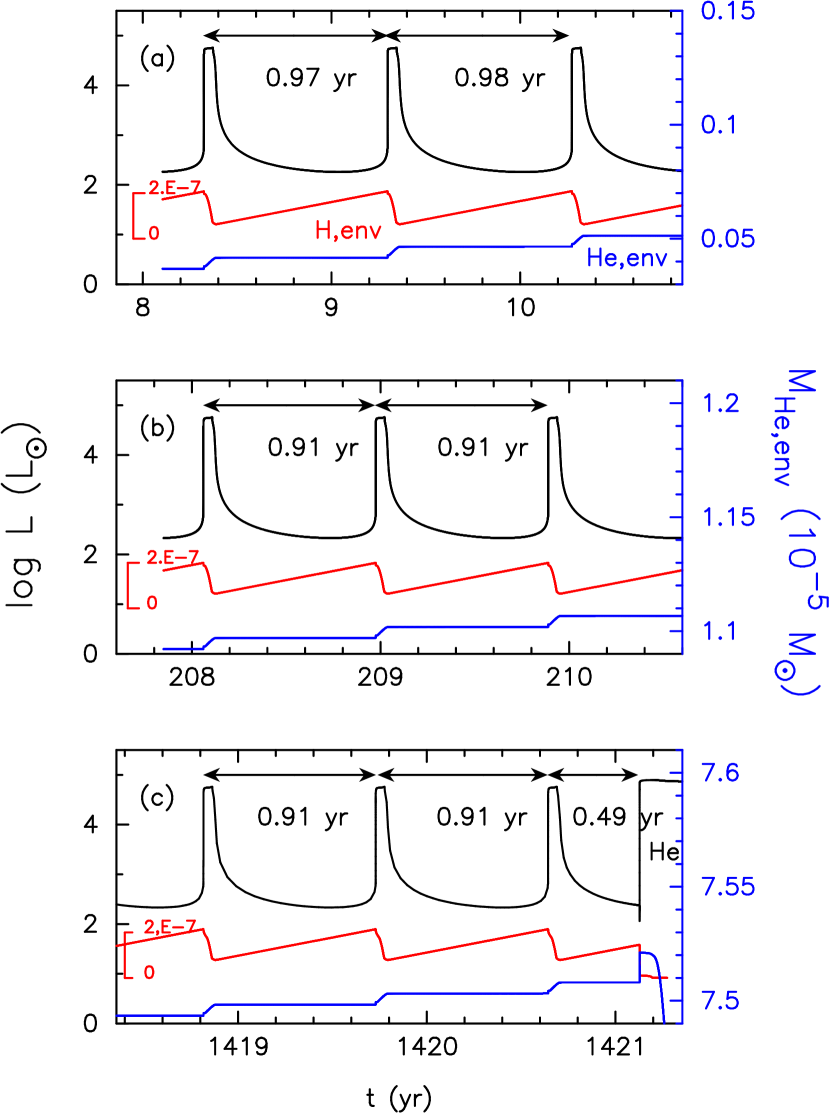
Figure 3 shows a close-up view of three flashes at three epochs of 10 yr, 210 yr, and 1420 yr. As the recurrence period becomes constant after 70 years (see Figure 1), the middle and bottom panels show the same yr. Through these flashes the He envelope steadily increases its mass with time. The bottom panel shows the last three outbursts before the He flash occurs at yr. Note that the photospheric luminosity and temperature change almost identically in panels (b) and (c), until the He nova outburst occurs. Thus, we have no precursors for the coming He nova outburst.
3.2. Toward Helium Ignition
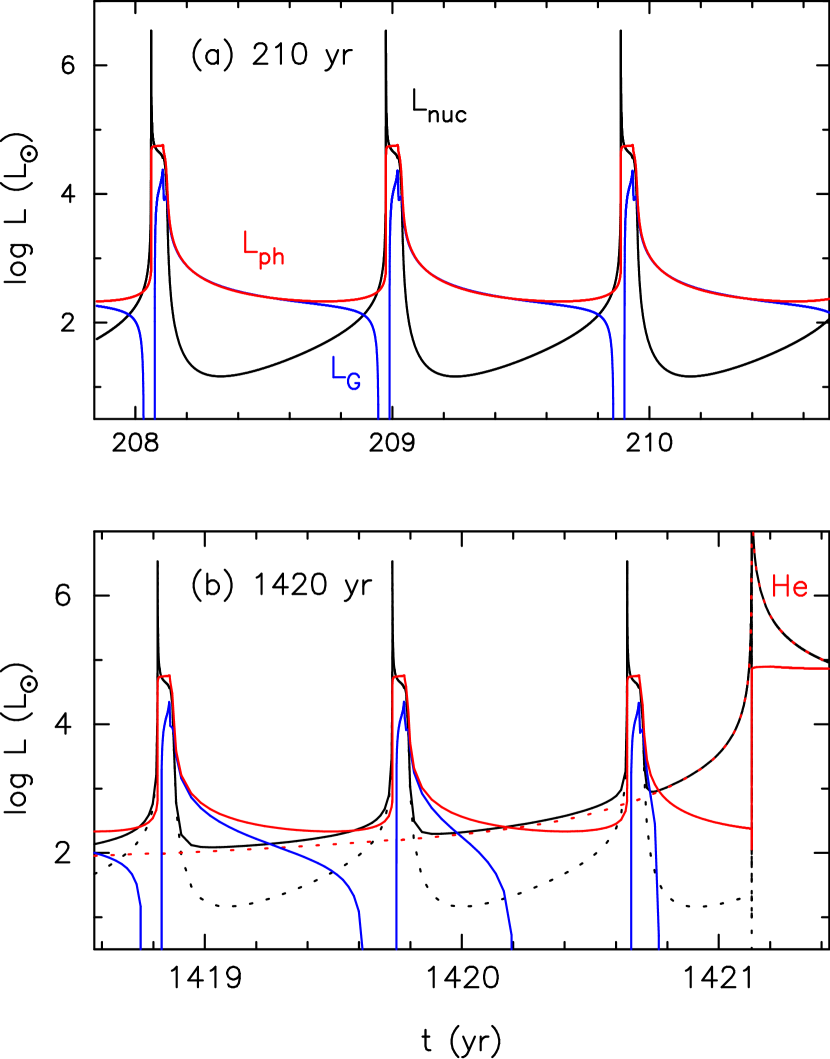
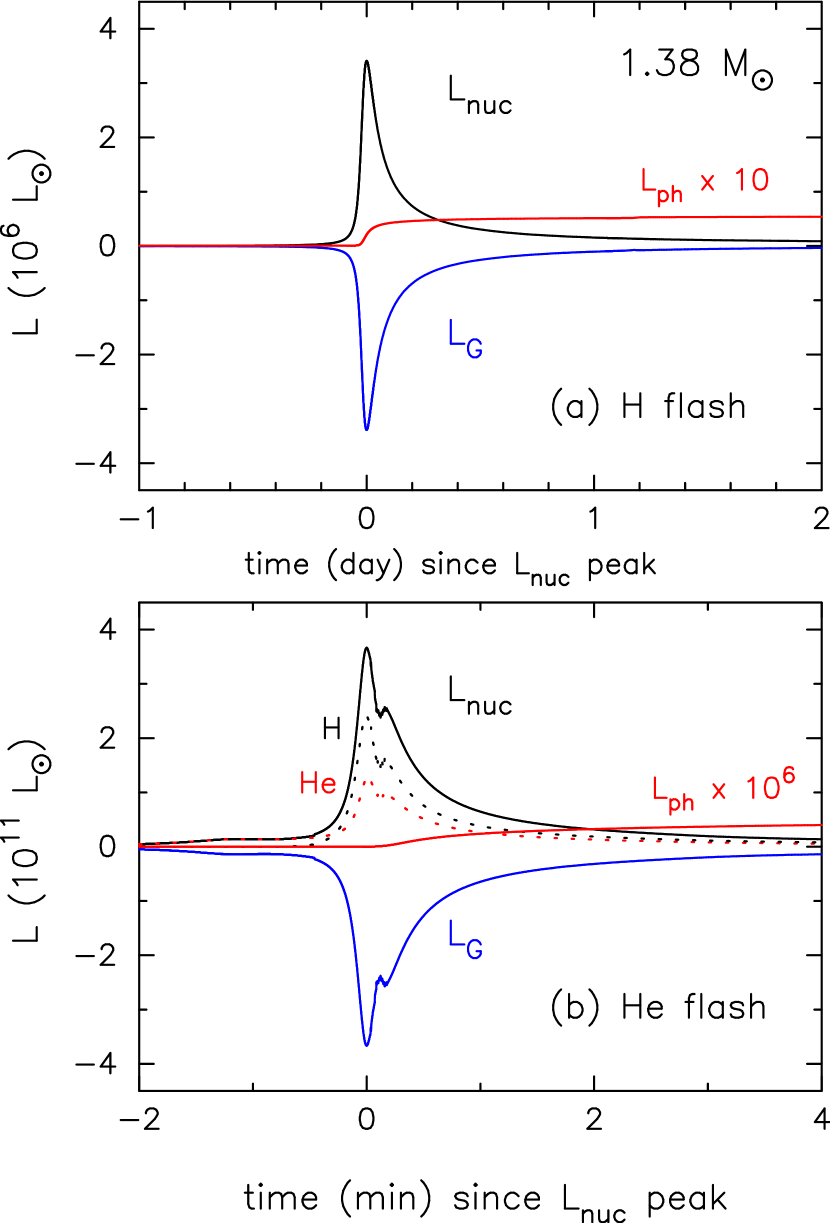
Although there are no apparent diagnostics of approaching a He nova in and until the He ignition, there is a gradual change in deep interior of the envelope. Figure 4 compares the energy budgets at years and 1420 years. The photospheric luminosity, , is the summation of the integrated nuclear burning rate, , and integrated gravitational energy release, . In the very early phase of the outburst, reaches as large as , which is mostly absorbed in the burning region as indicated as . As a result the photospheric luminosity is as small as at most in both the epochs.
Figure 4 also shows that turns from negative to positive after the peak of . The absorbed energy () is released in the later phase of the outburst. This means that the burning region is slightly sinking back toward the original, geometrically thin, plane parallel configuration. This energy release continues until the end of the H flash. The hydrogen-rich envelope mass has decreased owing to nuclear burning, being unable to support enough high temperature for hydrogen burning. Thus, nuclear burning extinguishes where quickly decreases as shown in Figure 4. In the interpulse phase, owing to mass accretion is the main source of radiation, .
Hydrogen nuclear burning is only the source of at epoch yr, while both H and He burning contribute to at yr. We plot the contribution of hydrogen burning (dotted black line) and He burning (dotted red line) separately in Figure 4(b). The hydrogen burning rate varies just in the same way as in yr, but additional energy release owing to He burning continuously increases with time, which is absorbed in the inner envelope and not transferred upward. As a result, behaves just like the epoch of yr.
In this way, every hydrogen flash is almost identical until just before the He flash, in the recurrence period, flash duration, and quiescent luminosity, even though the He envelope is growing in mass and its nuclear energy generation rate is increasing. In other words, there is no observational precursor of the forthcoming He flash.
Note that helium ignited in the last interpulse phase of our H flash cycle calculation, i.e., a hydrogen flash itself does not trigger directly the He ignition. As shown later in Figure 8, the temperature at the bottom of the He layer gradually increases as its mass increases with time. A small temperature peak appears at the epoch of the last hydrogen flash, at , i.e., just above the CO core, where He burning already occurs with low rates. This small temperature peak eventually triggers the He flash during the interpulse phase.
4. Helium Shell Flash
4.1. Onset of Helium Shell Flash
Figure 5 shows close-up views of very early phases of H and He shell flashes. The He flash is significantly different from the H flash in many points. One of the differences is the nuclear energy release rate. At maximum, the integrated nuclear energy release rate reaches in the H flash, whereas it reaches as large as in the He flash, times larger than that of H burning. The timescale is also very different. The H flash undergoes explosive nuclear burning in days, whereas the He flash proceeds in as short as minutes.
In both the cases most of the nuclear energy is absorbed in the lower part of the burning region as shown by a large negative value of . Thus, only a very small part of the nuclear energy is transported outward and emitted at the photosphere as . As a result, the photospheric luminosity does not exceed the Eddington luminosity. These properties were already reported for the H flash model of WD (Figure 2 in Kato et al., 2016). The present calculation demonstrates that the He nova has similar properties even for much larger nuclear energy release rates and much shorter timescales.
4.2. H-R Diagram and X-ray Flash
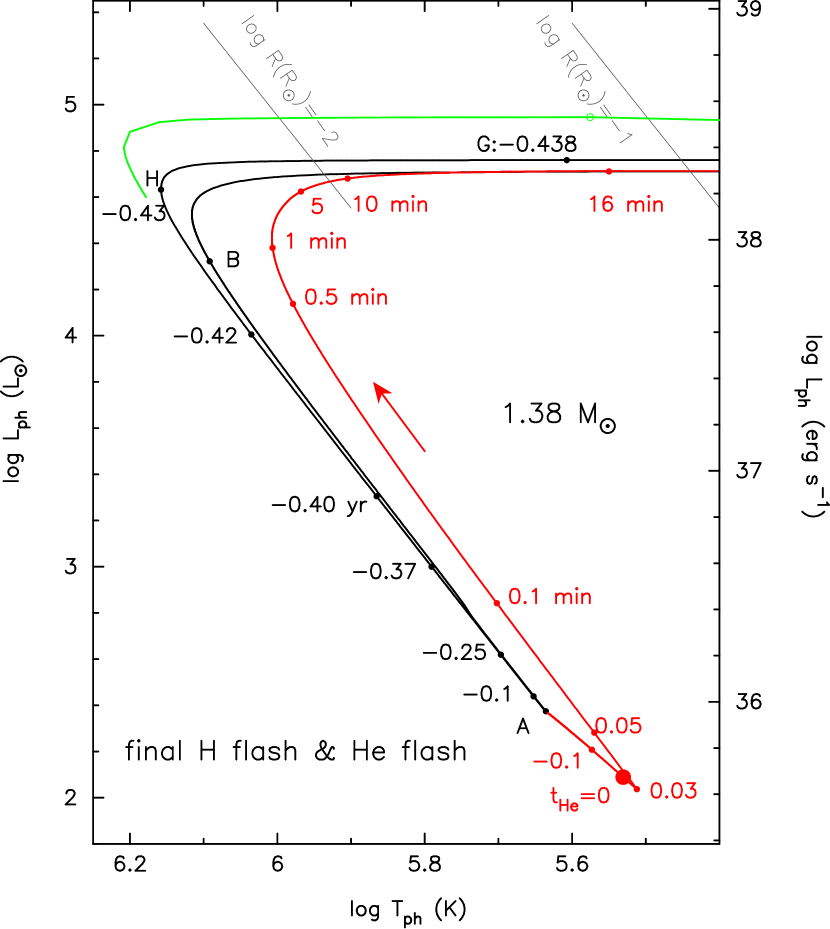
Figure 6 shows the track in the H-R diagram for the final H flash (solid black line) followed by the He shell flash (solid red line). Now we define the time starting at the onset of the He flash. We set when the total nuclear energy generation rate reaches its maximum, . After the final hydrogen flash, the star becomes faint keeping the photospheric radius almost constant, from point H (maximum ) toward the point of . It takes 0.43 yr. After that the star brightens up within a minute, along with a constant but a bit larger than the photospheric radius in the case of H flashes.
A similar track in the H-R diagram was already shown by Iben et al. (1983) as an evolution passing the phase of a planetary nebula nucleus of an post-AGB star. As the star evolves down in the H-R diagram, a final He flash occurs and the star brightens up again. The decay timescale of the final H shell flash is as long as 4000 yr, while the rising timescale of the He shell flash is 20 yr. These values should not be directly compared with our case because the WD mass is different, but we see similar characteristic properties of a He shell flash.
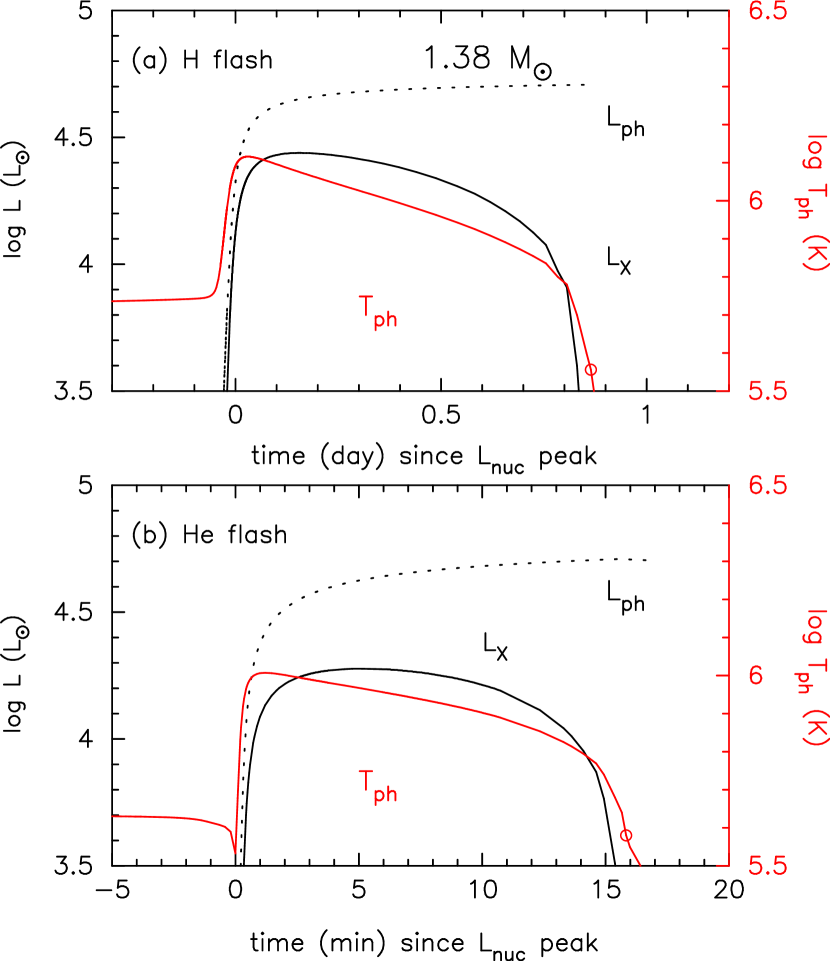
Figure 7 demonstrates the difference in the rising timescales between H and He flashes. The figure shows the evolutions of the photospheric temperature, total luminosity, and (0.3 – 1.0) keV X-ray luminosity for the H and He flashes. The X-ray luminosities are calculated assuming the black body spectrum of the photospheric temperature. This assumption may not be accurate for observational X-ray fluxes but enough to estimate the duration of the X-ray flash, because the rising and decay timescales are very short compared with the duration. The X-ray flash is a brief X-ray bright phase in the very early phase of the outburst before the optical maximum (see, e.g., Kato et al., 2016). As the He flash is much more violent, the duration of the X-ray flash is as short as 15 min and much shorter than that of the H flash ( day). Nevertheless, the X-ray luminosity is a little bit smaller than that of the H flash because of a lower photospheric temperature (red line in Figure 6). Thus, detection of X-ray flash in the He flash would be difficult even in high cadence satellite observations as planned for the X-ray flash in the 2015 outburst of M31N 2008-12a (Kato et al., 2016).
4.3. Internal Structures before/after Helium Ignition
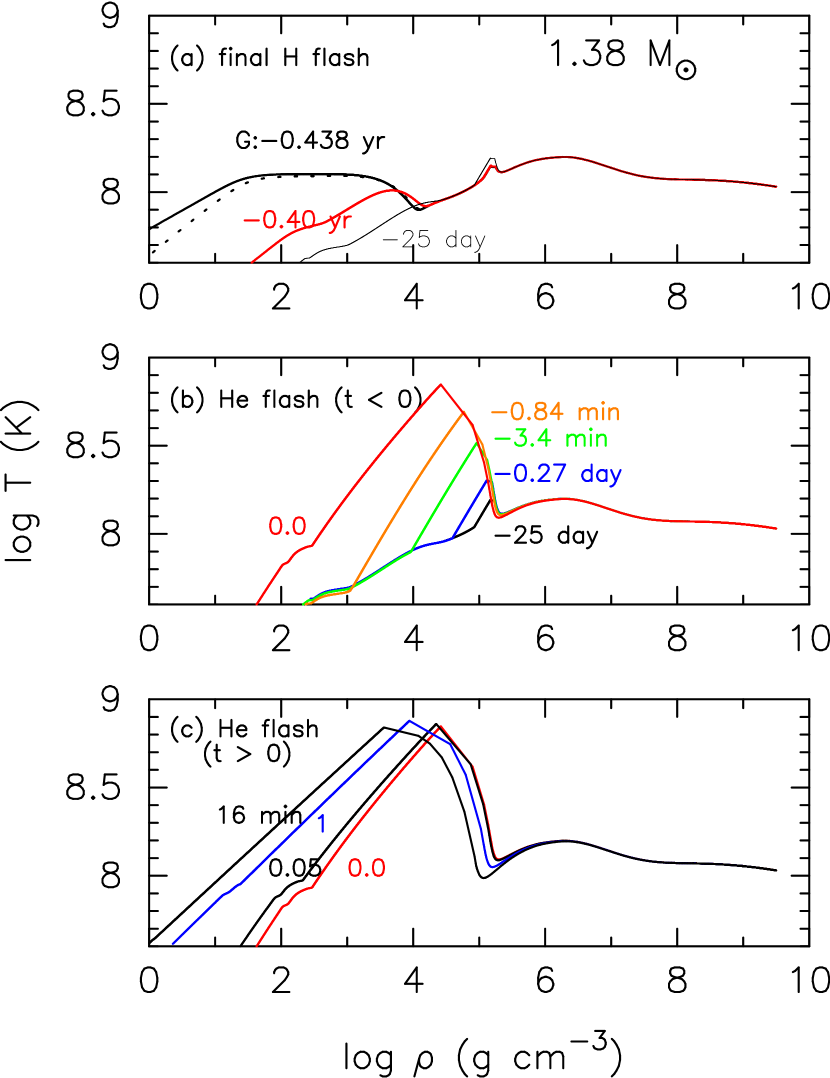
Figure 8 shows the temporal changes of the internal structure in the - plane during the course of H and He shell flashes. The rightmost point corresponds to the center of the WD. Figure 8(a) shows the structure change in the later phase of the final H flash, starting from stage G in Figure 6, which roughly corresponds to the beginning of a late supersoft X-ray source (SSS) phase. Hydrogen ignites at the bottom of the H-rich envelope, i.e., , but until this stage, heat was transferred both outward and inward to form a large hot region (). The internal structure hardly changes in the SSS phase (from stage G to stage H: dotted line). In the following cooling phase toward days, the star moves down in the H-R diagram (Figure 6) from stage H to stage A along with a constant radius.
The temperature profile () changes up and down, in the flash and interpulse phases, in every cycle. On the other hand, the temperature in the deep interior of the envelope hardly changes, except that a tiny peak appears at the base of the He zone () in the last three H flashes.
The middle and bottom panels show the temperature change immediately before and after the He ignition (), respectively. The middle panel demonstrates that the tiny peak at in the top panel extends toward lower-density region and the maximum temperature increases to (K) . A convection zone develops outward from the temperature maximum. Lower density layers become hotter and hotter, whereas the temperature at the He burning zone gradually drops because of adiabatic expansion (negative ).
4.4. Mixing of Hydrogen into Helium Burning Zone
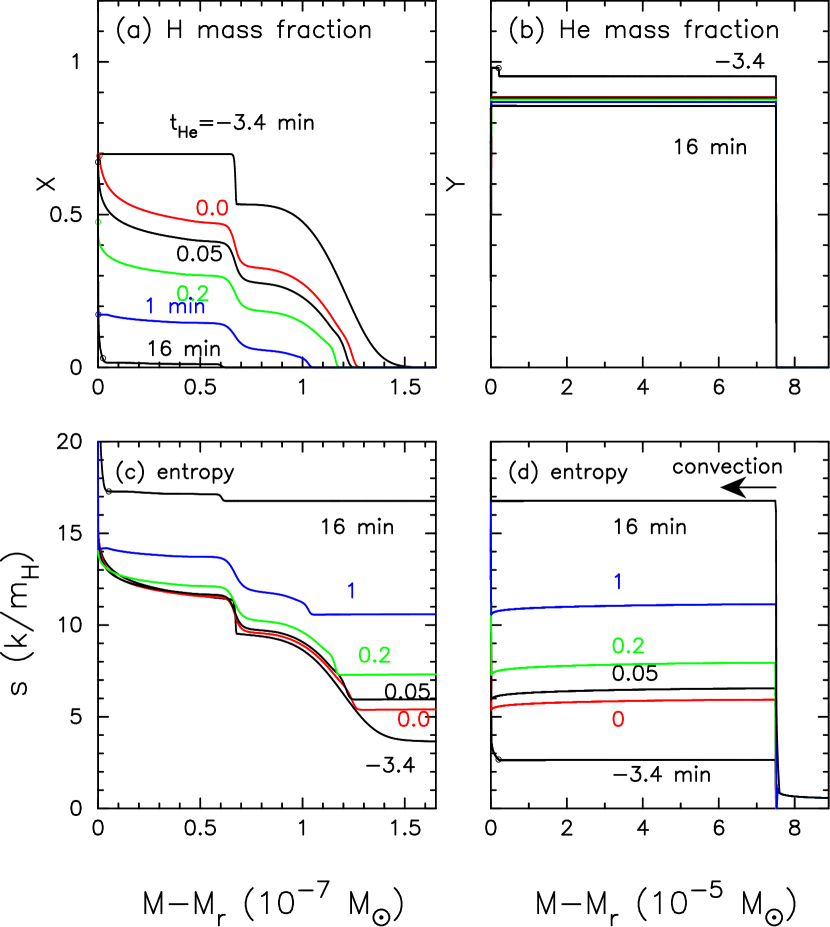
Figures 9(a) and (b) show the temporal change of the H/He profile, while Figures 9(c) and (d) show the entropy distribution in the corresponding stages. After the final H-flash, freshly accreted matter (, , and ) accumulates on top of the H-rich/He layer. Figure 9(a) shows that, at min, the freshly accreted layer of lies on top of the leftover of the final H-flash, where is decreasing inward.
Convection occurs, before , at the He nuclear burning region. The convection spreads almost all over the envelope. The inner edge of the convective region is shown as the origin of the black arrow in Figure 9(d). The outer edge of the convective region is indicated by the small open circles. Note that the convection does not reach the photosphere, thus, the surface hydrogen content is always until the wind occurs at min.
The convective region extends all over the He layer and penetrates into the upper H-rich envelope (see Figures 9(c) and (d)). The H-rich matter is carried inward and mixed into deep interior of He-rich zone where the temperature is very high, and hydrogen is burned into helium. Therefore, the H mass fraction rapidly decreases with time. As shown in panel (a), most hydrogen disappears until min.
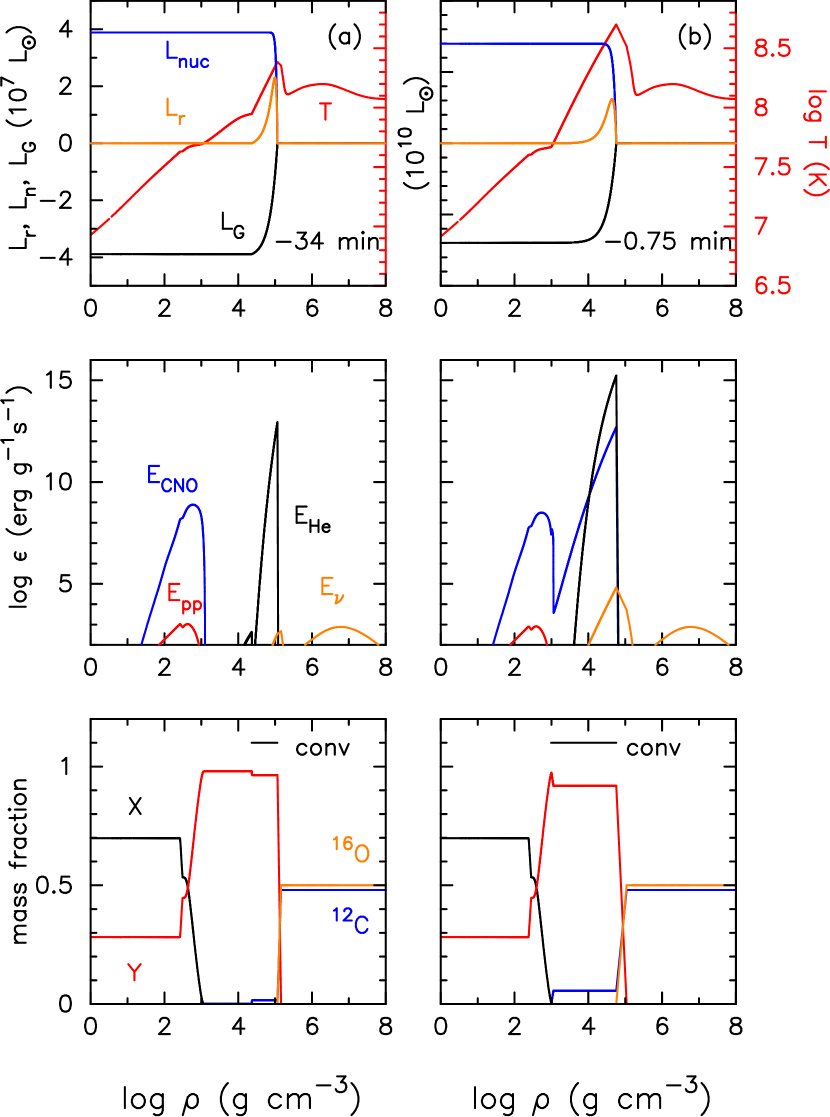
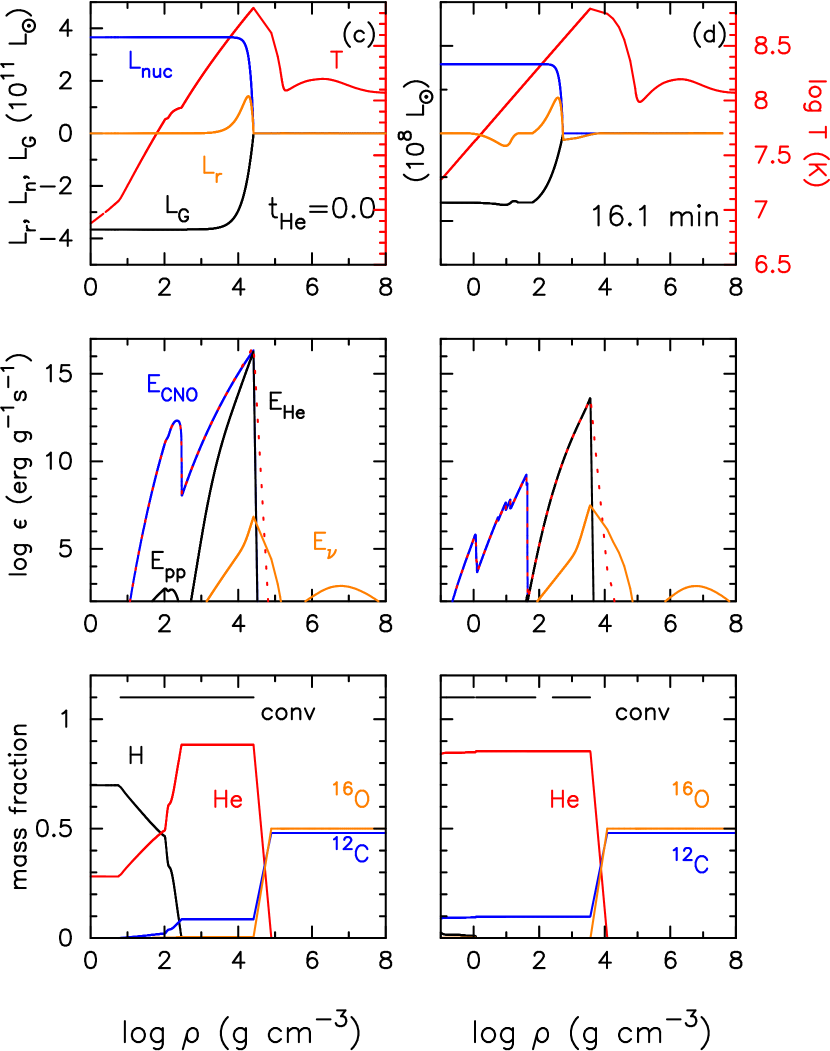
Figures 10 and 11 show the changes of the energy budget, nuclear-burning energy-generation rate, and chemical composition, for the selected stages of (a) min, (b) min, (c) 0.0 min, and (d) 16.1 min. The top panels show the nuclear luminosity integrated from the center of the WD up to the radius , (solid blue lines), integrated gravitational energy release rate, (solid black lines), and local luminosity at radius , (solid orange lines), which is the sum of radiative and convective luminosities. The temperature profile (red lines) is added. The middle panels show the energy generation rates per unit mass owing to pp-chain, CNO-cycle, and He burning, and the neutrino energy loss rate. The bottom panels show the mass fractions of selected elements.
The convective region is also indicated by the short horizontal bars in the bottom panels. The convection started from the He burning region and spreads outward all over the He layer and penetrates into the H-rich envelope until . Thus, the surface hydrogen is mixed into the inner He layer and explosively burns with very high temperatures. As shown in the middle panels, the specific energy generation rate owing to CNO-cycle becomes comparable to that of He burning even in the region where the H mass fraction is very small. Therefore, hydrogen burning contributes as much as two thirds to the total nuclear burning rate as in Figure 5(b).
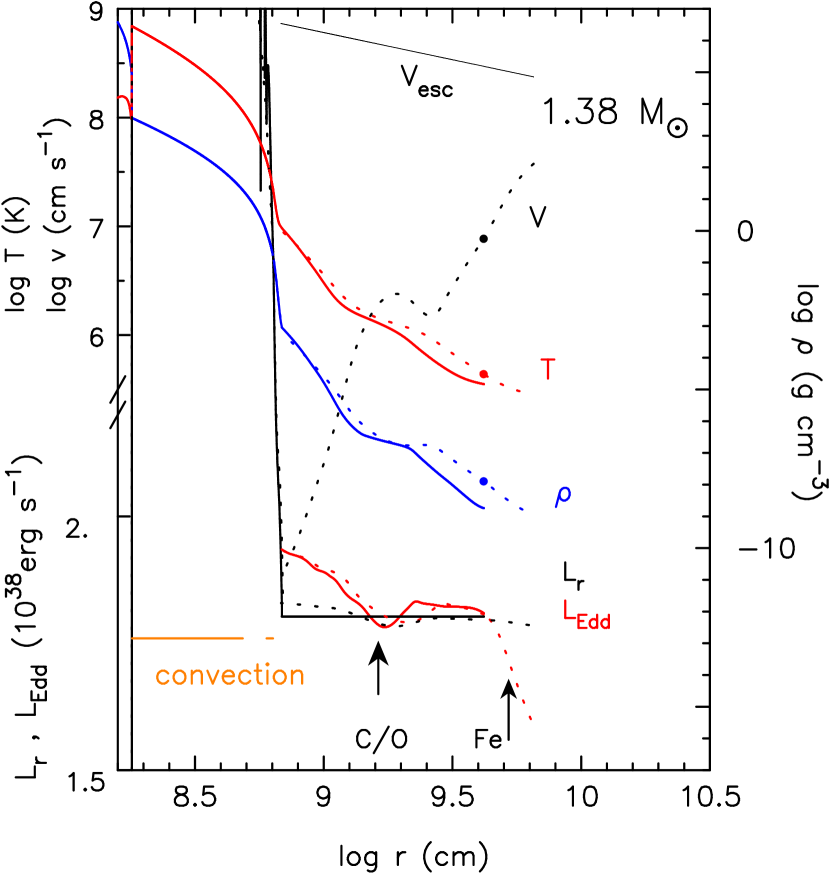
4.5. Occurrence of Optically Thick Wind
Figure 12 shows envelope structures just before and after the optically thick winds occur. The solid/dashed lines denote the structures just before/after the optically thick winds occur. We also indicate two places corresponding to the inner edge of the opacity peak owing to highly ionized Fe, C, O, and Ne (labeled “C/O”) and inner edge of the peak owing to low/mid-degree ionized iron (labeled “Fe”) by the arrows. The optically thick winds are driven by the Fe opacity peak, not by the C/O peak, because the sonic point (critical point, Kato & Hachisu, 1994) of the optically thick winds is located at the inner edge of the Fe opacity peak, not at the C/O peak. The structure changes little at the onset of optically thick winds. This property is the same as that of acceleration in hydrogen flashes (Kato et al., 2016).
Our calculation of the He flash stopped at years before it evolves to a SSS phase because of numerical difficulties. As well known Henyey-type code calculations do not work (do not converge) when the envelope extends to a giant size and surface region becomes radiation-pressure dominant. One way to continue numerical calculation is to assume very large mass-loss rates, but such large rates are often inconsistent with realistic wind acceleration such as optically-thick winds. In our previous paper, we developed an iteration method to calculate a complete cycle of hydrogen shell flashes with mass-loss rates consistent with the optically-thick winds (Kato et al., 2017). However, the He shell flash is so violent that we did not succeed in calculating the wind mass-loss phase with the iteration method. Thus, in this work, we did not adopt the iteration cycle, instead, we assumed relatively large trial mass-loss rates during the He flash. Although we assumed mass-loss rates as small as possible, they are much larger than those of the optically-thick winds. This makes the outburst evolution faster, so we sickly underestimate the flash duration. We suppose the duration of the He flash possibly longer than 1.6 years, namely about 2 years or more.
5. Discussion
5.1. Initial WD Model and Its Central Temperature
Prialnik & Kovetz (1995) and Yaron et al. (2005) presented nova calculations for a wide range of three parameters, the WD mass, central temperature of the WD, and mass-accretion rate. These three parameters are not independent of each other but linked through long-term evolution of the binary system. Epelstain et al. (2007) calculated 1000 cycles of H flashes on a 1.0 WD with a mass-accretion rate of yr-1. The recurrence period quickly increases by a factor of 10 from the initial years in the first 400 cycles and then turn to a gradual increase to years in the final 100 cycles (see their Figure 2). They adopted an initial WD temperature of K, and during the calculation, the central temperature decreases with time by a factor of 5. Such a large change occurs because they assumed a much hotter initial WD model than that of an equilibrium model with the corresponding mass-accretion rate. The above authors took a 0.6 WD with yr-1 and showed that an initially hotter WD of K cools down but an initially cooler WD of K becomes hotter and the WD temperatures approach a common equilibrium value after 3000 cycles. This means that if they adopted an initial WD model close to that of the equilibrium model, nova cycle would approach a steady-state much earlier.
Hillman et al. (2016) also presented a similar phenomena, in successive helium shell flashes in a He accreting WD with a mass-accretion rate of yr-1. The central temperature increased by a factor of 4 through 400 helium shell flashes during which the WD mass increases from 1.105 to 1.247 .
In the present paper we adopted an initial WD model very close to the thermal equilibrium with the mass-accretion rate (see Section 2). Thus, the WD interior is already hot and the central temperature is as high as (K)=8.0299 at the start of calculation ( yr) that is close to the final value of (K)=8.0304 at the onset of He shell flash ( yr). Therefore, in our calculation, the recurrence period soon (after 70 cycles) approaches the final value with a small amplitude (8 %) variation (see Figure 1).
Kato et al. (2015, 2017) suggested that the recurrent nova M31N 2008-12a is consistent with the 1.38 WD model because of its short recurrence period and rapid decline. Such an extremely massive WD is unlikely born as it is, but likely has grown up through long-term mass-accretion from the companion star (see, e.g., Hachisu et al., 1999a, b). Thus, the WD is likely as hot as expected in an equilibrium model with the mass-accretion rate of yr-1. Therefore, our assumption of the initially hot WD is reasonable.
5.2. Accretion Energy
We suppose that gas is accreted through an accretion disk, releasing a part of gravitational energy from its surface which is emitted perpendicularly to the disk. Still, remaining energy is expected to be released in the boundary layer. We have neglected the energy released above the photosphere as in other previous nova calculations (e.g. Idan et al., 2013; Wolf et al., 2013a; Hachisu et al., 2016), whereas Prialnik & Kovetz (1995) included the energy from boundary layer of which amounts 15 % of the gravitational energy based on the work by Regev & Shara (1989). The 15 % of the gravitational energy release rate corresponds to erg s-1 () in our case. Thus, the quiescent luminosity increases to (erg s. The additional energy, however, hardly causes appreciable effects in the nova calculations as discussed below.
The heat flux from the boundary layer amounts 1.5 times the quiescent phase luminosity of our model. If this additional heat source changes thermal structure deep interior, the flash properties, such as the ignition mass, maximum temperature, and recurrence period may change. Prialnik & Kovetz (1995) included 15 % of the gravitational energy, and their WD model with the mass accretion rate of yr-1 ( K) has the accreted mass of and the maximum temperature K. For the same WD mass and accretion rate, Hachisu et al. (2016) obtained and K. Considering the differences in the input parameters, these two models are in good agreement. Hachisu et al. (2016) also obtained a 1.35 model with yr-1 that shows and K, also being consistent with the grid models of 1.25 and 1.4 with yr-1 and yr-1 in Prialnik & Kovetz (1995). Thus, we may conclude that the inclusion of the additional 15 % of the gravitational energy release does not make much difference on the flash properties.
5.3. Mass Accumulation Efficiency
In our long-term evolution model, a part of the accreted H-rich matter is lost during the wind phase. In the present work, we adopted slightly overestimated mass-loss rates as described in Section 2, to simplify our calculation. The adopted wind mass-loss rates result in the 64% lost of mass during one cycle of H flash. Thus, the mass accumulation efficiency, (the ratio of lost mass to accreted mass), is . This ratio increases to if we use the self-consistent wind mass-loss rates (Kato et al., 2017).
This accumulation efficiency is, however, highly uncertain because there are many unsolved problems associated with nova light curves. In classical novae, theoretical free-free emission light curves well reproduce the decay phase of light curves in optical and NIR bands (i.e., Hachisu & Kato, 2006, 2010, 2015, 2016). We expect that the optical peak corresponds to the peak of the wind mass-loss rate, because the free-free emission optical flux is in proportion to the square of the wind mass-loss rate.
In the rising phase, on the other hand, no reliable light curves have been calculated neither for classical novae nor for recurrent novae. Hachisu & Kato (2014) presented an idea for the pre-maximum evolution, based on color-color evolution of fast novae, that the mass ejection begins just before the optical maximum. The quick start of the mass ejection in our model may correspond to the fast expansion of the photosphere rising toward optical/NIR maximum.
If this is the case, the real mass-ejection begins shortly before the optical peak. In M31N 2008-12a outbursts, optical/NIR magnitudes rose in a short time toward the peak ( day) (e.g. Darnley et al., 2016). This timescale is much shorter than the slow pre-maximum evolution of theoretical model (Kato et al., 2016, 2017), in which the wind phase lasts 2 weeks before the peak. Moreover, the wind velocity does not reach the escape velocity in the beginning of the wind phase (see Figure 7 of Kato et al., 2016).
One possible idea to solve the inconsistency is that, in the premaximum phase, the wind solutions should be treated as a theoretical representative of fast-expanding surface of the hydrogen-rich envelope when the static solutions do not exist as the luminosity approaches the Eddington luminosity, and the wind mass-loss rate is just a parameter to characterize the expanding envelope solutions. In this case, wind solutions give the photospheric temperature, radius, and luminosity, but the wind mass-loss rates should not be taken as real mass-outflow rates. If we adopt this idea, the mass lost from the system becomes roughly a half, i.e., % of the accreted mass and the mass accumulation efficiency is .
Another important problem is the effect of rotation. Yoon et al. (2004) calculated He flashes including rotation and showed that rotation generally makes flashes milder because of a decrease in effective gravity and contamination of C and O by rotational mixing at the base of He layer. On the other hand, the ignition mass seems to be hardly affected by rotation (we judged it from their Figure 1). If we simply apply these results to our model, we may say that H flashes will be milder because of a decrease in effective gravity and contamination of He (not WD material, because heavy element enrichment is not observed), while the timescale of inter-flash phases would be unchanged. Thus, the mass lost from the system could become further small (i.e., ).
5.4. Observational Properties of Helium Flash
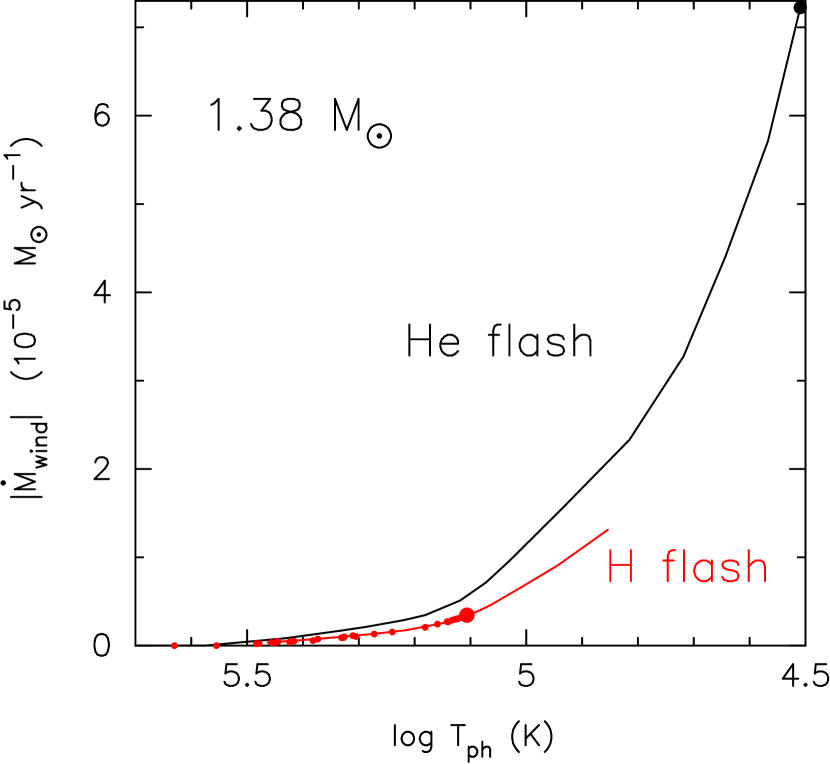
Figure 13 shows the wind mass-loss rates against the photospheric temperature. The filled red circles are of the evolution model of a H flash on a WD with yr-1, calculated for M31N 2008-12a outbursts (Kato et al., 2017), in which the wind mass-loss rates are obtained from iteration process and are consistent with the optically thick wind acceleration. The large filled red circle represents the stage of the maximum wind mass-loss rate of the H flash, which may correspond to the stage of the optical/NIR maximum because in free-free emission, the optical/NIR magnitudes are in proportion to the square of the wind mass-loss rate (Equation (9) in Hachisu & Kato, 2006). The red line depicts the wind mass-loss rate of the steady-state sequence of optically thick wind solutions. The envelope mass at the large filled red circle is .
This figure also shows a steady-state sequence for a helium flash on a 1.38 WD with the chemical composition, , , and (Kato & Hachisu, 2004). The upper end of this line (large filled black circle) represents the steady-state solution of the envelope mass, , consistent with the ignition mass of our He flash, . The corresponding mass-loss rate is yr-1, about 20 times larger than yr-1 of the H flash. If we further assume that the proportionality constant of Equation (9) in Hachisu & Kato (2006) is common among He-rich and H-rich matter, the free-free emission flux of He nova is roughly times higher than those of the H flash, where the factors 2 and 8 are the difference of electron and nuclei number densities between the H-rich and He-rich envelopes. Thus, the peak magnitude in optical/NIR emission of He nova is =3.5 mag brighter than that of the M31N 2008-12a outburst. We can expect a bright He nova outburst. Thus, we encourage search for a He flash in archival plates.
Figure 6 shows the sequence of the steady/static solutions (solid green line) that approximately represents the decay phase of He nova if the gravitational energy release rate is negligible (Kato et al., 2017). The SSS phase of this sequence lasts 37 days, from the end of the wind mass-loss (small open circle) to the left-end of the line, where He nuclear burning ends. The effect of the gravitational energy release would be slowdown of the evolution (see Kato et al., 2017). If this effect amounts a few ten percent, the SSS phase may last days. However, He burning produces substantial amount of carbon, which would trigger thick dust-shell formation. In the outburst of the He nova V445 Pup dust blackout occurs 210 days after the optical discovery, which prevents direct observation of the WD until now (Kamath & Anupama, 2002; Kato & Hachisu, 2003; Ashok & Banerjee, 2003; Iijima & Nakanishi, 2007; Kato et al., 2008; Woudt et al., 2009). In the same way, thick dust-shell formation would possibly hinder optical observation of a later phase of the He nova outburst of M31N 2008-12a.
It is interesting that, in the He flash, the prompt X-ray flash lasts much shorter (15 min) but the late SSS phase lasts longer (40 – 50 days) than those in the H flash (a day and a week, respectively). The He flash is much stronger because of high temperature of He ignition, which results in a shorter rising time, i.e., shorter X-ray flash. In the decay phase, on the other hand, the He envelope mass is 100 times larger than that of H envelope but nuclear burning energy release of He is 10 times smaller. Thus, the late SSS phase lasts almost one order of magnitude longer than that in the H flash.
6. Conclusions
Our main results are summarized as follows.
1. We present 1500 consecutive hydrogen shell flashes on a 1.38 WD with a mass accretion rate of yr-1. These parameters are taken from a model of M31N 2008-12a. The shell flash soon reaches a steady-state only after cycles with a small period variation of 8%. Until the He ignition, each H shell flash is almost identical in the photospheric luminosity and there are no noticeable precursors of the forthcoming He flash even in the epoch of the last hydrogen flash.
2. The helium thermonuclear runaway occurs in an extremely short timescale compared with that of hydrogen. The nuclear burning rate reaches at its peak, times larger than that of H burning. Even such large energy production rates, most of the nuclear energy is absorbed by the inner part of the burning region. As a result the photospheric luminosity is almost equal to the Eddington luminosity.
3. We present a prompt X-ray flash light-curve of the He nova. The duration of the X-ray flash of He nova is as short as 15 min, which makes the detection very difficult even in high cadence observations as done in the X-ray flash of the 2015 outburst of M31N 2008-12a (Kato et al., 2016).
4. During the early phase of the He outburst, most of the surface hydrogen is convectively mixed into the deep interior and is burned into helium before the optically thick wind mass-loss occurs. Thus, the ejecta would contain much less hydrogen (i.e., ) than we expect from the amount of accreted hydrogen-rich matter before the He flash occurs.
5. The optically thick winds begin at the end of the X-ray flash ( min), when the photospheric temperature decreases to (K) , owing to acceleration by the Fe opacity peak. Characteristic properties, such as the occurrence of the wind and interior structure of the envelope, are essentially the same as those in hydrogen shell flashes (Kato et al., 2016).
6. M31N 2008-12a is a promising candidate of He novae. We expect a He nova outburst having a very short X-ray flash (15 min), very bright optical/NIR peak ( mag brighter than M31N 2008-12a), much longer nova duration ( years), and longer SSS phase (40 – 50 days or more). Thus, we encourage search for a He flash in archival plates.
References
- Ashok & Banerjee (2003) Ashok, N. M., & Banerjee, D. P. K. 2003, A&A,409, 1007
- Darnley et al. (2015) Darnley, M. J., Henze, M., Steele, I. A. et al. 2015, A&A, 580, 45
- Darnley et al. (2016) Darnley, M. J., Henze, M., Bode, M.F. et al. 2016, ApJ, 833, 149
- Darnley et al. (2016) Darnley, M. J., Henze, M., Steele, I. A. et al. 2015, A&A, 593, 3 (Erratum)
- Darnley et al. (2014) Darnley, M. J., Williams, S. C., Bode, M. F., et al. 2014, A&A, 563, L9
- Denissenkov et al. (2013) Denissenkov, P. A., Herwig, F., Bildsten, L., & Paxton, B. 2013, ApJ, 762, 8
- Epelstain et al. (2007) Epelstain, N., Yaron, O., Kovetz, A. & Prialnik, D. 2007, MNRAS, 374, 1449
- Hachisu & Kato (2001) Hachisu, I., & Kato, M. 2001, ApJ, 558, 323
- Hachisu & Kato (2006) Hachisu, I., & Kato, M. 2006, ApJS, 167, 59
- Hachisu & Kato (2010) Hachisu, I., & Kato, M. 2010, ApJ, 709, 680
- Hachisu & Kato (2014) Hachisu, I., & Kato, M. 2014, ApJ, 785, 97
- Hachisu & Kato (2015) Hachisu, I., & Kato, M. 2015, ApJ, 798, 76
- Hachisu & Kato (2016) Hachisu, I., & Kato, M. 2016, ApJ, 816, 26
- Hachisu et al. (1999a) Hachisu, I., Kato, M., & Nomoto, K. 1999a, ApJ, 522, 487
- Hachisu et al. (1999b) Hachisu, I., Kato, M., Nomoto, K., & Umeda, H. 1999b, ApJ, 519, 314
- Hachisu et al. (2000) Hachisu, I., Kato, M., Kato, T., & Matsumoto, K. 2000, ApJ, 528, L97
- Hachisu et al. (2006) Hachisu, I., Kato, M., Kiyota, S., et al. 2006, ApJ, 651, L141
- Hachisu et al. (2016) Hachisu, I., Saio, H., & Kato, M. 2016, ApJ, 824, 22
- Henze et al. (2014) Henze, M., Ness, J.-U., Darnley, M., et al. 2014, A&A, 563, L8
- Henze et al. (2015a) Henze, M., Ness, J.-U., Darnley, M., et al. 2015, A&A, 580, 46
- Henze et al. (2015b) Henze, M., Darnley, M. J., Kabashima, F., et al. 2015b, A&A, 582, 8
- Hillman et al. (2016) Hillman, Y., Prialnik, D., Kovetz, A.& Shara, M. M. 2016, ApJ, 819, 168
- Iben (1982) Iben, I., Jr. 1982, ApJ, 259, 244
- Iben et al. (1983) Iben, I. Jr. , Kaler, J. B., Truran, J. W.& Renzini, A. 1983, ApJ, 264, 605
- Idan et al. (2013) Idan, I., Shaviv, N. J., & Shaviv, G. 2013, MNRAS, 433, 2884
- Iijima & Nakanishi (2007) Iijima,T., & Nakanishi, H. 2008, A&A, 482, 865
- Kamath & Anupama (2002) Kamath, U. S., & Anupama, G. C. 2002, Bull. Astr. Soc. India, 30, 679
- Kato (1966) Kato, S. 1966, PASJ, 18, 374
- Kato & Kanatsu (2000) Kato, T., & Kanatsu, K., 2000, IAU Circ. 7552
- Kato & Hachisu (1994) Kato, M., & Hachisu, I., 1994, ApJ, 437, 802
- Kato & Hachisu (2003) Kato, M., & Hachisu, I. 2003, ApJ, 598, L107
- Kato & Hachisu (2004) Kato, M., & Hachisu I. 2004, ApJ, 613, 129
- Kato et al. (2008) Kato, M., Hachisu, I., Kiyota, S., Saio, H., 2008, ApJ, 684, 1366
- Kato et al. (1989) Kato, M., Saio, H., & Hachisu, I. 1989, ApJ, 340, 509
- Kato et al. (2015) Kato, M., Saio, H., & Hachisu, I. 2015, ApJ, 808, 52,
- Kato et al. (2017) Kato, M., Saio, H., & Hachisu, I. 2017, ApJ, 838, 153
- Kato et al. (2014) Kato, M., Saio, H., Hachisu, I., & Nomoto, K. 2014, ApJ, 793, 136
- Kato et al. (2016) Kato, M., Saio, H., Henze, M. et al. 2016, ApJ, 830, 40
- Kovetz (1998) Kovetz, A. 1998, ApJ, 495, 401
- Nariai et al. (1980) Nariai, K., Nomoto, K., & Sugimoto, D. 1980, PASJ, 32, 473
- Nomoto et al. (1979) Nomoto, K., Nariai, K., & Sugimoto, D. 1979, PASJ, 31, 287
- Prialnik (1986) Prialnik, D. 1986, ApJ, 310, 222
- Prialnik & Kovetz (1995) Prialnik, D., & Kovetz, A. 1995, ApJ, 445, 789
- Regev & Shara (1989) Regev, O. & Shara, M. 1989, ApJ, 340,1006
- Shakura & Sunyaev (1973) Shakura, N. I., & Sunyaev, R. A. 1973, A&A, 24, 337
- Sion et al. (1979) Sion, E. M., Acierno, M. J., & Tomczyk, S. 1979, ApJ, 230, 832
- Sparks et al. (1978) Sparks, W.N., Starrfield, S., & Truran, J.W. 1978, ApJ, 220, 1063
- Spruit (1992) Spruit, H.C. 1992, A&A, 253, 131
- Tang et al. (2014) Tang, S., Bildsten, L., Wolf, W. M., et al. 2014, ApJ, 786, 61
- Wolf et al. (2013a) Wolf, W. M., Bildsten, L., Brooks, J., & Paxton, B. 2013a, ApJ, 777, 136
- Wolf et al. (2013b) Wolf, W. M., Bildsten, L., Brooks, J., & Paxton, B. 2013b, ApJ, 782, 117, (Erratum)
- Woudt et al. (2009) Woudt, P.A., et al., 2009, ApJ, 706, 738
- Yaron et al. (2005) Yaron, O., Prialnik, D., Shara, M.M., & Kovetz, A. 2005, ApJ, 623, 398
- Yoon et al. (2004) Yoon, S.-C., Langer, N., & Scheithauer, S. 2004, A&A, 425, 217