X-ray surface brightness observations of galaxy clusters, cosmic opacity and the limits on the matter density parameter
Abstract
In this work, we use two gas mass fraction samples of galaxy clusters obtained from their X-ray surface brightness observations jointly with recent data in a flat CDM framework to impose limits on cosmic opacity. It is assumed that the galaxy clusters are in hydrostatic equilibrium and their gas mass fraction measurement is constant with redshift. We show that the current limits on the matter density parameter obtained from X-ray gas mass fraction test are strongly dependent on the cosmic transparency assumption even for a flat scenario. Our results are consistent with a transparent universe within c.l. in full agreement with other analyses which used type Ia supernovae, gamma ray burst and data.
I Introduction
From a general point of view, cosmic opacity can be an important systematic error source in several astronomical observations. By considering type Ia supernova (SNe Ia) observations, for instance, there are four different sources of opacity by dust absorption: the Milky Way, the hosting galaxy, intervening galaxies, and the Intergalactic Medium combes ; conley ; menard ; imara ; McKinnon . In this context, the approach of Ref.lima2011 considered SNe Ia data and two different scenarios with cosmic absorption and the main conclusion was that the description of an accelerating Universe powered by dark energy111For details please refer to Ref.weinberg . or some alternative gravity theory only must be invoked if the cosmic opacity is fully negligible. Similar studies also can be found in Refs.basset ; chen1 ; chen2 ; Li2013 . The Ref.xie investigated the luminosity and redshift dependence of the quasar continuum and suggested that the reddening observed could come from cosmic dust extinction. Infrared surveys can also be affected by a population of dust grains fymbo . By considering the cosmic microwave background radiation, the results of Ref.inara showed that whereas the dust emission in galaxies could be taken out, the intergalactic dust emission is diffuse and cannot be removed easily from the maps. There is also a more exotic possibility as opacity source, namely, photons turning into unobserved particles beyond the standard model due to interaction with extragalactic magnetic fields (please refer to avg2009 ; avg2010 ; jac2010 ; tiw for details).
Other cosmic opacity tests have been performed: the approaches of Refs.HCA2013 ; LAZ2015 used current measurements of the expansion rate and SNe Ia data to impose cosmological model-independent constraints on cosmic opacity. As a result, a fully transparent universe is in agreement with the data considered (see also Ref.avg2009 ; avg2010 for analyses in a flat CDM framework). In order to explore a possible presence of an opacity at higher redshifts , the Ref.HB2014 considered data and luminosity distances of gamma-ray bursts in the CDM and CDM flat models. More recently, the Ref.FHA used 32 old passive galaxies and SNe Ia data to obtain cosmological model-independent constraints on cosmic opacity. No significant opacity was found in these studies although the results do not completely rule out the presence of some dimming source and additional tests are still required. This is exactly the subject of the present paper, where X-ray gas mass fraction samples of galaxy clusters jointly with recent data will be used. It is worth emphasizing that X-ray astronomy provides an unique opportunity to detect opacity sources that may be missed by traditional detection methods, such as those using the dust reddening of background quasars by foreground galaxies and associated large scale structure wright ; lia ; menardb .
The gas mass fraction is defined as Sasaki96 , where is the total mass and it can be obtained via hydrostatic equilibrium assumption while (gas mass) is obtained by integrating a gas density model (see next section for details) and using X-ray or Sunyaev-Zel’dovich effect observations. By using hot, massive and relaxed galaxy clusters as laboratories, gas mass fraction samples have been compiled and used to constrain cosmological parameters, mainly the matter density parameter, (see allen2002 ; lima2003 ; roque2006 ; allen2008 ; ettori2009 ; mantz2014 for several analyses). The gas mass fraction as a cosmological test is based on a basic hypothesis: the ratio between baryons and total matter (baryons plus dark matter) in galaxy clusters is a fair sample for the Universe on large scales, being constant through the cosmic history.
Over the years, this key hypothesis has been supported by observational and hydrodynamical simulation results. For instance, the Ref.lagana investigated the baryon distribution in groups and clusters. By considering 123 systems () they found that the gas mass fraction does not depend on the total mass for systems more massive than solar masses. Moreover, they obtained only a slight dependence of gas mass fraction measurements with redshift for (see their fig. 6). On the other hand, the hydrodynamical simulations of battaglia ; planelles showed that hot, massive galaxy clusters ( solar masses) and dynamically relaxed, do not show significant evolution for the depletion factor, , (see Table III in planelles ). They considered and found considering the complete sphere at (this radii is that one within which the mean cluster density is 2500 times the critical density of the Universe at the cluster’s redshift). However, it is important to comment that thanks to new X-ray observations, it has been possible detect the presence of intrinsic scatter in the gas mass fraction measurements. In 40 measurements from the Ref. mantz2014 , for instance, a 7.4% of intrinsic scatter was found. At the moment, it is not possible to distinguish observationally between the possible causes of this scattering. In this way, hydrodynamical simulations have also shown that a similar level of dispersion may be due to presence of a non-thermal pressure (see, for instance, Nelson ).
Recently, some works have shown that the X-ray gas mass fraction measurement as a cosmological tool is strongly dependent on the cosmic distance duality relation (CDDR) validity gon2012 ; hga2012 ; santos ; wang , , where and are the luminosity and angular diameter distances for a given redshift . Particularly, the authors of Ref.shafeliou searched for systematics in SNe Ia and galaxy cluster data using this relation, without advancing any hypothesis about the nature of dark energy. This relation was proved in Ref. ethe and it only requires sources and observers connected by null geodesics in a general Riemannian spacetime as well as conservation of photon number222For recent results of CDDR tests see Table I in hba2016 . . Thus, even in a Riemannian spacetime, any departure from cosmic transparency could lead to dubious estimates of cosmological parameters if one uses cosmological tests dependent on flux, such as, SNe Ia distance module and X-ray gas mass fraction (X-ray GMF). Therefore, although the dark energy is supported by several other independent probes, if some extra opacity is still present, the observations will give us unreal values to cosmological parameters, mainly to the if one considers those from X-ray GMF of galaxy clusters.
In this work we discuss how X-ray GMF observations of galaxy clusters jointly with recent data can be used to investigate a possible departure from transparency cosmic in a flat CDM framework. The X-ray GMF samples used separately in our analyses consist of: 42 and 40 measurements obtained by the Refs.allen2008 and mantz2014 , respectively. The total redshift range is . The data consist of 38 points in the redshift range obtained from cosmic chronometers and radial BAO methods (see section III for details). We also consider a gaussian prior on the Hubble constant value, , from Ref.Ade (Planck collaboration). In our analyses, the cosmic opacity is parameterized by , which corresponds to a modification on the cosmic distance duality relations such as (if is small and ). Our results are consistent with a transparent universe within c.l. (). Although the limits presented here on the cosmic opacity are less restrictive than those coming from the similar analyses with SNe Ia, they correspond to another band of the electromagnetic spectrum. Moreover, we verify that the constraints on obtained from the X-ray GMF test are strongly dependent on cosmic transparency assumption even in the simple flat CDM framework333It is worth to comment that the authors of Ref.santos tested the CDDR with gas mass fraction and measurements in a cosmological model independent approach. In this way, no information of how cosmological results from X-ray observations are depend on the cosmic transparency hypothesis was obtained..
II Cosmic opacity and gas mass fraction observations
In this section we first discuss how a cosmic opacity presence affects the luminosity distance, and then we present the link between luminosity distance and X-ray GMF observations.
II.1 Luminosity distance and cosmic opacity
The methodology used in our analyses was proposed by avg2009 . It was initially applied for SNe Ia data, however, it also can be applied for X-ray GMF observations. As it is well known, the distance modulus derived from SNe Ia or gamma-ray bursts and the X-ray surface brightness observations may be systematically affected if there are cosmic dimming sources. In few words, a direct consequence of the photon number reduction is an increasing of . Hence, if denotes the opacity between an observer at and a source at , the flux received by the observer in is attenuated by a factor and, therefore, the observed luminosity distance () is related to the true luminosity distance () by
| (1) |
Then, the observed distance modulus is chen1 ; chen2
| (2) |
In this paper, comes from a flat CDM model, such as
| (3) |
where is the speed of light and
| (4) |
In the above expression, stands for the matter density parameter measured today. In order to use the full redshift range of the available data, we follow the Refs.avg2009 ; avg2010 and considered the parameterization , with parameterizing departures from transparency cosmic. These authors argued that for small and this is equivalent to assume an optical depth parameterization or with the correspondence . In this way, in our analyses, we consider a simple linear parameterization for , such as: . The measurements of (or ) are obtained from the X-ray GMF data. The unknown parameters and are constrained by fitting the X-ray GMF data separately and jointly with measurements on a flat CDM model. As comment earlier, the basic idea behind this test is that while the X-ray surface brightness of galaxy clusters can be affected by cosmic opacity, the measurements are obtained via two ways: from measurements of radial BAO and from the differential ages of old passively evolving galaxies, which relies only on the detailed shape of the galaxy spectra but not on the galaxy luminosity. Both methods are cosmic opacity independent. Therefore, values are not affected by a non-zero since is assumed not to be strongly wavelength dependent in the optical band.
II.2 Luminosity distance from galaxy clusters
In galaxy clusters, the GMF is defined by allen2008
| (5) |
where is the total mass (dominated by dark matter) and is the gas mass. The total mass within a given radius can be obtained by assuming that the intracluster gas is in hydrostatic equilibrium. On the other hand, the intracluster gas emits X-ray predominantly via thermal bremsstrahlung and its mass can be estimated by integrating a gas density model. The is expected to be same at all since these structures are the largest virialized objects in the Universe, consequently, a faithful representation of the cosmological average baryon fraction can be found in clusters. Thus, in order to constrain cosmological parameters, the X-ray GMF of galaxy clusters can be used via the following expression allen2008
| (6) |
where the symbol * denotes quantities from a fiducial cosmological model used in the observations (usually a flat CDM model with and km/s/Mpc). The parameter defines an arbitrary normalization on which we marginalize. The ratio multiplying in brackets computes the expected measured gas fraction when the cosmology is varied. On the other hand, in Ref.gon2012 , the authors showed that the gas mass fraction measurements extracted from X-ray data are affected if there are cosmic opacity sources (consequently, departure from the CDDR validity). In a such framework, if one considers our parametrization (or ), the Eq.(6) is rewritten as
| (7) |
Finally, we define the distance modulus of a galaxy cluster as
| (8) |
which depends on cosmic opacity ( is in Mpc).
III Data
In this paper, we consider two types of data sets:
III.1 Cosmic opacity dependent data
Here we have two GMF samples, namely:
-
•
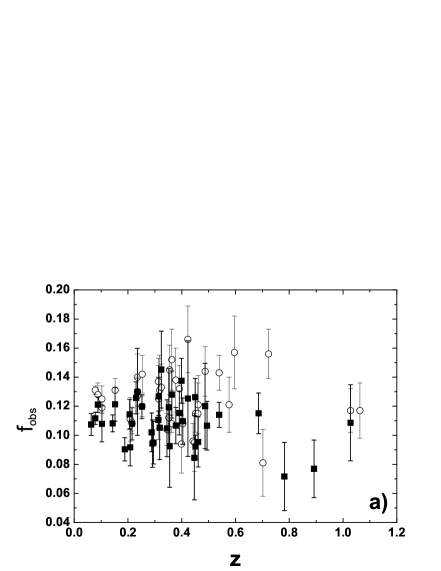
42 X-ray GMF measurements obtained by the Chandra telescope for hot (), massive, X-ray luminous and dynamically relaxed galaxy clusters spanning the redshift range (see Ref.allen2008 ). The X-ray emitting gas mass and total mass were obtained via hydrostatic equilibrium and spherical symmetry assumptions. Particularly, the total mass distribution was described by the so-called Navarro, Frank and White profile navarro . The measurements for each cluster were performed within radius in the reference CDM cosmology. This radius corresponds that one for which the mean enclosed mass density is 2500 times the critical density of the Universe at the redshift of the cluster (see Fig.1a).
-
•
40 X-ray GMF measurements from massive, dynamically relaxed galaxy clusters compiled by the Ref.mantz2014 . These authors significantly reduce systematic uncertainties compared to previous papers by incorporating a robust gravitational lensing calibration of the X-ray mass estimates. Moreover, as an unprecedented approach, the GMF measurements were obtained in spherical shells at radii near , rather than X-ray GMF integrated at all radii . This procedure excludes cluster centers and reduces the theoretical uncertainty in gas depletion from hydrodynamic simulations. As a result, the error bars of this sample are smaller than those in Ref.allen2008 (see Fig.1a).
III.2 Cosmic opacity independent data
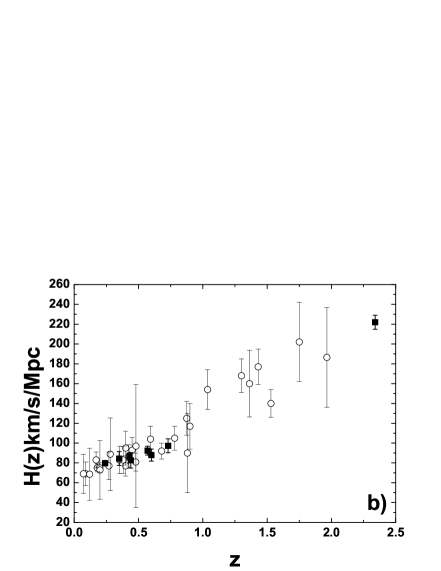
Here, we consider 38 measurements, namely, 30 from cosmic chronometers (see table 4 in Ref.moresco2016 ) plus 8 measurements from radial baryon acoustic oscillations (see Fig.1b). Briefly, the cosmic chronometers approach uses relative ages of the most massive and passively evolving galaxies to measure , from which is inferred. The method of getting ages of old passively evolving galaxies depends only on the detailed shape of the galaxy spectra but not on the galaxy luminosity, which turns this quantity independent on cosmic opacity444 We consider not to be strongly wavelength dependent in the optical band (see Refs.22 ; 23 ).. The 8 measurements from radial baryon acoustic oscillations can be found in Refs.gas ; xu ; blake ; samushia ; delu . A complete data table also can be found in Ref.shu . Recently these measurements of the Hubble parameter have been used to constrain several cosmological parameters simon ; stern ; chen2011 ; seik ; moresco ; Farooq ; moresco2016 ; moresco2016b . We considered in our analyses , (in ), obtained by the Planck collaboration for a flat CDM universe from a combination of temperature and lensing data of the cosmic microwave background Ade .
| Reference | Data set | Model | () | |
|---|---|---|---|---|
| avg2009 | 307 SNe Ia + 10 | flat CDM | ||
| avg2010 | 307 SNe Ia + 12 | flat CDM | ||
| HCA2013 | 581 SNe Ia + 28 | model independent | ||
| HB2014 | 581 SNe Ia + 19 | flat CDM | ||
| HB2014 | 59 GRB + 19 | flat CDM | ||
| HB2014 | 581 SNe Ia +19 | flat XCDM | ||
| HB2014 | 59 GRB + 19 | flat XCDM | ||
| Avg2016 | 740 SNe Ia + 19 | model independent | ||
| This paper | 40 + 38 | flat CDM | ||
| This paper | 42 + 38 | flat CDM |
IV Analyses and results
We obtain the constraints to the set of parameters , by evaluating the likelihood distribution function, , with
where , and are the errors associated to of the galaxy cluster data, measurements and prior (, in ), respectively. is obtained via , while is given by equation Eq.(3) and from Eq.(4). We marginalize on the parameter.
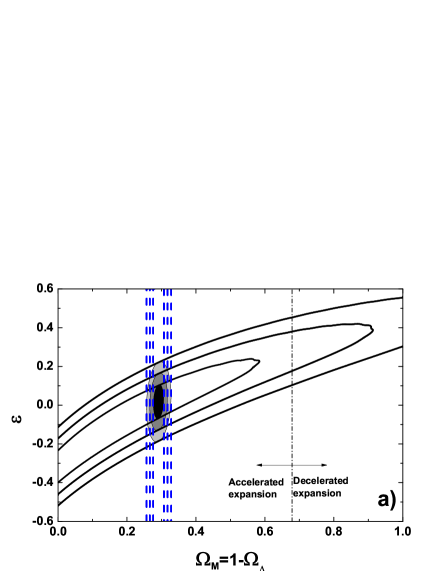
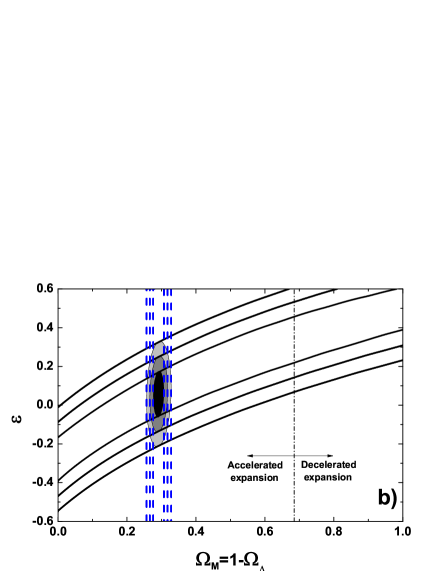
The Fig.(2) shows all the results from our analyses. The black solid contours in the Figs. (2a) and (2b) are the confidence intervals of , 6.17 and 11.82 on the () plane from analyses with the X-ray GMF samples present in the Refs. mantz2014 and allen2008 , respectively. From these results, it is very important to point out that, even considering the simple flat CDM model, the constraints on the parameter exclusively from X-ray GMF data depend strongly on the transparency cosmic assumption. This means that using only this kind of observation we can not constrain simultaneously the energy content of the flat CDM model and the parameter. In other words, there is a degeneracy between the and parameters. Moreover, a decelerated universe is allowed within 1.5 in Fig.(a) and within 1 in Fib.(b) (see the vertical black dashed-dot line). In both figures, the vertical blue lines correspond to results by using exclusively the data (the confidence intervals are for , 2 and 3). As one may see, the parameter is well constrained when the data are added in the analyses and, therefore, limits on can be found. In each figure, the results from the joint analysis by using X-ray GMF + are displayed by the filled contours.
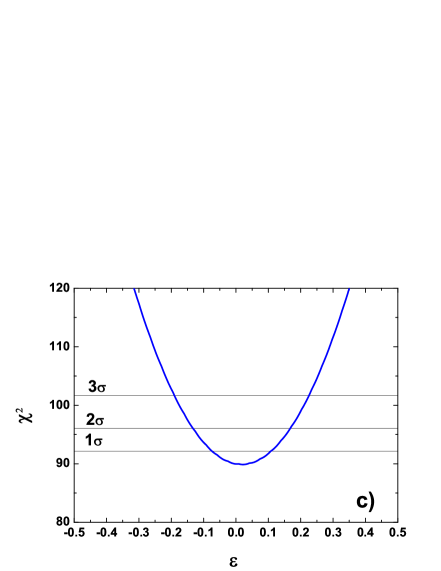
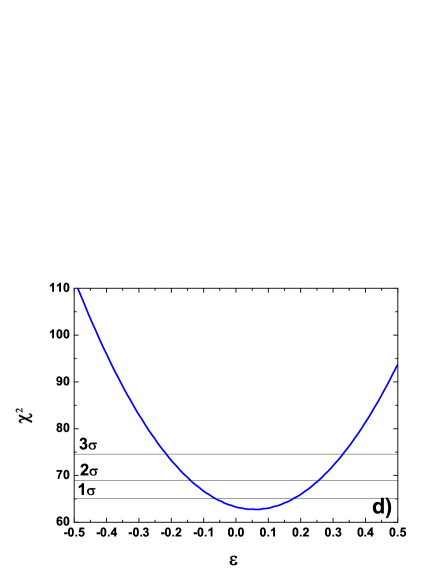
On the other hand, Figs. (2c) and (2d) show the values for by using the X-ray GMF samples from Ref.mantz2014 and Ref.allen2008 , respectively, jointly with data (marginalizing on ). The intervals found are (at ):
-
•
Fig.(2a): and .
-
•
Fig.(2b): and .
-
•
Fig.(2c): (by marginalizing on ).
-
•
Fig.(2d): (by marginalizing on ).
As one may see, although in this case we have , the results are in full agreement with a transparent universe (). Our value is in full agreement with that one from Planck results Ade .
Table 1 shows some recent constraints on the cosmic opacity by using approaches involving SNe Ia, gamma-ray bursts and observations as well as the results of the present paper. As commented earlier, the approach used in Refs.avg2009 ; avg2010 ; HB2014 is similar to this paper, but the bands of the electromagnetic spectrum explored were other, namely, optical and gamma-ray. On the other hand, the Refs.HCA2013 ; Avg2016 considered cosmological model independent approaches by using SNe Ia and data. As one may see, the results from different bands of the electromagnetic spectrum are in full agreement each other and no significant deviation from transparent universe is verified. However, these results do not rule out with high statistical significance yet.
V Conclusions
As it is largely known, cosmic opacity can mimic a dark energy behavior and its presence has been investigated along the years by different methods. Recently, type Ia supernovae and gamma ray bursts observations have been used along with cosmic expansion rate measurements, , to constrain possible departures from cosmic transparency. In this context, dependent and independent cosmological model analyses were performed. In this paper, by considering a flat CDM framework we showed how is possible use galaxy cluster X-ray gas mass fraction samples jointly with the most recent data to impose limits on cosmic opacity. We considered the prior in our analyses, namely: obtained by the Planck collaboration Ade .
Our results can be found in Fig.(2) and Table I, where quantifies the cosmic opacity and was parameterized by in our case. This kind of function is directly linked to a violation of the cosmic distance duality relation validity such as if is small and . As one may see from Table 1, we did not find any significant departure from cosmic transparency () and our results are in full agreement with previous studies where type Ia supernovae and gamma-ray burst observations were used in similar approaches. However, it is very important to stress that these analyses did not rule out with high statistical confidence level and additional tests are still required with forthcoming data. Moreover, from panels (a) and (b) in Fig.(2) it is possible to conclude that constraints on obtained from X-ray gas mass fraction test (black solid contours) depend strongly on the cosmic transparency hypothesis even if the simple flat CDM model is considered.
Acknowledgements.
RFLH acknowledges financial support from CNPq (No. 303734/2014-0). VCB is supported by São Paulo Research Foundation (FAPESP)/CAPES agreement under grant 2014/21098-1 and São Paulo Research Foundation under grant 2016/17271-5. KVRAS is supported by CAPES.References
- (1) F. Combes, NewAR 48, 583 (2004).
- (2) A. Conley et al., ApJ 664, L13 (2007).
- (3) B. Menard et al., MNRAS 405, 1025 (2010).
- (4) N. Imara, and A. Loeb, ApJL 816, L16 (2016).
- (5) R. McKinnon, P. Toorey, M. Vogelsberger, 457, 3775 (2016).
- (6) J. A. S. Lima, J. V. Cunha, and V. T. Zanchin, ApJL 742, L26 (2011).
- (7) D. H. Weinberg et al., Phys. Rep. 530, 87 (2013).
- (8) B. A. Basset, and M. Kunz, Phys. Rev. D 69, 101305 (2004).
- (9) B. Chen, and R. Kantowski, Phys. Rev. D 79, 104007 (2009a).
- (10) B. Chen, and R. Kantowski, Phys. Rev. D 80, 044019 (2009b).
- (11) Z. Li et al., Phys. Rev. D 87, 10 (2013).
- (12) X. Xie, S. Shen, Z. Shao, J. Yin, ApJ 802, L16 (2015).
- (13) J. P. U. Fynbo, APJS 204, 1 (2013).
- (14) N. Imara, A. Loeb, ApJ 825, 2 (2016).
- (15) A. Avgoustidis, L. Verde, and R. Jimenez, JCAP 0906, 012 (2009).
- (16) A. Avgoustidis, C. Burrage, J. Redondo, L. Verde, and R. Jimenez, JCAP 1010, 024 (2010).
- (17) J. Jaeckel, and A. Ringwald, Ann. Rev. Nucl. Part. Sci. 60, 405 (2010).
- (18) P. Tiwari, PRD, 95, 2 (2017).
- (19) R. F. L. Holanda, J. C. Carvalho, and J. S. Alcaniz, JCAP 1304, 027 (2013).
- (20) K.Liao, A. Avgoustidis, and Z. Li, Phys. Rev. D 92, 123539 (2015).
- (21) R. F. L. Holanda, and V. C. Busti, Phys. Rev. D 89, 103517 (2014).
- (22) J. F. Jesus, R. F. L. Holanda, M. A. Dantas, arXiv:1605.01342 (2016).
- (23) E. L. Wright, ApJ 250, 1 (1981).
- (24) L. Corrales, F. Paerels, ApJ 751, 93 (2012).
- (25) B. Ménard, R. Scranton, M. Fukugita and G. Richards, MNRAS 405, 1025 (2010)
- (26) S. Sasaki, PASJ 48, L119 (1996).
- (27) S. W. Allen et al., MNRAS 334, L11 (2002).
- (28) J. A. S. Lima, J. V. Cunha, and J. S. Alcaniz, Phys. Rev. D 68, 023510 (2003).
- (29) S. J. La Roque et al., Astrophys. J. 652, 917 (2006).
- (30) S. W. Allen et al., MNRAS 383, 879 (2008).
- (31) S. Ettori et al., A&A 501, 61 (2009).
- (32) A. B. Mantz et al., MNRAS 440, 2077 (2014).
- (33) T. F. Lagana et al., A&A 555, A66 (2013).
- (34) S. Planelles et al., MNRAS 431, 1487 (2013).
- (35) N. Battaglia, J. R. Bond, C. Pfrommer, J. L. Sievers, ApJ, 777, 123 (2013).
- (36) K. Nelson, et al., ApJ, 782, 107, (2014).
- (37) R. S. Goncalves, R. F. L. Holanda, and J. S. Alcaniz, MNRAS 420, L43-L47 (2012).
- (38) R. F. L. Holanda, R. S. Goncalves, and J. S. Alcaniz, JCAP 1206, 022 (2012).
- (39) S. Santos-da-Costa, V. C. Busti, R. F. L. Holanda, JCAP 10, 061 (2015).
- (40) X. Wang, RAA 13, 1013 (2013).
- (41) A. Shafieloo, S. Majumdar, V. Sahni, A. A. Starobinsky, JCAP 04, 042 (2013).
- (42) I. M. H. Etherington, Phil. Mag. 15, 761 (1933); reprinted in Gen. Rel. Grav. 39, 1055 (2007).
- (43) R. F. L. Holanda, V. C. Busti, J. S. Alcaniz, JCAP 02, 054 (2016).
- (44) A. G. Riess et al., ApJ 826, 56 (2016).
- (45) P. A. R. Ade et al., A&A 594, A13 (2016).
- (46) J.F. Navarro, C.S. Frenk, S.D.M. White, ApJ 275, 720 (1995); J.F. Navarro, C.S. Frenk, S.D.M. White, ApJ 490, 493 (1997).
- (47) M. Moresco et al., JCAP 05, 014 (2016).
- (48) E. Mortsell, and A. Goobar, Journal of Cosmology and Astro-Particle Physics 9, 9 (2003).
- (49) E. Mortsell, and A. Goobar, Journal of Cosmology and Astro-Particle Physics 4, 3 (2003).
- (50) E. Gaztañaga, A. Cabré, L. Hui, MNRAS 399, 1663 (2009).
- (51) X. Xu, A. J. Cuesta, N. Padmanabhan, D. J. Eisenstein, and C. K. McBride, Mon. Not. R. Astron. Soc. 431, 2834 (2013).
- (52) C. Blake, S. Brough, and M. Colless et al., Mon. Not. R. Astron. Soc. 425, 405 (2012).
- (53) L. Samushia, B. A. Reid, and M. White et al., Mon. Not. R. Astron. Soc. 429, 1514 (2013).
- (54) T. Delubac, J. E. Bautista, and N. G. Busca et al., Astron. Astrophys. 574, A59 (2015).
- (55) S. L. Cao et al., arXiv:1704.01774 (2017).
- (56) J. Simon, L. Verde, and R. Jimenez, Phys. Rev. D 71, 123001 (2005).
- (57) D. Stern et al., Astrophys. J. Supp. Ser. 188, 280 (2010).
- (58) G. Chen, and B. Ratra, PASP 123, 1127 (2011).
- (59) M. Seikel, S. Yahya, R. Maartens, and C. Clarkson, Phys. Rev. D 86, 083001 (2012).
- (60) M. Moresco et al., J. Cosmol. Astropart. Phys. 08, 006 (2012).
- (61) O. Farooq, D. Mania, and B. Ratra, Astrophys. J. 764, 138 (2013).
- (62) M. Moresco et al., JCAP 12, 039 (2016).
- (63) K. Liao, A. Avgoustidis, Z. Li, Phys. Rev. D 92, 123539 (2015).