Observation of two types of anyons in the Kitaev honeycomb magnet
Abstract
Quantum spin liquid is a disordered magnetic state with fractional spin excitations. Its clearest example is found in an exactly solved Kitaev honeycomb model where a spin flip fractionalizes into two types of anyons, quasiparticles that are neither fermions nor bosons: a pair of gauge fluxes and a Majorana fermion. Here we demonstrate this kind of fractionalization in the Kitaev paramagnetic state of the honeycomb magnet -RuCl3. The spin-excitation gap measured by nuclear magnetic resonance consists of the predicted Majorana fermion contribution following the cube of the applied magnetic field, and a finite zero-field contribution matching the predicted size of the gauge-flux gap. The observed fractionalization into gapped anyons survives in a broad range of temperatures and magnetic fields despite inevitable non-Kitaev interactions between the spins, which are predicted to drive the system towards a gapless ground state. The gapped character of both anyons is crucial for their potential application in topological quantum computing.
In many-body systems dominated by strong fluctuations, an excitation with an integer quantum number can break up into exotic quasiparticles with fractional quantum numbers. Well known examples include fractionally charged quasiparticles in fractional quantum Hall effect dePicciotto_1997 , spin-charge separation in one-dimensional conductors Jompol_2009 , and magnetic monopoles in spin ice Castelnovo_2008 . A major hunting ground for novel fractional quasiparticles are disordered magnetic states of interacting spin- systems governed by strong quantum fluctuations, called quantum spin liquids (QSLs). Most of their models predict that a spin-flip excitation fractionalizes into a pair of spinons, each carrying spin Balents_2010 ; Savary_2017 . Even more interesting in this respect is the Kitaev model Kitaev_2006 of spins on a two-dimensional (2D) honeycomb lattice with nearest neighbors interacting through an Ising exchange, whose axis depends on the bond direction, as shown in Fig. 1(a). This is one of a few exactly solved 2D models supporting a QSL ground state. According to the solution, a spin flip fractionalizes into a pair of bosonic gauge fluxes and a Majorana fermion Kitaev_2006 ; Baskaran_2007 . As both types of quasiparticles behave as anyons, i.e., neither bosons nor fermions, under exchange, they could be used for decoherence-free topological quantum computation Kitaev_2006 . The experimental detection of such anyons is thus the primary goal of current QSL research.
As fractional quasiparticles are always created in groups, their common signature is a continuous spin-excitation spectrum, observed in recent QSL candidates on the kagome and triangular lattices Han_2012 ; Paddison_2016 , instead of sharp magnon modes found in ordered magnets. A Kitaev QSL also exhibits this feature Knolle_2014 ; Nasu_2016 , as well as additional, specific signatures, all related to the fact that fractionalization in this case leads to different quasiparticles. First, the fractionalization proceeds in two steps, with both types of quasiparticles releasing their entropy at different temperatures Nasu_2015 . Second, although Majorana fermions themselves are gapless in zero magnetic field, the response of the QSL to a spin flip is gapped due to the inevitable simultaneous creation of a pair of gapped gauge fluxes Knolle_2014 . And third, in the presence of an external magnetic field, the Majorana fermions also acquire a gap, which is predicted to grow with the characteristic third power of the field in the low-field region Kitaev_2006 ; Jiang_2011 ; Nasu_2017 . Currently, -RuCl3 stands as the most promising candidate for the realization of the Kitaev QSL Nasu_2016 ; Sandilands_2015 ; Banerjee_2016 ; Banerjee_2017 ; Do_2017 . Among the listed signatures, a spin-excitation continuum was observed by Raman spectroscopy Sandilands_2015 ; Nasu_2016 and inelastic neutron scattering Banerjee_2016 ; Banerjee_2017 ; Do_2017 , and the two-step thermal fractionalization was confirmed by specific-heat measurements Do_2017 , all in zero field. However, an application of a finite field, which should affect the gaps of both types of quasiparticles differently, is crucial to identify them. Using nuclear magnetic resonance (NMR), we determine the field dependence of the spin-excitation gap shown in Fig. 1(c), which indeed exhibits a finite zero-field value predicted for gauge fluxes and the cubic growth predicted for Majorana fermions. This result clearly demonstrates the fractionalization of a spin flip into two types of anyons in -RuCl3.
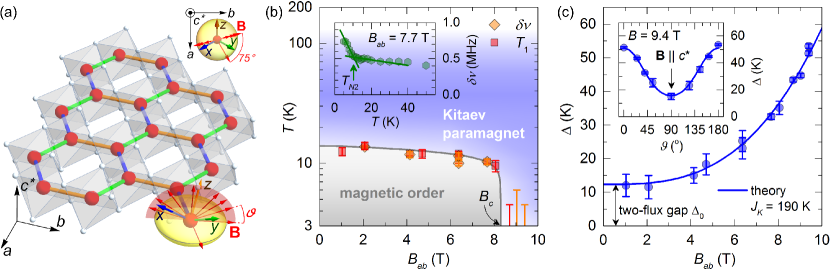
-RuCl3 is structurally related to the other two Kitaev QSL candidates, Na2IrO3 Choi_2012 and -Li2IrO3 Singh_2012 . All three are layered Mott insulators based on the edge-sharing octahedral units, RuCl6 and IrO6 [Fig. 1(a)], respectively, and driven by strong spin-orbit coupling Plumb_2014 , which together lead to a dominant Kitaev exchange coupling between the effective spins of Ru3+ and Ir4+ ions, respectively Jackeli_2009 . A monoclinic distortion of the IrO6 octahedra in both iridate compounds results in the presence of non-Kitaev exchange interactions between the spins, which lead to the low-temperature magnetic ordering and thus prevent the realization of the QSL ground state. Judging by the lower transition temperature, these interactions are smaller in -RuCl3 Kubota_2015 ; Sears_2015 ; Majumder_2015 ; Cao_2016 . Signatures of fractional quasiparticles should thus be sought in a region of the phase diagram outside the magnetically ordered phase, at temperatures where the Kitaev physics is not yet destroyed by thermal fluctuations. This is the Kitaev paramagnetic region [Fig. 1(b)] extending to a relatively high temperature around K where the nearest-neighbor spin correlations vanish Do_2017 .
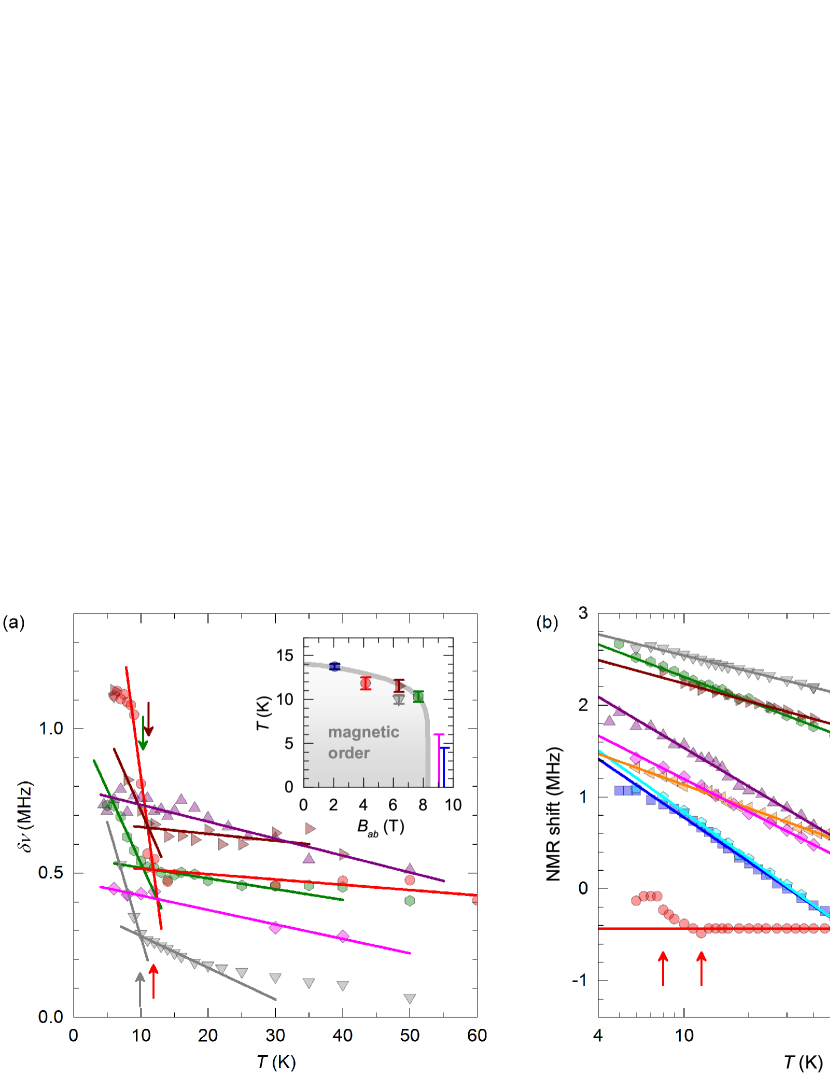
The boundary of the magnetically ordered phase measured in a large -RuCl3 single crystal Supplemental using 35Cl NMR is displayed in Fig. 1(b). Magnetic properties of -RuCl3 are known to be highly anisotropic Johnson_2015 ; Majumder_2015 , mainly because of the anisotropic Ru3+ -tensor [Fig. 1(a)] with and Yadav_2016 . We exploit this anisotropy to scan the phase diagram by varying the direction of the applied fixed field, instead of varying the magnitude of the field applied in the plane Johnson_2015 . Namely, as the Zeeman term contains the product , a magnetic field applied at an angle from the plane is equivalent to the effective field applied in the plane, where is the direction-dependent -factor. This is valid if the studied underlying physics is close to isotropic, a condition to be verified at the end. As shown in the inset of Fig. 1(b), we determine the transition temperature as the onset of NMR line broadening Supplemental monitored on the dominant NMR peak [inset of Fig. 2(b)]. The obtained phase boundary extending up to the critical field T matches the result of a recent reference study Johnson_2015 . The observed transition temperature of around K near zero field is consistent with a considerable presence of the two-layer stacking in the monoclinic crystal structure [Fig. 1(a)], in addition to the three-layer stacking, which is characterized by a lower transition temperature of around K in zero field Banerjee_2016 ; Cao_2016 . As our study is focused on the Kitaev paramagnetic region [Fig. 1(b)] governed by the physics of individual layers, it is not affected by the particular stacking type.
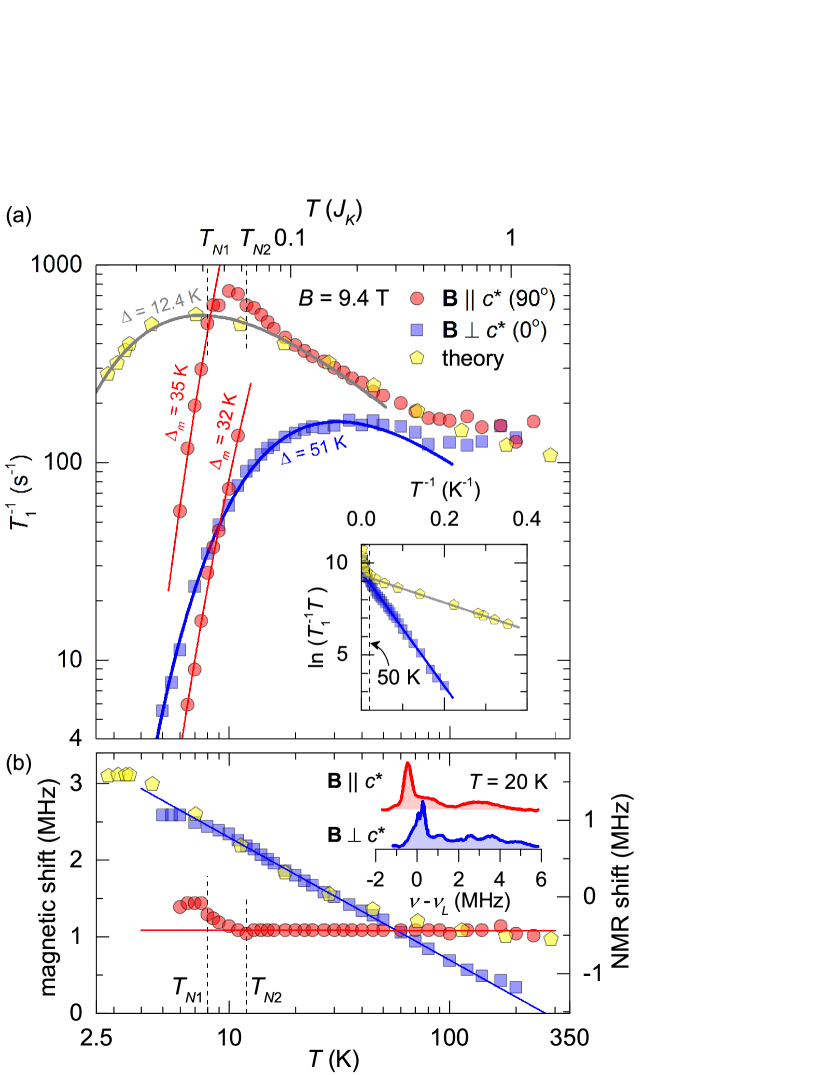
To detect and monitor the spin-excitation gap as a function of the magnetic field, we use the NMR spin-lattice relaxation rate , which directly probes the low-energy limit of the local spin-spin correlation function and thus offers a direct access to the spin-excitation gap. Fig. 2(a) shows the 35Cl datasets taken on the dominant NMR peak [inset of Fig. 2(b)] in T for two magnetic field orientations. A noticeable feature of the dataset for (i.e., in the plane, T) is a broad maximum around K, followed by a steep decrease towards lower temperatures. In the dataset for , such a feature would apparently develop at a lower temperature, if the dataset was not disrupted by the phase transition at K [in a field of T, Fig. 2(b)]. Instead, two components develop below , both exhibiting a steep drop, one below and the other one below K. These two phase transitions were observed before and ascribed to the presence of and stackings, respectively Banerjee_2016 ; Cao_2016 . The analysis of the data below and using the expression valid for gapped magnon excitations in the 3D ordered state Supplemental gives comparable values of the magnon gap K and K, respectively, implying the same low-energy physics in both cases. The obtained values are compatible with the gap of K determined by inelastic neutron scattering Banerjee_2016 ; Ran_2017 .
To access the key information held by the datasets in the Kitaev paramagnetic state, we first observe in Fig. 2(a) that the dataset for below K exhibits the same shape as the theoretical dataset numerically calculated for the ferromagnetic Kitaev model in zero field Supplemental ; Yoshitake_2016 . A characteristic broad maximum of the latter is a sign of thermally excited pairs of gauge fluxes over the two-flux gap Yoshitake_2016 , whose exact value amounts to Kitaev_2006 ; Knolle_2014 where is the Kitaev exchange coupling. As shown in Fig. 2(a), a large part of the theoretical dataset, up to around , well above the maximum, can be excellently described by the phenomenological expression
| (1) |
where is set to in order for to match the required value of . This expression has a useful property: its maximum appears at a temperature , which allows for a simple estimate of directly from the dataset. The ( T) dataset up to K is excellently reproduced by Eq. (1) using K [Fig. 2(a)]. The validity of Eq. (1) in this case and in the case of the theoretical dataset is clearly demonstrated in the inset of Fig. 2(a), which shows the resulting linear dependence of on below K. Meanwhile, even in the absence of the characteristic maximum, the ( T) dataset above K, i.e., slightly above , and up to high temperatures matches the theoretical zero-field dataset using the value K determined by inelastic neutron scattering, also based on the ferromagnetic Kitaev model Do_2017 . This means that the gap for T is already close to the zero-field value K. A large difference between the two determined gaps points to a significant variation in the Kitaev paramagnetic state. Finally, the temperature-independent part of both datasets above K indicates a crossover into the classical paramagnetic state Moriya_1956 , in line with the result of Ref. Do_2017 .
The expression given by Eq. (1) is not merely phenomenological, but reveals the presence of gapped fractional spin excitations. Similar expressions are obtained for the relaxation due to gapped magnons in magnetic insulators at low temperatures Supplemental . In this case, the prefactor is replaced by a more general originating from the magnon density of states , which depends on the dimensionality , while is generally the number of magnons involved in the process. For (single-magnon scattering) and a quadratic dispersion relation for magnons, one obtains and thus , while higher (multi-magnon scattering) lead to even higher powers Supplemental . At higher temperatures , the effective changes, but always remains positive. As the very unusual in Eq. (1) valid for cannot be obtained for magnons, fractional spin excitations should be involved. This is furthermore supported by a fractional in Eq. (1), implying that fractions of a spin-flip excitation are involved in the relaxation process. In contrast to this unusual gapped behavior, the temperature dependence of the local susceptibility monitored by the 35Cl NMR shift in Fig. 2(b) is monotonic over the whole covered temperature range, as predicted for the ferromagnetic Kitaev model Yoshitake_2016 . Such a dichotomy between the two observables is a direct sign of spin fractionalization, as different fractional quasiparticles enter the two observables in different ways Yoshitake_2016 .
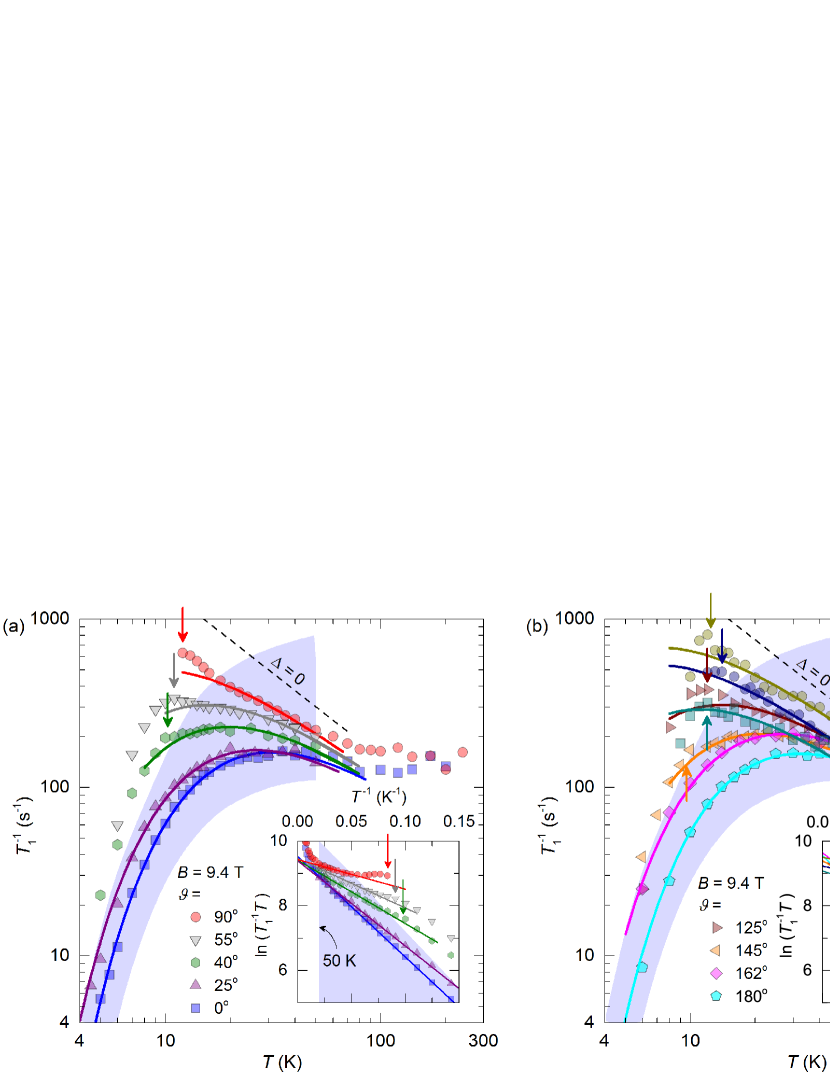
To obtain the spin-excitation gap as a function of in Fig. 1(c), the datasets in Fig. 3 taken in magnetic fields of different directions and magnitudes are fitted to Eq. (1) in the temperature range of the Kitaev paramagnetic phase. As the curve defined by is steeper than any dataset in this range, the obtained excitation gaps are apparently all nonzero. The inset of Fig. 1(c) showing the symmetric dependence around in T, where traverses nonequivalent directions with respect to the Kitaev axes on both sides [inset of Fig. 1(a)], demonstrates that the underlying physics is indeed isotropic as assumed when introducing . The obtained in Fig. 1(c) can be perfectly reproduced as a sum of two terms: the two-flux gap and the gap acquired by Majorana fermions in a weak magnetic field, predicted to be proportional to the cube of the field Kitaev_2006 ; Jiang_2011 ; Nasu_2017 ; Supplemental ,
| (2) |
using K Do_2017 to evaluate , as before, while is the field in kelvin units, is the Boltzmann constant, the Bohr magneton, and (leading to the best fit) accounts for the sum over the excited states in the third-order perturbation theory, which is the origin of the term Kitaev_2006 . This result demonstrates that a spin-flip excitation in -RuCl3 indeed fractionalizes into a gauge-flux pair and a Majorana fermion.
Focusing on the Kitaev paramagnetic region in the phase diagram of -RuCl3 in Fig. 1(b) is essential for our observation of two types of anyons. Instead, other recent experimental studies focused on the low-temperature region above , observing the spin-excitation continuum Banerjee_2017_2 with either a gapless behavior Leahy_2017 ; Zheng_2017 or the gap opening linearly with Baek_2017 ; Sears_2017 ; Hentrich_2017 ; Ponomaryov_2017 , but without a definite conclusion about the identity of the involved quasiparticles. Such an ambiguous behavior likely originates in the presence of additional, smaller non-Kitaev interactions between the spins Banerjee_2016 ; Yadav_2016 ; Winter_2016 ; Ran_2017 , whose role should be pronounced particularly at low temperatures and which are indeed predicted to drive the system towards a gapless QSL ground state Song_2016 . Our result shows that spin fractionalization into two types of anyons is robust against these interactions in a broad range of temperatures and magnetic fields. This is the main practical advantage of -RuCl3 with respect to all other anyon realizations, such as the fractional quantum Hall effect in 2D heterostructures dePicciotto_1997 or hybrid nanowire devices Mourik_2012 , where anyons are observed only at extremely low temperatures and at certain field values. Our discovery thus establishes -RuCl3 as a unique platform for future investigations of anyons and braiding operations on them, which form the functional basis of a topological quantum computer Kitaev_2006 .
Acknowledgements.
The work was partly supported by the Slovenian ARRS program No. P1-0125 and project No. PR-07587.References
- (1) R. de-Picciotto, M. Reznikov, M. Heiblum, V. Umansky, G. Bunin, and D. Mahalu, Direct observation of a fractional charge, Nature 389, 162 (1997).
- (2) Y. Jompol, C. J. B. Ford, J. P. Griffiths, I. Farrer, G. A. C. Jones, D. Anderson, D. A. Ritchie, T. W. Silk, and A. J. Schofield, Probing Spin-Charge Separation in a Tomonaga-Luttinger Liquid, Science 325, 597 (2009).
- (3) C. Castelnovo, R. Moessner, and S. L. Sondhi, Magnetic monopoles in spin ice, Nature 451, 42 (2008).
- (4) L. Balents, Spin liquids in frustrated magnets, Nature 464, 199 (2010).
- (5) L. Savary and L. Balents, Quantum spin liquids: a review, Rep. Prog. Phys. 80, 016502 (2017).
- (6) A. Kitaev, Anyons in an exactly solved model and beyond, Ann. Phys. 321, 2 (2006).
- (7) G. Baskaran, S. Mandal, and R. Shankar, Exact Results for Spin Dynamics and Fractionalization in the Kitaev Model, Phys. Rev. Lett. 98, 247201 (2007).
- (8) T.-H. Han, J. S. Helton, S. Chu, D. G. Nocera, J. A. Rodriguez-Rivera, C. Broholm, and Y. S. Lee, Fractionalized excitations in the spin-liquid state of a kagome-lattice antiferromagnet, Nature 492, 406 (2012).
- (9) Y. Shen, Y.-D. Li, H. Wo, Y. Li, S. Shen, B. Pan, Q. Wang, H. C. Walker, P. Steffens, M. Boehm, Y. Hao, D. L. Quintero-Castro, L. W. Harriger, M. D. Frontzek, L. Hao, S. Meng, Q. Zhang, G. Chen, and J. Zhao, Evidence for a spinon Fermi surface in a triangular-lattice quantum-spin-liquid candidate, Nature 540, 559 (2016).
- (10) J. A. M. Paddison, M. Daum, Z. Dun, G. Ehlers, Y. Liu, M. B. Stone, H. Zhou, and M. Mourigal, Continuous excitations of the triangular-lattice quantum spin liquid YbMgGaO4, Nature Phys. 13, 117 (2017).
- (11) J. Knolle, D. L. Kovrizhin, J. T. Chalker, and R. Moessner, Dynamics of a two-dimensional quantum spin liquid: signatures of emergent Majorana fermions and fluxes, Phys. Rev. Lett. 112, 207203 (2014).
- (12) J. Knolle, D. L. Kovrizhin, J. T. Chalker, and R. Moessner, Dynamics of fractionalization in quantum spin liquids, Phys. Rev. B 92, 115127 (2015).
- (13) J. Nasu, J. Knolle, D. L. Kovrizhin, Y. Motome, and R. Moessner, Fermionic response from fractionalization in an insulating two-dimensional magnet, Nature Phys. 12, 912 (2016).
- (14) J. Nasu, M. Udagawa, and Y. Motome, Thermal fractionalization of quantum spins in a Kitaev model: Temperature-linear specific heat and coherent transport of Majorana fermions, Phys. Rev. B 92, 115122 (2015).
- (15) Y. Yamaji, T. Suzuki, T. Yamada, S. Suga, N. Kawashima, and M. Imada, Clues and criteria for designing a Kitaev spin liquid revealed by thermal and spin excitations of the honeycomb iridate Na2IrO3, Phys. Rev. B 93, 174425 (2016).
- (16) H.-C. Jiang, Z.-C. Gu, X.-L. Qi, and S. Trebst, Possible proximity of the Mott insulating iridate Na2IrO3 to a topological phase: Phase diagram of the Heisenberg-Kitaev model in a magnetic field, Phys. Rev. B 83, 245104 (2011).
- (17) J. Nasu, J. Yoshitake, and Y. Motome, Thermal Transport in the Kitaev Model, arXiv:1703.10395 (2017).
- (18) L. J. Sandilands, Y. Tian, K. W. Plumb, Y.-J. Kim, and K. S. Burch, Scattering Continuum and Possible Fractionalized Excitations in -RuCl3, Phys. Rev. Lett. 114, 147201 (2015).
- (19) A. Banerjee, C. A. Bridges, J.-Q. Yan, A. A. Aczel, L. Li, M. B. Stone, G. E. Granroth, M. D. Lumsden, Y. Yiu, J. Knolle, S. Bhattacharjee, D. L. Kovrizhin, R. Moessner, D. A. Tennant, D. G. Mandrus, and S. E. Nagler, Proximate Kitaev quantum spin liquid behaviour in a honeycomb magnet, Nature Mat. 15, 733 (2016).
- (20) A. Banerjee, J. Yan, J. Knolle, C. A. Bridges, M. B. Stone, M. D. Lumsden, D. G. Mandrus, D. A. Tennant, R. Moessner, and S. E. Nagler, Neutron scattering in the proximate quantum spin liquid -RuCl3, Science 356, 1055 (2017).
- (21) S.-H. Do, S.-Y. Park, J. Yoshitake, J. Nasu, Y. Motome, Y. S. Kwon, D. T. Adroja, D. J. Voneshen, K. Kim, T.-H. Jang, J.-H. Park, K.-Y. Choi, and S. Ji, Incarnation of Majorana Fermions in Kitaev Quantum Spin Lattice, arXiv:1703.01081 (2017).
- (22) S. K. Choi, R. Coldea, A. N. Kolmogorov, T. Lancaster, I. I. Mazin, S. J. Blundell, P. G. Radaelli, Yogesh Singh, P. Gegenwart, K. R. Choi, S.-W. Cheong, P. J. Baker, C. Stock, and J. Taylor, Spin Waves and Revised Crystal Structure of Honeycomb Iridate Na2IrO3, Phys. Rev. Lett. 108, 127204 (2012).
- (23) Y. Singh, S. Manni, J. Reuther, T. Berlijn, R. Thomale, W. Ku, S. Trebst, and P. Gegenwart, Relevance of the Heisenberg-Kitaev Model for the Honeycomb Lattice Iridates IrO3, Phys. Rev. Lett. 108, 127203 (2012).
- (24) K. W. Plumb, J. P. Clancy, L. J. Sandilands, V. V. Shankar, Y. F. Hu, K. S. Burch, H.-Y. Kee, and Y.-J. Kim, -RuCl3: A spin-orbit assisted Mott insulator on a honeycomb lattice, Phys. Rev. B 90, 041112(R) (2014).
- (25) G. Jackeli and G. Khaliullin, Mott insulators in the strong spin-orbit coupling limit: from Heisenberg to a quantum compass and Kitaev models, Phys. Rev. Lett. 102, 017205 (2009).
- (26) J. Chaloupka, G. Jackeli, and G. Khaliullin, Kitaev-Heisenberg model on a honeycomb lattice: possible exotic phases in iridium oxides IrO3, Phys. Rev. Lett. 105, 027204 (2010).
- (27) S. Trebst, Kitaev Materials, arXiv:1701.07056 (2017).
- (28) Y. Kubota, H. Tanaka, T. Ono, Y. Narumi, and K. Kindo, Successive magnetic phase transitions in -RuCl3: -like frustrated magnet on the honeycomb lattice, Phys. Rev. B 91, 094422 (2015).
- (29) J. A. Sears, M. Songvilay, K. W. Plumb, J. P. Clancy, Y. Qiu, Y. Zhao, D. Parshall, and Y.-J. Kim, Magnetic order in -RuCl3: A honeycomb-lattice quantum magnet with strong spin-orbit coupling, Phys. Rev. B 91, 144420 (2015).
- (30) M. Majumder, M. Schmidt, H. Rosner, A. A. Tsirlin, H. Yasuoka, and M. Baenitz, Anisotropic Ru3+ magnetism in the -RuCl3 honeycomb system: Susceptibility, specific heat, and zero-field NMR, Phys. Rev. B 91, 180401(R) (2015).
- (31) H. B. Cao, A. Banerjee, J.-Q. Yan, C. A. Bridges, M. D. Lumsden, D. G. Mandrus, D. A. Tennant, B. C. Chakoumakos, and S. E. Nagler, Low-temperature crystal and magnetic structure of -RuCl3, Phys. Rev. B 93, 134423 (2016).
- (32) S.-Y. Park, S.-H. Do, K.-Y. Choi, D. Jang, T.-H. Jang, J. Schefer, C.-M. Wu, J. S. Gardner, J. M. S. Park, J.-H. Park, and S. Ji, Emergence of the Isotropic Kitaev Honeycomb Lattice with Two-dimensional Ising Universality in -RuCl3, arXiv:1609.05690 (2016).
- (33) See Supplemental Material.
- (34) R. D. Johnson, S. C. Williams, A. A. Haghighirad, J. Singleton, V. Zapf, P. Manuel, I. I. Mazin, Y. Li, H. O. Jeschke, R. Valentí, and R. Coldea, Monoclinic crystal structure of -RuCl3 and the zigzag antiferromagnetic ground state, Phys. Rev. B 92, 235119 (2015).
- (35) R. Yadav, N. A. Bogdanov, V. M. Katukuri, S. Nishimoto, J. van den Brink, and L. Hozoi, Kitaev exchange and field-induced quantum spin-liquid states in honeycomb -RuCl3, Sci. Rep. 6, 37925 (2016).
- (36) S.-H. Baek, S.-H. Do, K.-Y. Choi, Y. S. Kwon, A. U. B. Wolter, S. Nishimoto, J. van den Brink, and B. Büchner, Evidence for a Field-induced Quantum Spin Liquid in -RuCl3, Phys. Rev. Lett. 119, 037201 (2017).
- (37) J. Zheng, K. Ran, T. Li, J. Wang, P. Wang, B. Liu, Z. Liu, B. Normand, J. Wen, and W. Yu, Gapless Spin Excitations in the Field-Induced Quantum Spin Liquid Phase of -RuCl3, arXiv:1703.08474 (2017).
- (38) M. Horvatić and C. Berthier, ”NMR Studies of Low-Dimensional Quantum Antiferromagnets,” in C. Berthier, L. P. Levy, and G. Martinez, High Magnetic Fields: Applications in Condensed Matter Physics and Spectroscopy (Springer-Verlag, Berlin, 2002), p. 200.
- (39) A. W. Kinross, M. Fu, T. J. Munsie, H. A. Dabkowska, G. M. Luke, S. Sachdev, and T. Imai, Evolution of Quantum Fluctuations Near the Quantum Critical Point of the Transverse Field Ising Chain System CoNb2O6, Phys. Rev. X 4, 031008 (2014).
- (40) K. Ran, J. Wang, W. Wang, Z.-Y. Dong, X. Ren, S. Bao, S. Li, Z. Ma, Y. Gan, Y. Zhang, J. T. Park, G. Deng, S. Danilkin, S.-L. Yu, J.-X. Li, and J. Wen, Spin-Wave Excitations Evidencing the Kitaev Interaction in Single Crystalline -RuCl3, Phys. Rev. Lett. 118, 107203 (2017).
- (41) T. Moriya, Nuclear Magnetic Relaxation in Antiferromagnetics, Prog. Theor. Phys. 16, 23 (1956).
- (42) J. Yoshitake, J. Nasu, and Y. Motome, Fractional Spin Fluctuations as a Precursor of Quantum Spin Liquids: Majorana Dynamical Mean-Field Study for the Kitaev Model, Phys. Rev. Lett. 117, 157203 (2016).
- (43) J. Yoshitake, J. Nasu, Y. Kato, and Y. Motome, Majorana dynamical mean-field study of spin dynamics at finite temperatures in the honeycomb Kitaev model, arXiv:1704.02707 (2017).
- (44) S. Mukhopadhyay, M. Klanjšek, M. S. Grbić, R. Blinder, H. Mayaffre, C. Berthier, M. Horvatić, M. A. Continentino, A. Paduan-Filho, B. Chiari, and O. Piovesana, Quantum-Critical Spin Dynamics in Quasi-One-Dimensional Antiferromagnets, Phys. Rev. Lett. 109, 177206 (2012).
- (45) D. Beeman and P. Pincus, Nuclear Spin-Lattice Relaxation in Magnetic Insulators, Phys. Rev. 166, 359 (1968).
- (46) A. Banerjee, P. Lampen-Kelley, J. Knolle, C. Balz, A. A. Aczel, B. Winn, Y. Liu, D. Pajerowski, J.-Q. Yan, C. A. Bridges, A. T. Savici, B. C. Chakoumakos, M. D. Lumsden, D. A. Tennant, R. Moessner, D. G. Mandrus, and S. E. Nagler, Excitations in the field-induced quantum spin liquid state of -RuCl3, arXiv:1706.07003 (2017).
- (47) I. A. Leahy, C. A. Pocs, P. E. Siegfried, D. Graf, S.-H. Do, K.-Y. Choi, B. Normand, and M. Lee, Anomalous Thermal Conductivity and Magnetic Torque Response in the Honeycomb Magnet -RuCl3, Phys. Rev. Lett. 118, 187203 (2017).
- (48) J. A. Sears, Y. Zhao, Z. Xu, J. W. Lynn, and Y.-J. Kim, Phase diagram of -RuCl3 in an in-plane magnetic field, Phys. Rev. B 95, 180411(R) (2017).
- (49) R. Hentrich, A. U. B. Wolter, X. Zotos, W. Brenig, D. Nowak, A. Isaeva, T. Doert, A. Banerjee, P. Lampen-Kelley, D. G. Mandrus, S. E. Nagler, J. Sears, Y.-J. Kim, B. Büchner, and C. Hess, Large field-induced gap of Kitaev-Heisenberg paramagnons in -RuCl3, arXiv:1703.08623 (2017).
- (50) A. N. Ponomaryov, E. Schulze, J. Wosnitza, P. Lampen-Kelley, A. Banerjee, J.-Q. Yan, C. A. Bridges, D. G. Mandrus, S. E. Nagler, A. K. Kolezhuk, and S. A. Zvyagin, Direct observation of the field-induced gap in the honeycomb-lattice material -RuCl3, arXiv:1706.07240 (2017).
- (51) S. M. Winter, Y. Li, H. O. Jeschke, and R. Valentí, Challenges in design of Kitaev materials: Magnetic interactions from competing energy scales, Phys. Rev. B 93, 214431 (2016).
- (52) X.-Y. Song, Y.-Z. You, and L. Balents, Low-Energy Spin Dynamics of the Honeycomb Spin Liquid Beyond the Kitaev Limit, Phys. Rev. Lett. 117, 037209 (2016).
- (53) V. Mourik, K. Zuo, S. M. Frolov, S. R. Plissard, E. P. A. M. Bakkers, and L. P. Kouwenhoven, Signatures of Majorana Fermions in Hybrid Superconductor-Semiconductor Nanowire Devices, Science 336, 1003 (2012).
- (54) A. Abragam, Principles of Nuclear Magnetism, Oxford University Press, Oxford (2011).
I Supplemental material
I.1 Crystal growth
Crystals of -RuCl3 were synthesized from anhydrous RuCl3 (Strem Chemicals). The starting material was heated in vacuum to ∘C for one day to remove volatile impurities. In the next step, the powder was sealed in a silica ampoule under vacuum and heated to ∘C in a tubular furnace. The tip of the ampoule was kept at lower temperature and the material sublimed to the colder end during one week. Phase pure -RuCl3 (with a high-temperature phase of crystal structure) was obtained as thin crystalline plates. The residual in the hot part of the ampoule was black RuO2 powder. The purified -RuCl3 was sublimed for the second time in order to obtain bigger crystal plates. The phase and purity of the compounds was verified by powder X-ray diffraction. All handling of the material was done under strictly anhydrous and oxygen-free conditions in glove boxes or sealed ampoules. Special care has to be taken when the material is heated in sealed-off ampoules. If gas evolves from the material, this may result in the explosion of the ampoule.
I.2 Magnetic susceptibility
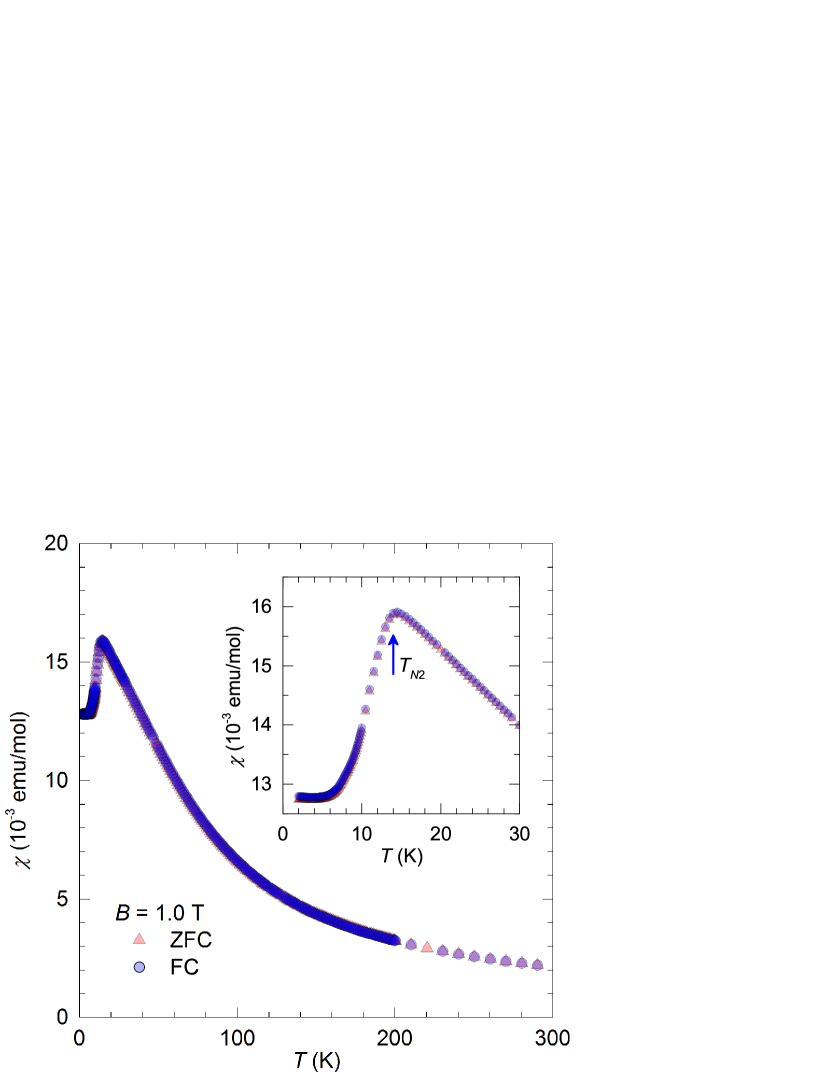
Magnetic susceptibility measurements of -RuCl3 were performed using a Quantum Design MPMS. A powdered sample of the mass mg was placed into a plastic capsule, in a glovebox to avoid contact with air, and then quickly transferred into the MPMS. Fig. 4 shows the measured susceptibility taken with cooling in field and in zero field. The obtained curve with the magnetic transition at K (inset of Fig. 4) is almost identical to the corresponding curve in Ref. Johnson_2015 .
I.3 Nuclear magnetic resonance
General. The 35Cl nuclear magnetic resonance (NMR) experiments were performed on a foil-like -RuCl3 single crystal of approximate dimensions mm3 in a continuous-flow cryostat allowing us to reach temperatures down to K. When handling the sample, we took extreme care to minimize its exposure to air. A thin NMR coil fitting the sample size was made from a thin copper wire with - turns, depending on the required tuning frequency determined by the external magnetic field. The coil was covered with a mixture of epoxy and ZrO2 powder, which was allowed to harden, in order to ensure the rigidity of the coil. The coil was then mounted on a teflon holder attached to a rotator, which allowed us to vary the orientation of the sample with respect to the external magnetic field. In order to reduce the noise of an already weak 35Cl NMR signal, a consequence of the extremely broad 35Cl NMR spectrum, we used a bottom-tuning scheme. With the output radio-frequency power of around W, the typical pulse length amounted to s. The NMR signals were recorded using the standard spin-echo, pulse sequence with a typical delay of s (much shorter than the spin-spin relaxation time ) between the and pulses.
relaxation. The spin-lattice relaxation (i.e., ) experiment was carried out using an inversion recovery pulse sequence, , with an inversion pulse (suitable for broad NMR lines) and a variable delay before the read-out spin-echo sequence. The spin-lattice relaxation datasets were typically taken at increasing values of . The datasets were analyzed using the model of magnetic relaxation for spin monitored on the central transition:
| (3) |
where is the spin-lattice relaxation time and is the inversion factor. In the region of the phase diagram outside the magnetically ordered phase [Fig. 2(b)], this expression reproduces the experimental relaxation curves perfectly. In the magnetically ordered phase, two components appear, and the relaxation curves are reproduced as a sum of two terms of the form given by Eq. (3). For instance, the temperature dependence of the corresponding two values for T with is given in Fig. 2(a). In cases where only a narrow temperature region below the transition was covered, the two components in the relaxation curves were hard to identify, and we used Eq. (3) with a stretched exponent instead.
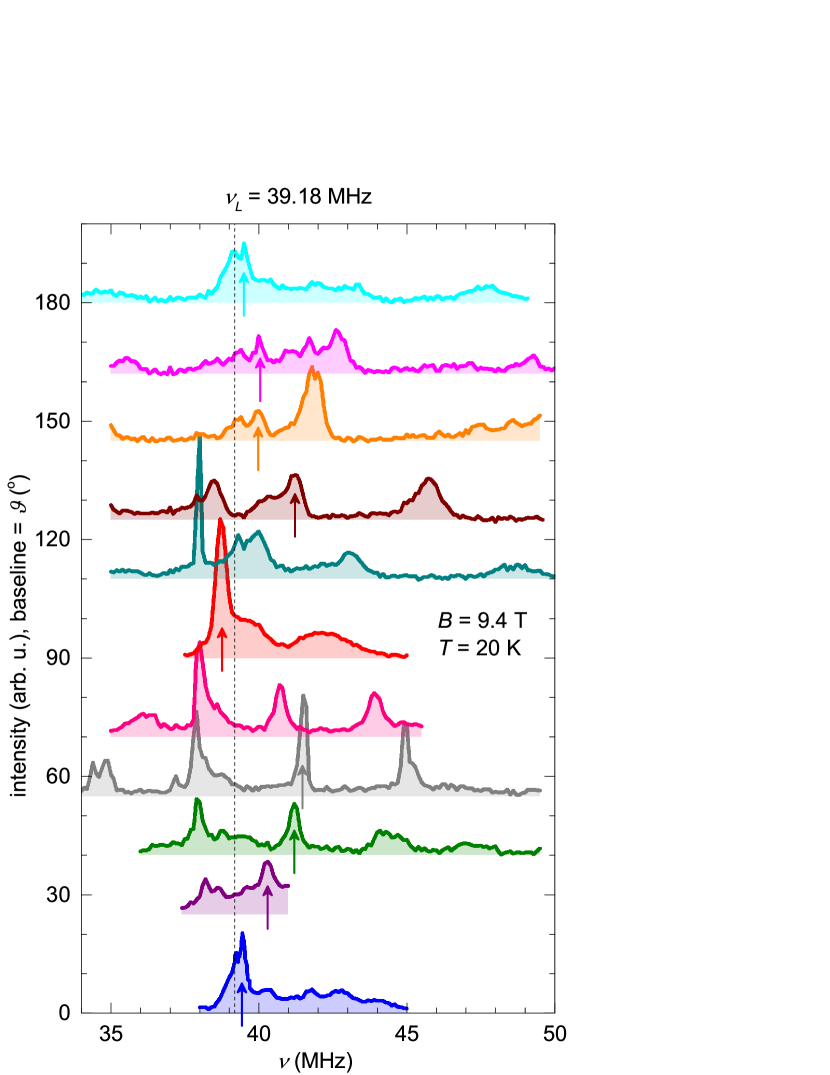
Orientation dependence of the NMR spectrum. The 35Cl NMR spectra were recorded point by point in frequency steps of or kHz, so that the Fourier transform of the signal was integrated at each step to arrive at the individual spectral point. The covered NMR frequency range was from MHz, the lower limit of our setup, up to MHz. The dependence of the corresponding part of the NMR spectrum on the direction of the external magnetic field of T (described by the angle from the crystal plane) at a temperature of K is shown in Fig. 5. The spectra are extremely broad because of large 35Cl (with spin) quadrupole interaction. As concluded in the following, a large portion of the covered frequency range is associated with the central, 35Cl NMR transition. As this transition is observed to consist of at least three peaks (Fig. 5), even for the symmetric orientation (with ), while there are only two inequivalent Cl sites in the crystal structure, the splitting of the central line is likely a consequence of stacking faults in the layered crystal structure or crystal twinning, or both.
Relation bewteen orientation and field dependence of . Measuring the dependence on the direction of the magnetic field (described by the angle from the crystal plane) instead of on its magnitude in the plane allows us to cover low values, while keeping the applied magnetic field high. This is beneficial for two reasons related to the strong quadrupole broadening of the 35Cl NMR spectrum (Fig. 5): to minimize an already large NMR linewidth and to keep the Larmor frequency well above the quadrupole splitting, which is of the order of MHz as concluded in the following. The validity of this approach is supported by the fact that data points for various angles and field values , and T in Fig. 1(c) all collapse on a smooth experimental curve. The data points taken in lower fields apparently exhibit much larger error bars. Namely, the corresponding datasets in Fig. 3(b) are more scattered than the datasets taken in T despite a much longer averaging for noise reduction.
Temperature dependence of the NMR line. We measured the temperature dependence of the dominant 35Cl NMR peak in a field of T for various sample orientations. From these measurements, we determined the temperature dependence of the frequency width [Fig. 6(a)] and the NMR shift of the peak with respect to the Larmor frequency [Fig. 6(b)]. For T, the width exhibits a clear kink as a function of temperature, which indicates the onset of NMR line broadening at the phase transition into the magnetically ordered state. Plotting the temperature of the kink as a function of in the inset of Fig. 6, we obtain the phase boundary of the magnetically ordered state, which perfectly matches the result of the reference study Johnson_2015 . In contrast, the NMR shift does not exhibit any signs of a magnetic transition, except for the () dataset. We find the NMR shift to be a monotonic function of temperature , empirically following a dependence over a broad temperature range.
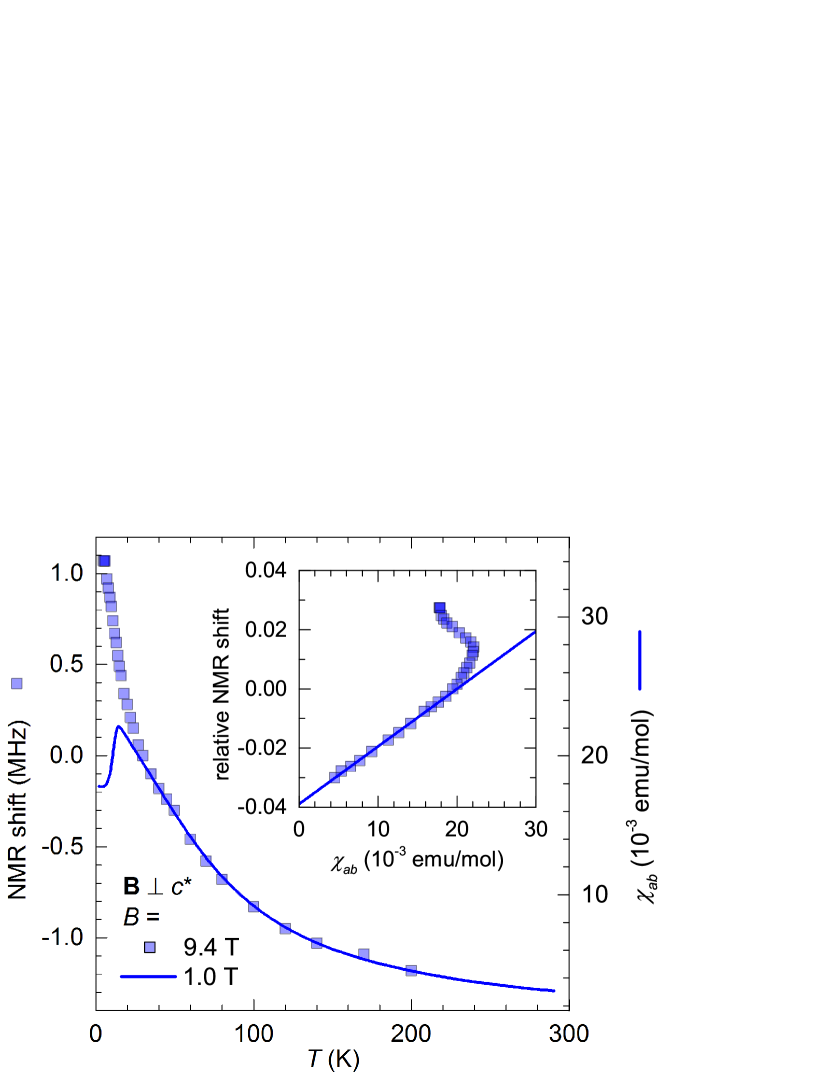
Contributions to the NMR shift. To separate the magnetic contribution to the NMR frequency shift from the temperature-independent quadrupole contribution, we plot the relative NMR shift (i.e., the NMR shift divided by the 35Cl Larmor frequency MHz in a field of T) measured on the dominant NMR peak for , i.e., in the plane [the dataset in Fig. 6(b)], against the rescaled magnetic susceptibility in the inset of Fig. 7. In Ref. Johnson_2015 , an experimental ratio between the susceptibility of the powdered sample and the susceptibility of the single crystal with a field applied in the plane is obtained as with , leading to . We use this empirical relation to evaluate from our field-cooled dataset shown in Fig. 4. As we did not measure susceptibility in high magnetic fields, we rely on the dataset taken in T. This is valid in a broad temperature range, except at low temperatures where this dataset starts to deviate from the high-field susceptibility Kubota_2015 . From the observed linear relation between the relative shift and up to emu/mol (i.e., down to K), we obtain the hyperfine coupling constant T/ and the zero-temperature relative shift that, when multiplied by , gives the quadrupole shift MHz.
From the obtained quadrupole shift , we can estimate the quadrupole splitting between the successive 35Cl NMR transitions. For the case of an axially symmetric EFG tensor and the field applied at an angle from the principal EFG axis with the largest EFG eigenvalue, the second-order quadrupole shift is given by for the nucleus Abragam_2011 . As the axes of the EFG tensor are not known, we assume a typical tilt of from , so that . From the previously evaluated we then obtain MHz. This is an estimate of the quadrupole splitting between the central 35Cl NMR transition and the satellite transitions. We can thus conclude that the NMR peaks in the covered frequency range of Fig. 5 all belong to the central transition.
I.4 Theory
Theoretical curve. The theoretical temperature dependence of is numerically calculated for the Kitaev model in zero field Yoshitake_2016 . contains two contributions, one coming from a single fluctuating spin (i.e., on-site) and the other one coming from fluctuating nearest-neighboring (NN) spins in the Kitaev honeycomb lattice. As the 35Cl nucleus in -RuCl3 is located at equal distances from the closest two Ru3+ spins [Fig. 1(a)], contains both contributions with equal weights. Namely, as the hyperfine coupling constant of 35Cl to both spins is the same, the relevant spin-spin correlation function can be generally written as
| (4) |
for the involved components and of both Ru3+ spins, where the plus (minus) sign is valid for ferromagnetic (antiferromagnetic) fluctuations. The first two terms on the right side of Eq. (I.4) represent the on-site contributions, while the last two represent the NN-sites contributions, both with apparently equal weights. Accordingly, the theoretical curve for the ferromagnetic case, plotted in Fig. 2(a), is the average of the on-site and NN-sites contributions.
relaxation due to gapped magnons. When spin fluctuations in the magnetic lattice are due to excited magnons, the corresponding spin-lattice relaxation rate for a single-magnon process is given by Beeman_1968
| (5) |
where is the energy of magnons, is their density of states, is the Bose-Einstein distribution function, , and is the Boltzmann constant. Denoting the magnon gap by (in kelvin units), we define as the energy measured from the bottom of the magnon band. The power-law dispersion relation in dimensions, which includes the standard parabolic dispersion () and the Dirac dispersion () as special cases, leads to . For low temperatures , the distribution function can be approximated by the Boltzmann distribution, . Plugging these expressions for and into Eq. (5), we obtain
| (6) |
The integral on the right side of Eq. (6) converges if and evaluates to where is the gamma function. We can thus rewrite Eq. (6) as
| (7) |
with the power of the prefactor . In case of , which is relevant for the Kitaev honeycomb magnet, for and for , so that the power cannot be negative. Even in case of , can only reach the lowest value of precisely for [although care should be taken in this case, as the integral in Eq. (6) then formally diverges]. If more than a single magnon is involved in the process, the power is also positive and becomes even higher Beeman_1968 . Gapped magnons thus cannot lead to the relaxation described by Eq. (7) with .
Instead, we can use Eq. (7) in the 3D magnetically ordered state, when the elementary excitations are magnons with a gap . In this case and , and this leads to . We use this expression to analyze the data [Fig. 2(a)] in the low-temperature ordered state of -RuCl3.
As a side observation, all these examples show that a frequently used simple gapped model with the gap , which was used before to analyze the datasets in -RuCl3 Baek_2017 , is actually not justified in any region of the phase diagram of -RuCl3.
Majorana fermion gap. In the Kitaev model, Majorana fermions acquire a gap in the presence of an external magnetic field Kitaev_2006 . This is shown for a field applied perpendicularly to the honeycomb plane, i.e., in the direction in the coordinate system defined by the Kitaev axes , and . The corresponding Zeeman term then reads , where is a single component of the magnetic field in energy units, is the -factor and is the Bohr magneton. When treated as a perturbation to the Kitaev Hamiltonian, the Zeeman term contributes to the Majorana fermion gap only at third order Kitaev_2006 . The corresponding effective Hamiltonian is thus proportional to and can be written as Kitaev_2006 ; Jiang_2011 ; Nasu_2017
| (8) |
where is a two-flux gap (in kelvin units), while (of the order of unity) accounts for the sum over the excited states, and its exact value is not known. The Kitaev model extended with such a three-spin exchange term with is still exactly solvable and the dispersion relation of the Majorana fermions is calculated as Jiang_2011
| (9) |
where is the Kitaev coupling (in kelvin units), while and are the unit vectors of the honeycomb lattice. The dispersion relation given by Eq. (9) is gapped for , and the corresponding gap can be calculated numerically as a function of and thus as a function of the magnetic field. For small magnetic fields, i.e., for , the Majorana fermion gap (in kelvin units) simplifies to
| (10) |
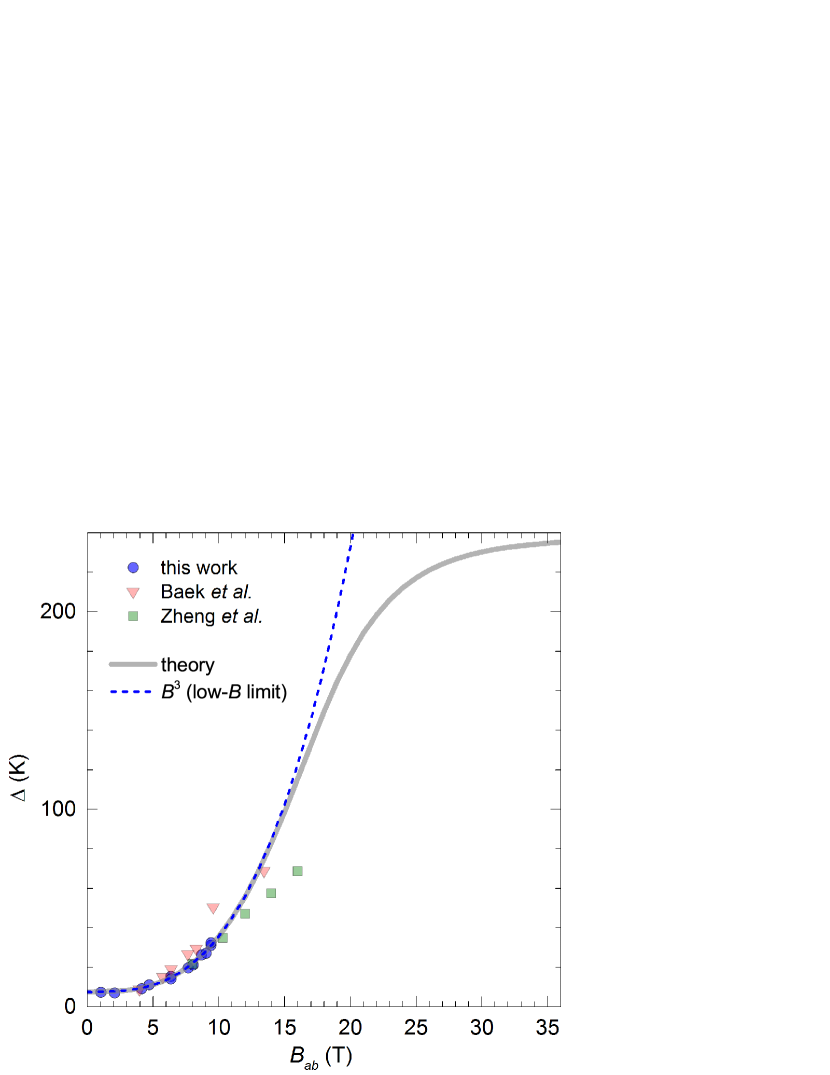
while for high magnetic fields it saturates to . The total spin-excitation gap is obtained by adding to the two-flux gap . The field dependence of is shown in Fig. 8 for K (taken from Ref. Do_2017 and used in this work), and [leading to the best fit of our data points]. The cubic approximation given by Eq. (10), which is also plotted in Fig. 8, is apparently valid up to T, well beyond the field range covered in this work.
I.5 Comparison with recent works
Recent NMR works. Very recently, two 35Cl NMR studies of -RuCl3 appeared Baek_2017 ; Zheng_2017 . The analysis of both studies is focused on the low-temperature region below K. Using a simple exponential model in this region, Ref. Baek_2017 finds that the excitation gap opens linearly with the field above the critical field around T. On the other hand, Ref. Zheng_2017 extends the covered temperature range down to K and finds a low-temperature gapless, power-law behavior of in the covered high-field region above the critical field around T.
As these results are very different from our results, also because of quite different analysis, we analyze the datasets obtained in these two works also with our model given by Eq. (1). As in our work, we focus on the Kitaev paramagnetic region, to the temperature range from K down to slightly above the transition temperature below T, and down to K above T (or a bit higher at higher fields), including the characteristic maximum in as a main feature. The data in Ref. Zheng_2017 were taken with a field applied in the crystal plane, while the data in Ref. Baek_2017 were taken with a field applied at and with respect to the plane. In this case, we calculate the effective field values in the same way as in our work. The obtained field dependence of the excitation gap for both works is shown in Fig. 8 together with our result. Applying our analysis to the data in all three works apparently leads to relatively consistent results. Nevertheless, the results for the data from Refs. Baek_2017 ; Zheng_2017 alone do not allow to conclude on the cubic field dependence of , mostly due to the lack of important low-field data points. Regarding Ref. Baek_2017 , the two data points at the highest fields seem to deviate from the trend set by the other points. The corresponding two datasets exhibit a suspicious plateau at low temperatures, not observed in any other dataset of the three works, which casts some doubts on their credibility. Regarding Ref. Zheng_2017 , the obtained data points, which complement our field region, nicely continue the trend set by our data points. The obtained trend is approximately linear in field, consistent with the theoretical prediction in this intermediate-field region, although with a different slope. However, the theoretical prediction is based on a perturbative treatment, which may not give reliable results outside the low-field region.
In light of our conclusions, the reported findings of these two works should be understood in the following way. While the true signs of fractionalization into Majorana fermions and gauge fluxes can be found in the Kitaev paramagnetic region covering a broad temperature range up to around K [Fig. 1(a)], the physics at low temperatures of the order of K and below is apparently obscured, most likely due to the effect of inevitable non-Kitaev interactions, as predicted already in Ref. Zheng_2017 .