Contamination of polymethylmethacrylate by organic quantum emitters
Abstract
We report the observation of ubiquitous contamination of polymethylmethacrylate by organic molecules with optical activity in the visible spectral range. Contamination sites of individual solvent-specific fluorophores in thin films of polymethylmethacrylate constitute fluorescence hot-spots with quantum emission statistics and quantum yields approaching 30% at cryogenic temperatures. Our findings not only resolve prevalent puzzles in the assignment of spectral features to various nanoemitters in polymer matrices, they also identify means for simple and cost-efficient realization of single-photon sources in the visible spectral range.
Embedding quantum emitters within chemically and electrostatically inert polymer matrices such as polymethylmethacrylate (PMMA) is a common approach to reduce the fluorescence (FL) intermittency encountered by a broad class of photoactive nanoparticles Nirmal et al. (1996); Frantsuzov et al. (2008) and molecular dyes Basché et al. (1995) under ambient conditions, thus promoting stable and enhanced FL Bradac et al. (2010); Ai et al. (2011). However, contamination of the polymer matrix by fluorescent constituents can result in controversial assignment of spectral features. In some spectroscopy experiments it has proven difficult to distinguish between the FL stemming from quantum emitters, the polymer matrix, or the supporting substrate Wang et al. (2015); Rabouw et al. (2016). This is not surprising given the challenge of unambiguous assignment of the FL to its actual source for photoactive systems with low quantum yields, or individual quantum emitters with high quantum yields but inherently low absolute FL intensities.
In the visible spectral range, the realm of photoactive nanoemitters includes single molecules Basché et al. (1997), fluorescent nanodiamonds Aharonovich et al. (2011), colloidal quantum dots Klimov et al. (2007) and nanoplatelets Ithurria et al. (2011), transition metal dichalcogenide quantum dots Srivastava et al. (2015); He et al. (2015); Koperski et al. (2015); Chakraborty et al. (2015), or perovskite nanoplatelets Weidman et al. (2016). The range of related potential applications in light emitting, detecting, and harvesting devices is as diverse as the specific details of the photophysics of the underlying emitters. In absolute terms, however, and depending on the radiative lifetime, some of these systems feature low FL intensities despite high quantum yields, while others suffer from reduced quantum yields due to optically inactive lowest-lying dark states Basché et al. (1995); Efros et al. (1996); Zhang et al. (2015) with strongly inhibited FL at cryogenic temperatures. Irrespective of the actual reason for low intensity, any contamination of the relevant FL by photoemissive substrates or matrices is clearly detrimental to both fundamental studies of nanoemitters and their related applications.
In the following, we present a comprehensive study targeting a quantitative analysis of the FL in the visible spectral range arising from a thin film of PMMA on various dielectric substrates. Surprisingly, we find that PMMA films prepared by standard solution-deposition procedures exhibit optical activity in the visible both at room and cryogenic temperatures. However, the FL is not a characteristic feature of the PMMA itself. It rather stems from fluorescent contaminants in the PMMA matrix that we ascribe to solvent residuals with specific FL intensity and spectra. For individual fluorescent contaminants, pronounced and spectrally stable zero-phonon lines (ZPLs) with red-shifted vibronic satellites and highly non-classical emission statistics emerge as a generic feature at cryogenic temperatures. At room temperature, thermal broadening of both the ZPL and the vibrational sidebands gives rise to a characteristic three-peak spectrum that can be mistaken for phonon replica of silica color centers Rabouw et al. (2016) or subject to other interpretations Mason et al. (1998); English et al. (2002); Martin et al. (2008); Chizhik et al. (2009); Wang et al. (2009); Kůsová et al. (2010); Schmidt et al. (2012).
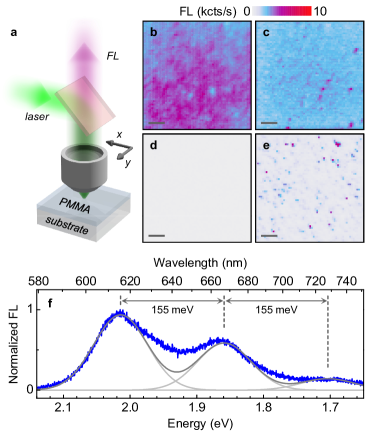
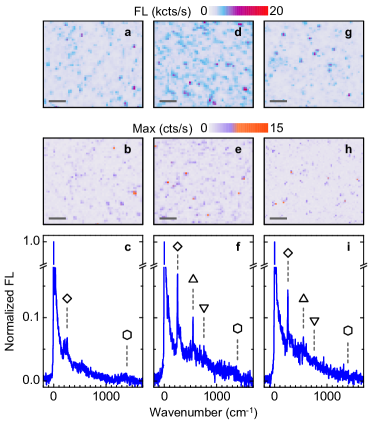
The basics of our experiment are illustrated in Fig. 1a. We performed FL spectroscopy in a home-built optical microscope to study sample-specific emission in the spectral range of nm excited with a continuous-wave laser at nm, a wavelength frequently used to excite FL in the visible. By raster-scanning the sample with respect to fixed diffraction-limited confocal excitation and collection spots, we acquired maps of FL intensity as in Fig. 1b - e with a single photon counting avalanche photodiode (APD), and hyperspectral maps with spectrally dispersed FL as in Fig. 1f recorded at each raster-scan pixel for spectral analysis of individual emission hotspots. The studies were complemented by time-correlated FL, second-order FL coherence and FL excitation spectroscopy experiments performed either at room temperature or at the cryogenic temperature of K.
In the first stage of the experiments we studied the FL characteristics of bare dielectric substrates. It has been argued recently that silica-based substrates host intrinsic fluorescent centers with sizable FL intensity in the visible Rabouw et al. (2016). Therefore, we first investigated the FL from the surface of bare fused silica substrates exposed to different cleaning procedures (see Methods for details on cleaning protocols). Under ambient conditions and W irradiation in a full-width at half-maximum (FWHM) spot of m we acquired raster-scan FL maps shown in Fig. 1b - d. For fused silica sonicated subsequently in acetone and isopropanol according to a common cleaning procedure we observed FL from the entire sample surface with inhomogeneous intensity and an average APD count rate of kcts/s (Fig. 1b). After an additional sonication step in deionized water the level of FL decreased to an average of kcts/s away from hotspot emission with kcts/s (Fig. 1c). Most remarkably, additional treatment with oxygen plasma suppressed the FL from the silica surface below the dark count rate of the APD (Fig. 1d). This set of data, consistently observed for quartz and sapphire substrates subjected to oxygen plasma treatment (see the Supplementary Information for substrate-specific FL maps), clearly establishes the absence of intrinsic FL defects on silica substrates. Moreover, it provides a first hint at the source of the FL as stemming from organic surface contaminants that do not withstand oxygen plasma treatment.
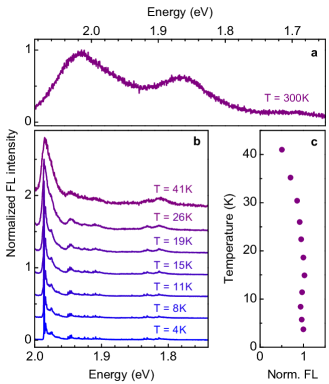
For the second experimental stage we prepared substrates free of FL background and covered them by spin-coating with PMMA dissolved in anisole. On a silica substrate with nm of PMMA, we observed the reappearance of fluorescent hotspots with intensities of up to kcts/s on a background of kcts/s (Fig. 1e) under measurement conditions identical to those of Fig. 1b - d. Similar results were found for as-deposited and thermally cross-linked PMMA films fabricated from anisole solutions (see Methods for sample details). For most hotspots, the FL was spatially localized to the diffraction-limited spot and characterized by room temperature spectra as in Fig. 1f. The spectrum with maximum FL at eV ( nm) can be reproduced with some success by three overlapping Gaussian peaks with FWHM linewidths of meV, equidistant separations of meV, and intensities that reduce with decreasing emission energy (grey solid lines in Fig. 1f). An explanation for the mismatch between this simplistic model fit and the actual spectrum pending, we point out its striking similarity to the spectra ascribed earlier to various sources Mason et al. (1998); English et al. (2002); Martin et al. (2008); Wang et al. (2009); Chizhik et al. (2009); Schmidt et al. (2012); Wang et al. (2015); Rabouw et al. (2016). Moreover, it exhibits a remarkable correspondence with the spectra of individual dyes in PMMA Trautman et al. (1994); Macklin et al. (1996), providing a second hint to hydrocarbon molecules as a source for misinterpretation and establishing a link to the visionary association made between the spectra of non-blinking colloidal quantum dots Wang et al. (2009) and organic dyes Orrit and Basché (2009).
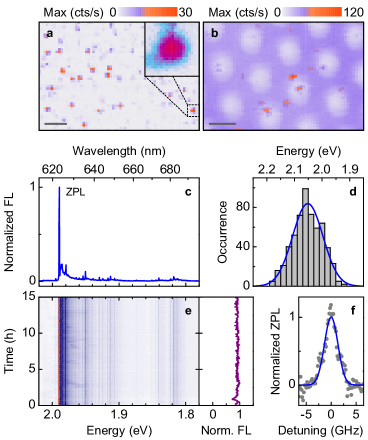
To elucidate the correspondence between the FL hotspots found at room temperature in thin films of PMMA and the spectral signatures of organic molecules we carried out spectroscopy studies at the cryogenic temperature of K. Fig. 2a and b show representative cryogenic FL maps of PMMA films on a fused silica substrate and a perforated silicon nitride membrane, respectively. Both maps were acquired in the hyperspectral mode by recording spectrally dispersed FL with a nitrogen-cooled CCD and color-coding its maximum intensity at each raster-scan pixel. Note the conceptual difference to the raster-scan maps recorded with APDs: hyperspectral mapping emphasizes emitters with sharp FL peaks over spectrally broad FL background. Again, we found spatially localized emission from diffraction-limited hotspots (inset of Fig. 2a) analogous to our room temperature experiments. A few hotspots in Fig. 2b (with up to cts/s) clearly stem from PMMA regions suspended over holes which can be unambiguously distinguished from the silicon nitride membrane by the respective FL background (grey and blue areas of the map correspond to intensities of and cts/s, respectively). This observation confirms once more that the PMMA film rather than the substrate is the actual host of FL hotspots.
A characteristic cryogenic FL spectrum of a hotspot in PMMA is shown in Fig. 2c. It features a narrow and intense peak, which we label as ZPL, accompanied by weak red-shifted satellites. More than of localized emission sites exhibited similar spectral characteristics at low temperature. Within this group of emitters with spectrometer-limited ZPLs, of hotspots constitute the class of emitters with a ZPL centered around eV emission energy ( nm emission wavelength). The corresponding normal distribution of the ZPL energy is shown in Fig. 2d, where the blue solid line is a Gaussian fit to the histogram with a FWHM of meV. The remaining of the single-site emitters with intense FL were characterized by two sharp ZPLs (see Supplementary Information for the corresponding normal distribution of emission energies) accompanied by red-shifted sidebands.
All spectra were remarkably stable over time without significant FL intermittence during the course of observation of h (Fig. 2e) and beyond. Throughout the temporal evolution, the ZPL remained spectrometer-limited to one pixel of the CCD corresponding to an upper bound on the FWHM linewidth of eV. A high-resolution spectrum recorded with a scanning Fabry-Pérot etalon suggests that spectral wandering broadens the ZPL on sub-minutes timescale to an inhomogeneous peak with a FWHM of GHz (Fig. 2f). These spectral signatures find their correspondence in the studies of hydrocarbon fluorophores embedded in a polymer host matrix Kettner et al. (1994); Kozankiewicz et al. (1994); Walser et al. (2009a). Within this framework, low-temperature FL of single molecules is characterized by a spectrally narrow ZPL associated with the principal electronic transition Diehl et al. (2010) and sidebands stemming from Franck-Condon transitions between vibronically dressed molecular electronic states Tchénio et al. (1993a); Myers et al. (1994). Stabilized in PMMA, single molecules exhibit FL with low intermittency and ZPLs limited by spectral diffusion to GHz Kozankiewicz et al. (1994); Walser et al. (2009b). The red-shifted satellites of the ZPL are equally well pronounced in vibronic spectroscopy Tchénio et al. (1993b) of molecules with characteristic vibrational degrees of hydrocarbon complexes.
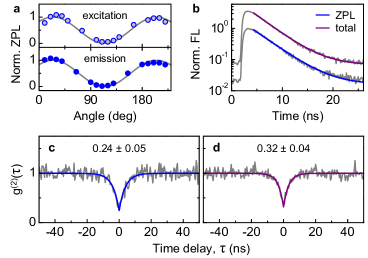
The set of data in Fig. 3 further substantiates the correspondence. With polarization-resolved measurements shown in Fig. 3a we confirmed the dipolar character associated with the molecular transition of the ZPL Macklin et al. (1996). The orientation of the absorption and emission axes measured with linearly polarized excitation and detection, respectively, were determined as collinear within our experimental precision. Furthermore, time-correlated measurements of Fig. 3b revealed the characteristic FL decay dynamics of molecules on nanoseconds timescale Green and Buckley (2015). The single-exponential lifetimes of and ns for the ZPL within a spectral window of meV and the total FL intensity, respectively, were the same within the temporal resolution of ns in our experiments, identifying red-shifted sidebands as vibronic ZPL replicas. Finally, single photon emission statistics as a hallmark of single-molecule FL Basché et al. (1992); Lounis and Moerner (2000) are presented in Fig. 3c and d. With photon correlation spectroscopy we observed pronounced photon antibunching in the normalized second-order coherence function at zero time delay for both the FL within a band-pass interval of meV around the ZPL (with in Fig. 3c) and the full FL spectrum without spectral filtering ( in Fig. 3d). Thus, within the uncertainty of our measurement, we can rule out simultaneous photon emission into the ZPL and the sideband spectrum associated with the vibronic ZPL satellites.
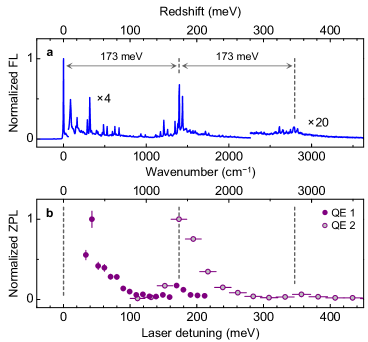
Having identified the fluorescent hotspots in PMMA as single fluorescent molecules, we utilized vibrationally resolved FL spectroscopy Moerner and Kador (1989); Tchénio et al. (1993b); Myers et al. (1994) to shed light on their molecular nature. Fig. 4a shows a spectrum of a hotspot that is representative for fluorescent contaminants in PMMA prepared with anisole as solvent. A series of low-frequency vibrational modes contributes to the sidebands below meV (cm-1), followed by a group of replicas around meV (cm-1) and a weaker satellite group around meV (cm-1). The latter is in fact a second harmonic of the preceding group as confirmed by correlation analysis between all individual peaks of the two groups upon a spectral shift by meV. All main vibrational features in emission have their broadened counterpart resonances in absorption, as demonstrated by the FL excitation spectra in Fig. 4b recorded for two typical emitters with different ZPL energies as a function of laser energy detuning at constant excitation power. For both quantum emitters of Fig. 4b, the absorption is enhanced whenever the laser detuning with respect to the ZPL matches the energy of the vibronic sidebands (the dashed lines in Fig. 4 emphasize the correspondence between the resonances in emission and absorption).
The vibrationally resolved spectrum of Fig. 4b is typical for fluorescent molecules in PMMA films from anisole-based solutions. It exhibits a striking similarity with the cryogenic FL of anthracene characterized by a ZPL in the ultraviolet (around eV) and a pronounced vibronic satellite group around cm-1 redshifts Helfrich and Lipsett (1965). The according vibrational degrees of freedom are related to the intramolecular stretching of adjacent carbon bonds in polycyclic aromatic hydrocarbons Myers et al. (1994). The observation of the ZPL emission in the visible (around eV) from anisole-based PMMA suggests that the optical activity of solvent-related contaminants in such films stems from acene chains such as pentacene, or from anthracene-derived dyes such as alizarin.
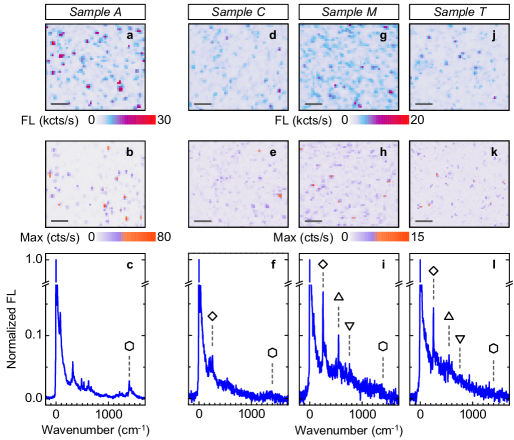
We applied vibrational FL spectroscopy to hotspots in PMMA films derived from other solvents (see Methods for sample preparation details). As highlighted by the raster-scan maps of Fig. 5, the areal density and the FL intensity of hotspots in PMMA films formed with chlorobenzene (Fig. 5a, b), methyl isobutyl ketone (Fig. 5c, d) and toluene (Fig. 5g, h) were similar to anisole-based PMMA characteristics (Fig. 1e and Fig. 2a). The vibronic signatures, however, showed significant differences. Fig. 5c, f, and i show normalized average spectra of brightest fluorophore contaminants in PMMA films prepared with different solvents (see the Supplementary Information for the corresponding average spectrum of anisole-based PMMA).
The spectrum of a typical hotspot in chlorobenzene-based PMMA features a low-frequency vibronic band around cm-1 and a pronounced high-frequency band around cm-1 discussed earlier (as indicated by the diamond and the hexagon Fig. 5c). In contrast, the vibronic FL characteristics of hotspots in PMMA films formed with methyl isobutyl ketone and toluene solutions (Fig. 5f and i, respectively) exhibit additional vibrational signatures at and cm-1. The vibronic modes, labelled with diamonds and upper and lower triangles in Fig. 5c, f, and i are characteristic of rylene dyes composed of naphthalenes. While the low-frequency mode (diamonds in Fig. 5c, f, and i) is close to that of the long axis stretch of a terrylene molecule, the higher-frequency modes (upper and lower triangles in Fig. 5f and i) are consistent with the short axis stretch and ring deformation of outer naphthalenes, respectively Myers et al. (1994). Note that naphthalene-related bands of rylene dyes are only very weakly expressed in the averaged vibronic FL spectra observed in anisole- and chlorobenzene-based PMMA films (Fig. 4a and Fig. 5c).
In addition to solvent-specific differences in the spectra of fluorescent hotspots in PMMA, vibrationally resolved FL spectroscopy identifies the normal modes of aromatic hydrocarbons around meV ( cm-1) as a generic feature of FL contaminants at low temperatures. At elevated temperatures, these modes develop into broad vibronic satellites (see the Supplementary Information for FL spectra at different temperatures) that accompany the FL from the thermally broadened principal molecular transition. With this in mind, the interpretation of the three-peak structure of the room-temperature FL spectrum in Fig. 1f as arising from an organic fluorophore is straight forward. For an adequate modelling, however, the contributions of all other vibrational modes must be taken into account. The main corrections to the inhomogeneous spectral profile of the ZPL and the vibronic modes of polycyclic hydrocarbons will naturally appear on the low-energy side of the peaks, where the fit with three Gaussians most significantly deviates from the actual spectrum.
In concise terms, our comprehensive study of fluorescent spots, ubiquitously present in PMMA films and on contaminated dielectric substrates, leads to the conclusion that organic fluorophores are the actual source of misinterpreted FL signatures. We estimate the quantum yield of such organic quantum emitters to range from at room temperature up to at K (see the Supplementary Information for the estimate of the quantum yield). These values are not remarkably high, however, the corresponding FL intensity can be significant in studies of photoactive systems with reduced quantum yields in cryogenic or ambient environments. In fact, we found the FL intensity of PMMA hotspots to be roughly a third of the emission intensity of individual terrylenediimide (TDI) molecules at cryogenic temperatures, and in many instances even more intense than commercial radiant dyes at ambient conditions. Given the present technological limitations to solvent purity, it seems unlikely that contamination of PMMA and other polymer matrices can be completely avoided in future experiments. On the other hand, the abundance of stable quantum emitters in polymer films could facilitate a range of fundamental studies and technological developments relying on simple and cheap sources of non-classical light.
Methods: All samples were prepared in a clean-room environment. Unless stated otherwise, substrates were cleaned by initial sonication in acetone (Technic, acetone Micropur VLSI) for min, followed by isopropanol (Technic, propan-2-ol Micropur VLSI) for min, and finally exposed for min to oxygen plasma. Polymer covered samples were prepared by spin-coating l of PMMA onto oxygen plasma-treated fused silica (CrysTec) and other dielectric substrates (quartz and sapphire). An ellipsometer was used to adjust the spin-coating parameters for a film thickness of nm. The films were obtained from commercial PMMA formulated in anisole with a molecular weight of K (MicroChem, PMMA A resist for electron-beam lithography). The spin-coated PMMA film was left to dry at ambient conditions. Optionally, the samples were baked at C for s on a hot plate. The perforated silicon nitride membrane (PELCO) of Fig. 2b was drop-casted and baked to ensure mechanical stability of freely suspended PMMA. Control experiments were carried out with of K PMMA resin (DuPont, Elvacite 2041) diluted in of chlorobenzene (Merck, 801791), methyl isobutyl ketone (Technic, MIBK Micropur VLSI), or toluene (Sigma-Aldrich, 179418).
FL imaging and spectroscopy measurements were performed with a home-built confocal microscope coupled to single-mode fibers. Room-temperature experiments were conducted with an apochromatic objective with numerical aperture (NA) of (attocube systems, LT-APO/VISIR/0.82) and an oil immersion objective (Olympus, UPLFLN 100XOI2) with NA of for the data in Fig. 1f. Cryogenic experiments were carried out in a helium bath cryostat or a low-vibration closed-cycle cryostat (attocube systems, attoDRY1000) with base temperatures of K and K, respectively, using a low-temperature apochromatic objective with NA of (attocube systems, LT-APO/VIS/0.65).
Continuous wave excitation with a solid-state laser at nm (CNI, MLL-III-532-50-1) was used in all experiments except for the measurements of data in Fig. 3b and Fig. 4b. All FL maps were recorded with circularly polarized excitation except for Fig. 2b and Fig. S1, where linearly polarized excitation was used. Time-resolved FL data in Fig. 3b were measured with ps-excitation at nm. The FL excitation experiments of Fig. 4b were performed with an optical parametric oscillator (Coherent, Mira-OPO with a FWHM spectral bandwidth of nm) or a spectrally filtered supercontinuum laser (NKT Photonics, SuperK EXW- with a FWHM spectral bandwidth of nm). Single photon counting avalanche photodiodes (PicoQuant, -SPADs with dark count rates of cts/s and a temporal resolution of ps) or a monochromator equipped with a liquid nitrogen cooled CCD (PI, Acton SP-2558 and Spec-10:100BR/LN with a spectral resolution of eV and a gain setting of e-/count) were used for detection. The hyperspectral raster-scan maps in Fig. 2a and b were recorded in the spectral range of eV. The data in Fig. 2f were measured with a home-built monolithic scanning Fabry-Pérot etalon with a spectral resolution of MHz and a scanning rate of MHz/s.
Conflict of interest: The authors declare no competing financial interest.
Acknowledgment. We thank T. Basché, C. Bräuchle, I. Gerhard, S. Götzinger, K. Karrai, J. P. Kotthaus, E. Lifshitz, J. Lupton, G. I. Maikov, M. Pilo-Pais, I. Pugliesi, K. Puschkarsky, E. Riedle, J. Tilchin and S. E. Beavan for helpful discussions and useful input at various stages of the project, P. Maletinsky and S. Thoms for providing samples with NV centers in diamond and TDI molecules in PMMA, respectively, and P. Altpeter and R. Rath for assistance in the clean-room. This work was funded by the Volkswagen Foundation, the German-Israeli Foundation for Scientific Research and Development (GIF), and the Deutsche Forschungsgemeinschaft (DFG) Cluster of Excellence Nanosystems Initiative Munich (NIM) with financial support from LMUinnovativ and the Center for NanoScience (CeNS). A. H. acknowledges funding by the European Research Council under the ERC grant agreement no. .
Author Contributions: ⋆these authors contributed equally to this work.
Corresponding author: alexander.hoegele@lmu.de
Supplementary Information provides details on sample fabrication and experiments.
References
- Nirmal et al. (1996) M. Nirmal, B. O. Dabbousi, M. G. Bawendi, J. J. Macklin, J. K. Trautman, T. D. Harris, and L. E. Brus, Nature 383, 802 (1996).
- Frantsuzov et al. (2008) P. Frantsuzov, M. Kuno, B. Janko, and R. A. Marcus, Nat. Phys. 4, 519 (2008).
- Basché et al. (1995) T. Basché, S. Kummer, and C. Bräuchle, Nature 373, 132 (1995).
- Bradac et al. (2010) C. Bradac, T. Gaebel, N. Naidoo, M. J. Sellars, J. Twamley, L. J. Brown, A. S. Barnard, T. Plakhotnik, A. V. Zvyagin, and J. R. Rabeau, Nat. Nanotechnol. 5, 345 (2010).
- Ai et al. (2011) N. Ai, W. Walden-Newman, Q. Song, S. Kalliakos, and S. Strauf, ACS Nano 5, 2664 (2011).
- Wang et al. (2015) X. Wang, X. Ren, K. Kahen, M. A. Hahn, M. Rajeswaran, S. Maccagnano-Zacher, J. Silcox, G. E. Cragg, A. L. Efros, and T. D. Krauss, Nature 527, 544 (2015).
- Rabouw et al. (2016) F. T. Rabouw, N. M. B. Cogan, A. C. Berends, W. v. d. Stam, D. Vanmaekelbergh, A. F. Koenderink, T. D. Krauss, and C. d. M. Donega, Sci. Rep. 6, 21187 (2016).
- Basché et al. (1997) T. Basché, W. E. Moerner, M. Orrit, and U. P. Wild, eds., Single-Molecule Optical Detection, Imaging and Spectroscopy (VCH Verlagsgesellschaft mbH, 1997).
- Aharonovich et al. (2011) I. Aharonovich, A. D. Greentree, and S. Prawer, Nat. Photonics 5, 397 (2011).
- Klimov et al. (2007) V. I. Klimov, S. A. Ivanov, J. Nanda, M. Achermann, I. Bezel, J. A. McGuire, and A. Piryatinski, Nature 447, 441 (2007).
- Ithurria et al. (2011) S. Ithurria, M. D. Tessier, B. Mahler, R. P. S. M. Lobo, B. Dubertret, and A. L. Efros, Nat. Mater. 10, 936 (2011).
- Srivastava et al. (2015) A. Srivastava, M. Sidler, A. V. Allain, D. S. Lembke, A. Kis, and A. Imamoğlu, Nat. Nanotechnol. 10, 491 (2015).
- He et al. (2015) Y.-M. He, G. Clark, J. R. Schaibley, Y. He, M.-C. Chen, Y.-J. Wei, X. Ding, Q. Zhang, W. Yao, X. Xu, et al., Nat. Nanotechnol. 10, 497 (2015).
- Koperski et al. (2015) M. Koperski, K. Nogajewski, A. Arora, V. Cherkez, P. Mallet, J.-Y. Veuillen, J. Marcus, P. Kossacki, and M. Potemski, Nat. Nanotechnol. 10, 503 (2015).
- Chakraborty et al. (2015) C. Chakraborty, L. Kinnischtzke, K. M. Goodfellow, R. Beams, and A. N. Vamivakas, Nat. Nanotechnol. 10, 507 (2015).
- Weidman et al. (2016) M. C. Weidman, M. Seitz, S. D. Stranks, and W. A. Tisdale, ACS Nano 10, 7830 (2016).
- Efros et al. (1996) A. L. Efros, M. Rosen, M. Kuno, M. Nirmal, D. J. Norris, and M. Bawendi, Phys. Rev. B 54, 4843 (1996).
- Zhang et al. (2015) X.-X. Zhang, Y. You, S. Y. F. Zhao, and T. F. Heinz, Phys. Rev. Lett. 115, 257403 (2015).
- Mason et al. (1998) M. D. Mason, G. M. Credo, K. D. Weston, and S. K. Buratto, Phys. Rev. Lett. 80, 5405 (1998).
- English et al. (2002) D. S. English, L. E. Pell, Z. Yu, P. F. Barbara, and B. A. Korgel, Nano Lett. 2, 681 (2002).
- Martin et al. (2008) J. Martin, F. Cichos, F. Huisken, and C. von Borczyskowski, Nano Lett. 8, 656 (2008).
- Chizhik et al. (2009) A. M. Chizhik, A. I. Chizhik, R. Gutbrod, A. J. Meixner, T. Schmidt, J. Sommerfeld, and F. Huisken, Nano Lett. 9, 3239 (2009).
- Wang et al. (2009) X. Wang, X. Ren, K. Kahen, M. A. Hahn, M. Rajeswaran, S. Maccagnano-Zacher, J. Silcox, G. E. Cragg, A. L. Efros, and T. D. Krauss, Nature 459, 686 (2009).
- Kůsová et al. (2010) K. Kůsová, O. Cibulka, K. Dohnalová, I. Pelant, J. Valenta, A. Fučíková, K. Žídek, J. Lang, J. Englich, P. Matějka, et al., ACS Nano 4, 4495 (2010).
- Schmidt et al. (2012) T. Schmidt, A. I. Chizhik, A. M. Chizhik, K. Potrick, A. J. Meixner, and F. Huisken, Phys. Rev. B 86, 125302 (2012).
- Trautman et al. (1994) J. K. Trautman, J. J. Macklin, L. E. Brus, and E. Betzig, Nature 369, 40 (1994).
- Macklin et al. (1996) J. J. Macklin, J. K. Trautman, T. D. Harris, and L. E. Brus, Science 272, 255 (1996).
- Orrit and Basché (2009) M. Orrit and T. Basché, Chem. Phys. Chem. 10, 2383 (2009).
- Kettner et al. (1994) R. Kettner, J. Tittel, T. Basché, and C. Bräuchle, J. Phys. Chem. 98, 6671 (1994).
- Kozankiewicz et al. (1994) B. Kozankiewicz, J. Bernard, and M. Orrit, J. Chem. Phys. 101, 9377 (1994).
- Walser et al. (2009a) A. Walser, A. Renn, S. Götzinger, and V. Sandoghdar, Chem. Phys. Lett. 472, 44 (2009a).
- Diehl et al. (2010) F. P. Diehl, C. Roos, H.-C. Jankowiak, R. Berger, A. Köhn, G. Diezemann, and T. Basché, J. Phys. Chem. B 114, 1638 (2010).
- Tchénio et al. (1993a) P. Tchénio, A. B. Myers, and W. Moerner, Chem. Phys. Lett. 213, 325 (1993a).
- Myers et al. (1994) A. B. Myers, P. Tchénio, M. Z. Zgierski, and W. E. Moerner, J. Phys. Chem. 98, 10377 (1994).
- Walser et al. (2009b) A. Walser, G. Zumofen, A. Renn, S. Götzinger, and V. Sandoghdar, Mol. Phys. 107, 1897 (2009b).
- Tchénio et al. (1993b) P. Tchénio, A. B. Myers, and W. E. Moerner, J. Phys. Chem. 97, 2491 (1993b).
- Green and Buckley (2015) A. P. Green and A. R. Buckley, Phys. Chem. Chem. Phys. 17, 1435 (2015).
- Basché et al. (1992) T. Basché, W. E. Moerner, M. Orrit, and H. Talon, Phys. Rev. Lett. 69, 1516 (1992).
- Lounis and Moerner (2000) B. Lounis and W. E. Moerner, Nature 407, 491 (2000).
- Moerner and Kador (1989) W. E. Moerner and L. Kador, Phys. Rev. Lett. 62, 2535 (1989).
- Helfrich and Lipsett (1965) W. Helfrich and F. R. Lipsett, J. Chem. Phys. 43, 4368 (1965).
I SUPPLEMENTARY INFORMATION
I.1 Sample fabrication
All samples were prepared in a clean-room environment. Unless stated otherwise, substrates were cleaned by initial sonication in acetone (Technic, acetone Micropur VLSI) for min, followed by isopropanol (Technic, propan-2-ol Micropur VLSI) for min, and finally exposed for min to oxygen plasma. Polymer covered samples were prepared by spin-coating l of PMMA onto oxygen plasma-treated fused silica (CrysTec) and other dielectric substrates (quartz and sapphire). An ellipsometer was used to adjust the spin-coating parameters for a film thickness of nm. The films were obtained from commercial anisole based PMMA with a molecular weight of K (MicroChem, PMMA A resist for electron-beam lithography). The spin-coated PMMA film was left to dry at ambient conditions. Optionally, the samples were baked at C for s on a hot plate. The perforated silicon nitride membrane (PELCO) of Fig. 1b from the main text was drop-casted and baked to ensure mechanical stability of freely suspended PMMA. Control experiments were carried out with of K PMMA resin (DuPont, Elvacite 2041) diluted in of chlorobenzene (Merck, 801791), methyl isobutyl ketone (Technic, MIBK Micropur VLSI), or toluene (Sigma-Aldrich, 179418).
I.2 Experimental setup
A home-built confocal microscope coupled to single-mode fibers was used for FL imaging and spectroscopy. Room-temperature experiments were performed with an apochromatic objective with numerical aperture (NA) of (attocube systems, LT-APO/VISIR/0.82) and an oil immersion objective (Olympus, UPLFLN 100XOI2) with NA of . Cryogenic experiments were carried out in a helium dewar or a low-vibration closed-cycle cryostat (attocube systems, attoDRY1000) with base temperatures of K and K, respectively, using a low-temperature apochromatic objective with NA of (attocube systems, LT-APO/VIS/0.65). The FL was excited with a continuous wave solid-state laser at nm (CNI, MLL-III-532-50-1), an optical parametric oscillator (Coherent, Mira-OPO with a FWHM spectral bandwidth of nm), or a spectrally filtered supercontinuum laser (NKT Photonics, SuperK EXW-12 with a FWHM spectral bandwidth of nm). Single photon counting avalanche photodiodes (PicoQuant, -SPADs with dark count rates of cts/s and a temporal resolution of ps) or a monochromator equipped with a liquid nitrogen cooled CCD (PI, Acton SP-2558 and Spec-10:100BR/LN with a spectral resolution of eV and a gain setting of e-/count) were used for detection. A home-built monolithic scanning Fabry-Pérot etalon with a spectral resolution of MHz was used for high-resolution spectroscopy.
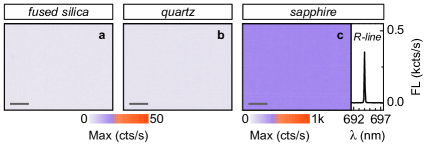
I.3 Optical characterization of substrates
Three dielectric substrates were studied in hyperspectral raster-scan FL: fused silica (Crystec), quartz (Crystec, z-cut, orientation) and sapphire (MaTecK, z-cut, orientation). Prior to cryogenic measurements the substrates were exposed to oxygen plasma. Cryogenic raster-maps of FL maxima are shown in Fig. 1a, b, and c for fused silica, quartz, and sapphire, respectively. The FL maximum level was identical for fused silica and quartz (Fig. 1a and b) with count rates given by the readout noise of the liquid nitrogen cooled CCD. The sapphire substrate exhibited spatially homogeneous FL intensity stemming from a sharp peak at nm ( eV) of the R-line of Cr3+ ions in Al2O3.
I.4 Optical characterization of PMMA prepared with different solvents
Fig. 2 compares cryogenic FL characteristics of PMMA films with nm thickness, prepared by spin-coating mixtures of PMMA in different solvents onto oxygen plasma-treated fused silica substrates. Four different solvents were used: anisole (sample A), chlorobenzene (sample C), methyl isobutyl ketone (sample M), and toluene (sample T).
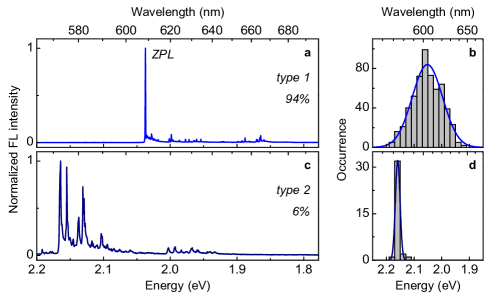
I.5 Spectral characteristics of quantum emitters in anisole-based PMMA films
Representative spectra of most common hotspot quantum emitters in PMMA films prepared with anisole solvent are shown in Fig. 3. More than of localized emission sites exhibited similar spectral characteristics at low temperature. Within this group of emitters with spectrometer-limited ZPLs, of hotspots constituted the class of emitters with one sharp and intense zero-phonon line (ZPL) and red-shifted vibronic replicas as in Fig. 3a. The corresponding normal distribution of the ZPL energy is shown in Fig. 3b. In contrast to such emitters that we label here as type 1, of type 2 fluorescent hotspots exhibited two intense and sharp peaks as in Fig. 3c with two intense satellites and a much narrower spread in the energy of the blue-most peak (histogram in Fig. 3d).
The evolution of a typical type 1 hotspot spectrum with temperature in sample A (anisole-based PMMA) is shown in Fig. 4. The ZPL and the vibronic satellites broadened upon heating from to K (Fig. 4b), and the overall FL decreased gradually for temperatures above K (Fig. 4c). Both the initial intensity and the spectral lineshape were recovered upon successive cooling back to K. The trend of thermal broadening as in Fig. 4b eventually results in significant spectral overlap of the ZPL and vibronic satellites at room temperature with predominant contributions from the vibronic group around meV and its second harmonic around meV red-shifts (Fig. 4a).
I.6 Quantum yield estimate
The FL quantum yield of an emitter is given by the ratio of emitted photons to absorbed photons per unit time. In our experiments we estimate the quantum yield of single type 1 fluorescent hotspots in PMMA films formed with anisole-based solutions by scaling the FL intensity to a photostable emitter with known optical properties. We used single nitrogen-vacancy (NV) color centers in bulk diamond that exhibit a quantum yield of Jelezko and Wrachtrup (2006) and a dipole averaged absorption cross-section of cm2 Wee et al. (2007) for nm excitation. With these quantities, the conversion cross-section of a fluorescent hotspot, given by the product of the corresponding quantum yield and absorption cross-section , is determined as:
Here, the term is the FL intensity of a hotspot scaled to the FL of a single NV center for the same excitation power in the linear response regime of both emitters. This ratio ranged from to for room temperature measurements and peaked at for cryogenic temperatures of K and K. The emitters were excited with continuous wave excitation at nm and circular polarization to ensure averaging over the possible orientations of the transition dipole moments. The factor accounts for the different FL lifetimes of the fluorescent hotspots and the NV centers with ns and ns determined experimentally. Finally, we also account for the difference in the effective collection solid angles for fluorescent dipoles embedded in different dielectric environments (PMMA and diamond) with respective refractive indices via which was close to in our experiments.
With these values the conversion cross-section of a typical type 1 fluorescent hotspot excited at nm was in the order of cm2 at room temperature and increased to cm2 at cryogenic temperatures. Using cm2 as a typical absorption cross-section of the second absorption band of common polycyclic hydrocarbon compounds Berlman (1971), we obtain an estimate for the fluorescence quantum yield of at room temperature and up to at cryogenic temperatures. We obtained similar values, both at room and cryogenic temperatures, from scaling the quantum yield of fluorescent hotspots in anisole-based samples to fluorescence characteristics of individual TDI molecules.
References
- Jelezko and Wrachtrup (2006) F. Jelezko and J. Wrachtrup, Phys. Status Solidi A 203, 3207 (2006).
- Wee et al. (2007) T.-L. Wee, Y.-K. Tzeng, C.-C. Han, H.-C. Chang, W. Fann, J.-H. Hsu, K.-M. Chen, and Y.-C. Yu, J. Phys. Chem. A 111, 9379 (2007).
- Berlman (1971) I. B. Berlman, Handbook of Fluorescence Spectra of Aromatic Molecules (Academic Press, 1971), 2nd ed.