Introducing Data Primitives:
Data Formats for the SKED Framework
Abstract
Background
The past few years have seen a tremendous increase in the size and complexity of datasets. Scientific and clinical studies must to incorporate datasets that cross multiple spatial and temporal scales to describe a particular phenomenon. The storage and accessibility of these heterogeneous datasets in a way that is useful to researchers and yet extensible to new data types is a major challenge.
Methods
In order to overcome these obstacles, we propose the use of data primitives as a common currency between analytical methods. The four data primitives we have identified are time series, text, annotated graph and triangulated mesh, with associated metadata. Using only data primitives to store data and as algorithm input, output, and intermediate results, promotes interoperability, scalability, and reproducibility in scientific studies.
Results
Data primitives were used in a multi-omic, multi-scale systems biology study of malaria infection in non-human primates to perform many types of integrative analysis quickly and efficiently.
Conclusions
Using data primitives as a common currency for both data storage and for cross talk between analytical methods enables the analysis of complex multi-omic, multi-scale datasets in a reproducible modular fashion.
1 Background
Recent advances in data acquisition have resulted in a rapid increase in data types and models for the study of systems biology. Models in biology describe our current understanding of a system and provide the theoretical basis for further experiments and investigations [8]. Because biological models have become increasingly complex over the years with even models to describe an entire cell, it is impractical to rely on traditional methods (ie. published papers, books) to contain all necessary information to recreate an experiment and design future experiments. A quantitative model using ordinary differential equations (ODEs) may include hundreds of equations and still not adequately describe a biological phenomenon. For example, muscular dystrophy (MD) models combine the presence of physiological symptoms and cellular quantities to describe the progression of the disease [6]. Such models are essential in predicting disease outcomes [6].
Previous standardization efforts for model sharing in systems biology are limited in scope and can require a great deal of human interpretation. Standardization efforts have been focused on one level of biological organization and even systems biology standardization efforts are cell -centric with few resources to connect such models to clinical or physiological data and even simulation experiments have their own standardization format [7]. To use current models for an integrated analysis, multiple different standardization schemes are required and there are standards for storing and exchanging all the necessary information [5].
While focus on individual levels of biological organization has lead to many useful standards, it is not an efficient approach to enable large scale multi-omic data integration. This analysis requires simultaneous integration of multiple variables from different standard data formats. Even with the use of automated tools and established workflows, this process can be cumbersome and laborious. New data formats are generated by the creation of new technologies (ex. ChIP-seq data) and the number of standard data formats continues to increase.
Next, the extension of systems biology tools and results to systems biological engineering or synthetic biology has been hampered by a lack of comprehensive predictive models. Even in the design of a minimal bacterial genome, 17% of necessary genes could not be assigned known functions [11]. Clearly more accurate descriptions are needed to enable efficient manipulations of biological systems and to predict outcomes of economic interest.
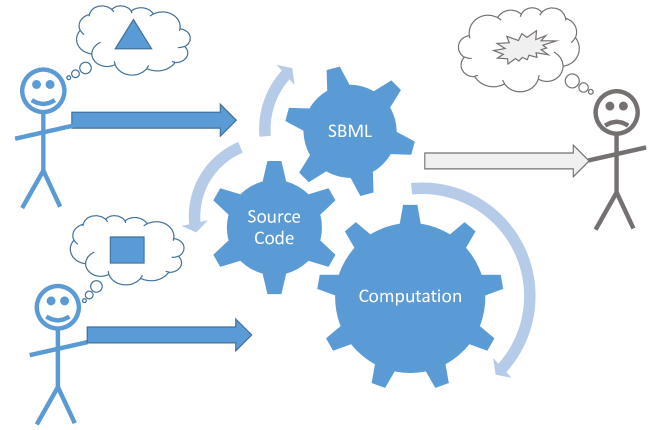
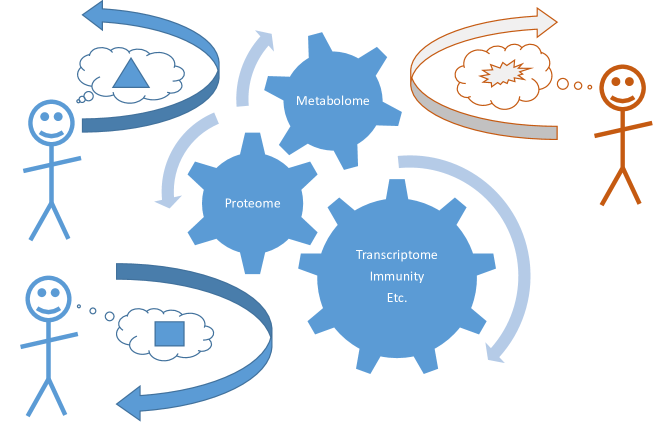
The interoperability of models can occur in a variety of ways. Figure 1 depicts two scenarios of model sharing: (a) source code and/or an SBML representation is used to capture the definition of a model; however, these models could not be used in contexts different from the specific problem for which they were created, and (b) quantitative scientists share algorithms that have been validated with a data set of known properties; however, sharing algorithms, their implementation, and their results is a non-trivial task unless the inputs and outputs of an analytic pipeline are standardized.
An elegant scalable solution to harmonize multi-omic data does not currently exist; while there are already resources in place that can and do make data more accessible, few, if any make it usable to address broad questions without substantial effort. The US National Institutes of Health supports the National Center for Biotechnology Information, which has a collection of resources (GeneBank, OMIM, MMDB, UniGene, Entrez, etc.). NIH also supports four Bioinformatics Resource Centers resulting in 6 community resources: (1) EupathDB focusing in eukaryotic parasites [3, 2], (2) FungiDB focusing on fungal pathogens [22], (3) VectorBase focusing on invertebrate vectors of infectious disease [13, 14, 15], (4) ViPR focusing on viruses [17, 1], (5) IRD focusing exclusively on influenza [21], and (6) PATRIC focusing on bacterial pathogens [20, 24]. Even though all these resources could in principle accommodate multi-omic and clinical data, each one is restricted by their own data access architecture and focus. Therefore, a quantitative model implemented in one database cannot be easily made available to other databases, even if the data consumed by the model is fundamentally the same.
Next, reproducibility of computational research has been identified as one challenge for systems biology [16, 19]. When reproducing computational results, ”forensic bioinformatics, where a scientist must check the input and output data to determine the methods that have been used, must often be used when documentation and directions did not provide enough information [4]. One case study describes a novice user needing 280 hours to reproduce a method [10]. With the fast pace of research and the need to make the most of valuable high-throughput experimental results, computational findings need to be reliable and easy to use [23].
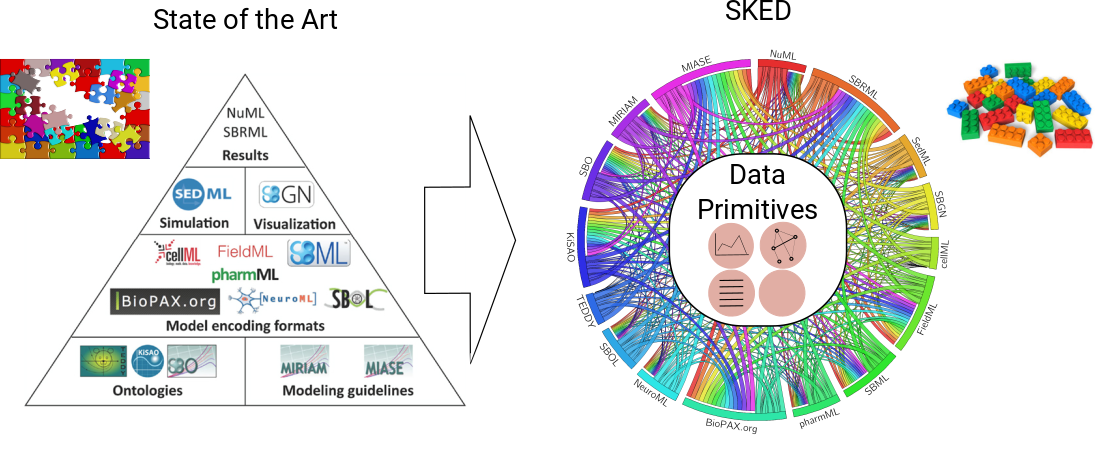
In order to overcome these obstacles, we propose the describe the Scientific Knowledge Extraction from Data (SKED) framework and describe here the use of data primitives as a common currency between analytical methods, thus promoting interoperability, scalability, and reproducibility. Figure 2 describes this paradigmatic shift from many data standards to four data primitives which are inter-converted during analysis. Using data primitives enables a single analytical method to be seamlessly utilized for different contexts. Even though it has been stated that there is no ”one-size-fits-all” standard for biological research[8] and ”top-down standards will not serve systems biology”[18], we believe that our efforts are fundamentally different and that many previous efforts may be combined through the use of data primitives.
2 Methods
Listed below is an overview of the notation and mathematical framework utilized throughout this work. Firstly, let be the set of natural numbers, so that denotes the maximal strictly positive subset of the natural numbers. Additionally, for let be the finite dimensional vector space comprised of -tuples of real numbers. Let be the field of complex numbers, so that for the symbol denotes the space of complex valued -tuples. Furthermore, for denote the set of real valued matrices by . Finally, interval notation is to be interpreted with respect to the underlying ordering (if any) imposed on the elements in the interval.
We define data primitives as a limited set of data structures that could serve as uniform building blocks to access information across different data sources. The concept of data primitives is analogous to using LEGO® blocks to build analysis pipelines, and allow re-purposing and redesign of quantitative methods with little overhead.
Definition 2.1.
Time Series. Let , a time series consisting of time points and variables is a totally ordered set , such that for .
Definition 2.2.
Graph. A triple is called a graph on , where:
-
I
It is assumed that is totally ordered and countable such that , for . The restriction that ensures that the set is nonempty, i.e. . With respect to a particular ordering, the set can be uniquely represented as . The set is called the vertex set and each is known as a vertex.
-
II
For and such that , the edge set is comprised of unordered tuples called edges. It is worth mentioning that where and/or . Also, the case corresponds to , i.e. no edges are present in the graph under consideration.
-
III
Let the symbol denote a correspondence which assigns each element in to an unordered -tuple , where . Denote the set to be the image of under the mapping . In this case, each represents a set of numeric values associated with each edge, presenting e.g. distance, capacity, weight, etc. The assumption is made that is a surjection, i.e. for all , there exists an edge such that , where . In set notation it follows that .
The graph has an associated adjacency matrix with elements given by
Definition 2.3.
Triangulated Mesh. A triple is called a triangulated mesh, provided that the following three conditions are satisfied.
-
I
Let , then for all vertices , there is an edge such that .
-
II
For and , define the set . The set is composed of unordered triples called triangles. Making use of a slight abuse of notation, it is required that for all , there exists a triangle such that .
-
III
Provided two triangles intersect, i.e. , then the vertex or edge responsible for the nonempty intersection is contained in .
Definition 2.4.
Text. A string of characters is stored as text and is used in qualitative descriptions. It may or may not be a part of Metadata, described below.
Definition 2.5.
Metadata. Let the sets of total data, meta data and data obtained from a given experiment be labeled by , and , respectively. The set admits a unique mutually disjoint decomposition with respect to the analysis conducted, i.e. where . Elements of can be thought of as data that provides information about experimentally obtained data, e.g. the instruments used, the instrument operators, dates, etc. For let be a family of mappings such that for each and , we have that . In this case, all of the sets under consideration are countable and finite, as a result
Remark.
A triangulated mesh is a particular case of more general structures called simplices. A -simplex is a -dimensional geometric object with flat sides which is the convex hull of its vertices. The mesh stores the vertex, edge and face information of a given surface or data set and is a piecewise planar surface, i.e. it is planar almost everywhere, except at the edges where the triangles join. In the case where all of the faces are triangles, the mesh is called triangulated. Therefore, a triangulated mesh can be regarded as a collection of triangles in three dimensional space that are connected in a particular way (to form a manifold on the given surface, i.e. each edge is shared by no more than two faces). It is well known that any surface can be estimated by a series of triangles. Each triangle can store additional data at the faces, e.g. colors, with sharp creases stored on edges and continuously varying quantities stored at each vertex. Due to their relatively simple geometric structure, all triangles can be represented as triples. An advantage of using such a mesh lies in the ability to efficiently answer data queries (information requests from a given database), e.g. finding the vertices or edges of a particular face or finding all triangles around a vertex.
3 Results and Discussion
A multi-omic systems biology study of Plasmodium cynomolgi infection in five Macaca mulatta was undertaken as described by Joyner et al [12]. Metabolomic, clinical, and cellular measurements were made daily, while transcriptomic, cytokine, and immune profiling measurements were taken at only seven time points over the course of the experiment. In this experiment, two subjects developed severe malaria while two subjects only experienced mild malarial symptoms. The computational challenge was to integrate this data from multiple time scales and multiple -omic measurements into a biologically relevant conclusion about the molecular and cellular mechanisms differentiating mild vs severe malaria. Figure 3 summarizes the data analysis and integration steps.
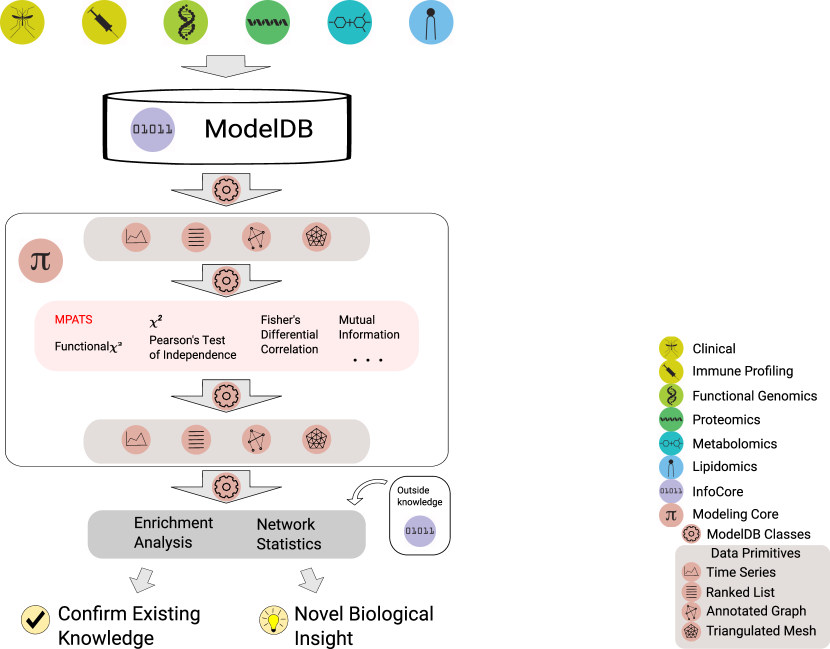
As described in Figure 3, data from multiple types of measurements were first converted into data primitives and stored in a relational database (called ModelDB here) for efficient retrieval. Once the data had been accessed from the database, data primitives were used for the intermediate steps in all calculations, enabling the most significantly changed variables across the data types to be identified. The results of this analysis are described by Yan et al (submitted).
4 Conclusions
Rather than focus on the integration of only one or two data types, data primitives allow the integration of multiple data types in a modular, extensible fashion. Data primitives are the foundation of the SKED framework, in which data primitives are used for data storage to allow integration of large, heterogeneous data sets and increase reproducibility and reliability of computational analyses.
5 Abbreviations
SKED: Scientific Knowledge Extraction from Data
6 Declarations
Acknowledgements
Funding
This project was funded in part by Federal funds from the US National Institute of Allergy and Infectious Diseases, National Institutes of Health, Department of Health and Human Services under contract #HHSN272201200031C, which supports the Malaria Host-Pathogen Interaction Center (MaHPIC).
Availability of data and materials
A public interface featuring the MaHPIC dataset will soon be available at http://euler.math.uga.edu.
Authors’ contributions
All authors have read and approved the final version of the manuscript.
Competing interests
The authors declare that they have no competing interests.
Consent for publication
Not applicable.
Ethics approval and consent to participate
Not applicable.
References
- [1] ViPR: an open bioinformatics database and analysis resource for virology research, author=Pickett, Brett E and Sadat, Eva L and Zhang, Yun and Noronha, Jyothi M and Squires, R Burke and Hunt, Victoria and Liu, Mengya and Kumar, Sanjeev and Zaremba, Sam and Gu, Zhiping and others, journal=Nucleic acids research, volume=40, number=D1, pages=D593–D598, year=2012, publisher=Oxford Univ Press,.
- [2] Cristina Aurrecoechea, Ana Barreto, John Brestelli, Brian P Brunk, Shon Cade, Ryan Doherty, Steve Fischer, Bindu Gajria, Xin Gao, Alan Gingle, et al. EuPathDB: the eukaryotic pathogen database. Nucleic acids research, page gks1113, 2012.
- [3] Cristina Aurrecoechea, John Brestelli, Brian P Brunk, Steve Fischer, Bindu Gajria, Xin Gao, Alan Gingle, Greg Grant, Omar S Harb, Mark Heiges, et al. EuPathDB: a portal to eukaryotic pathogen databases. Nucleic acids research, 38(suppl 1):D415–D419, 2010.
- [4] Keith A. Baggerly and Kevin R. Coombes. Deriving chemosensitivity from cell lines: Forensic bioinformatics and reproducible research in high-throughput biology. Ann. Appl. Stat., 3(4):1309–1334, 12 2009.
- [5] Frank T Bergmann, Richard Adams, Stuart Moodie, Jonathan Cooper, Mihai Glont, Martin Golebiewski, Michael Hucka, Camille Laibe, Andrew K Miller, David P Nickerson, et al. Combine archive and omex format: one file to share all information to reproduce a modeling project. BMC bioinformatics, 15(1):369, 2014.
- [6] A. N. Cameron, M. T. Houston, and J. B. Gutierrez. A Review of Mathematical Models for Muscular Dystrophy: A Systems Biology Approach. ArXiv e-prints, October 2016.
- [7] Joseph Dada and Joseph Dada. SBRML- A Markup Language for Encoding Systems Biology Results. Nature Precedings, September 2011.
- [8] Andreas Drager and Bernhard A. Palsson. Improving Collaboration by Standardization Efforts in Systems Biology. Frontiers in Bioengineering and Biotechnology, 2, December 2014.
- [9] Andreas Dräger and Bernhard Ø Palsson. Improving collaboration by standardization efforts in systems biology. Frontiers in bioengineering and biotechnology, 2, 2014.
- [10] Daniel Garijo, Sarah Kinnings, Li Xie, Lei Xie, Yinliang Zhang, Philip E. Bourne, and Yolanda Gil. Quantifying Reproducibility in Computational Biology: The Case of the Tuberculosis Drugome. PLoS ONE, 8(11):e80278, November 2013.
- [11] Clyde A. Hutchison, Ray-Yuan Chuang, Vladimir N. Noskov, Nacyra Assad-Garcia, Thomas J. Deerinck, Mark H. Ellisman, John Gill, Krishna Kannan, Bogumil J. Karas, Li Ma, James F. Pelletier, Zhi-Qing Qi, R. Alexander Richter, Elizabeth A. Strychalski, Lijie Sun, Yo Suzuki, Billyana Tsvetanova, Kim S. Wise, Hamilton O. Smith, John I. Glass, Chuck Merryman, Daniel G. Gibson, and J. Craig Venter. Design and synthesis of a minimal bacterial genome. Science, 351(6280), 2016.
- [12] Chester Joyner, Alberto Moreno, Esmeralda VS Meyer, Monica Cabrera-Mora, Jessica C Kissinger, John W Barnwell, and Mary R Galinski. Plasmodium cynomolgi infections in rhesus macaques display clinical and parasitological features pertinent to modelling vivax malaria pathology and relapse infections. Malaria Journal, 15(1):451, 2016.
- [13] Daniel Lawson, Peter Arensburger, Peter Atkinson, Nora J Besansky, Robert V Bruggner, Ryan Butler, Kathryn S Campbell, George K Christophides, Scott Christley, Emmanuel Dialynas, et al. VectorBase: a home for invertebrate vectors of human pathogens. Nucleic Acids Research, 35(suppl 1):D503–D505, 2007.
- [14] Daniel Lawson, Peter Arensburger, Peter Atkinson, Nora J Besansky, Robert V Bruggner, Ryan Butler, Kathryn S Campbell, George K Christophides, Scott Christley, Emmanuel Dialynas, et al. VectorBase: a data resource for invertebrate vector genomics. Nucleic acids research, 37(suppl 1):D583–D587, 2009.
- [15] Karine Megy, Scott J Emrich, Daniel Lawson, David Campbell, Emmanuel Dialynas, Daniel ST Hughes, Gautier Koscielny, Christos Louis, Robert M MacCallum, Seth N Redmond, et al. VectorBase: improvements to a bioinformatics resource for invertebrate vector genomics. Nucleic acids research, 40(D1):D729–D734, 2012.
- [16] Roger D Peng. Reproducible research in computational science. Science, 334(6060):1226–1227, 2011.
- [17] Brett E Pickett, Douglas S Greer, Yun Zhang, Lucy Stewart, Liwei Zhou, Guangyu Sun, Zhiping Gu, Sanjeev Kumar, Sam Zaremba, Christopher N Larsen, et al. Virus pathogen database and analysis resource (ViPR): A comprehensive bioinformatics database and analysis resource for the coronavirus research community. Viruses, 4(11):3209–3226, 2012.
- [18] John Quackenbush, Christian Stoeckert, Catherine Ball, Alvis Brazma, Robert Gentleman, Wolfgang Huber, Rafael Irizarry, Marc Salit, Gavin Sherlock, Paul Spellman, et al. Top-down standards will not serve systems biology. Nature, 440(7080):24, 2006.
- [19] Geir Kjetil Sandve, Anton Nekrutenko, James Taylor, and Eivind Hovig. Ten simple rules for reproducible computational research. PLoS Comput Biol, 9(10):e1003285, 2013.
- [20] EE Snyder, N Kampanya, J Lu, Eric K Nordberg, HR Karur, Maulik Shukla, Jeetendra Soneja, Y Tian, Tian Xue, H Yoo, et al. PATRIC: the VBI pathosystems resource integration center. Nucleic acids research, 35(suppl 1):D401–D406, 2007.
- [21] R Burke Squires, Jyothi Noronha, Victoria Hunt, Adolfo García-Sastre, Catherine Macken, Nicole Baumgarth, David Suarez, Brett E Pickett, Yun Zhang, Christopher N Larsen, et al. Influenza research database: an integrated bioinformatics resource for influenza research and surveillance. Influenza and other respiratory viruses, 6(6):404–416, 2012.
- [22] Jason E Stajich, Todd Harris, Brian P Brunk, John Brestelli, Steve Fischer, Omar S Harb, Jessica C Kissinger, Wei Li, Vishal Nayak, Deborah F Pinney, et al. FungiDB: an integrated functional genomics database for fungi. Nucleic acids research, page gkr918, 2011.
- [23] Dagmar Waltemath, Ron Henkel, Felix Winter, and Olaf Wolkenhauer. Reproducibility of Model-Based Results in Systems Biology. In Aleš Prokop and Béla Csukás, editors, Systems Biology, pages 301–320. Springer Netherlands, Dordrecht, 2013. DOI: 10.1007/978-94-007-6803-1_10.
- [24] Alice R Wattam, David Abraham, Oral Dalay, Terry L Disz, Timothy Driscoll, Joseph L Gabbard, Joseph J Gillespie, Roger Gough, Deborah Hix, Ronald Kenyon, et al. PATRIC, the bacterial bioinformatics database and analysis resource. Nucleic acids research, page gkt1099, 2013.