Trigger of successive filament eruptions observed by SDO and STEREO
keywords:
Sun: filaments, prominences; Sun: magnetic fields; Sun: corona; Sun: sunspots1 Introduction
S-Introduction
Filaments/prominences are chromospheric and coronal structures, which contain relatively cool, dense plasma suspended along the polarity inversion line (PIL). Flares and CMEs are often associated with filament eruptions (Schmieder et al., 2002; Gopalswamy et al., 2003), which eventually affect space weather. The fundamental processes responsible for these eruptions originate in the magnetic fields of the solar atmosphere (Priest and Forbes, 2002).
According to flux rope model (e.g., van Ballegooijen and Martens, 1989), the filament mass is supported in the dips of helical field lines. To understand the relation between the filament mass and corresponding supporting magnetic structure, Gilbert, Alexander, and Liu (2007) categorized filament eruptions observationally as “full”, “partial” and “failed” eruptions, depending on the site of magnetic reconnection. In case of a “full eruption”, the reconnection takes place below the flux rope and most of the filament mass ( 90%) escapes along with the entire flux rope structure. But for the “failed eruption”, reconnection occur above the flux rope that suppress the filament downward. In case of a “partial eruption”, reconnection may occur within the filament material that leads to the eruption of a portion of the filament.
Several observations show that activity occurring near the filament is important during its pre-eruption phase. Small-scale magnetic reconnection occurring during the pre-eruptive phase may trigger flares which involve large-scale reorganization of the magnetic connections (e.g., Toriumi et al., 2013; Kusano et al., 2012). Therefore, it is very important to know the location and height of the small-scale reconnection sites. Several models proposed to examine the role of the initial magnetic reconnection which set up the conditions that are favorable for the magnetic core fields to erupt. One of the mechanisms is ‘tether cutting’ in which implosive/explosive reconnection occurs within the twisted and deep sheared core field of a bipole above the polarity inversion line (PIL) of the arcade (Moore and Roumeliotis, 1992; Moore and Labonte, 1980; Moore et al., 2001). In this model the magnetic reconnection occurs in such away that it forms a flux rope as well as it triggers the eruption. Initially filaments often undergo relatively slow rising motion before the onset of eruptions (Kahler et al., 1988; Liewer et al., 2009; Nagashima et al., 2007; Sterling, Harra, and Moore, 2007; Xu, Jing, and Wang, 2010; Sterling, Moore, and Freeland, 2011). These early slow rise motion was considered as one of the reason to trigger the eruption (Moore and Sterling, 2006; Sterling, Harra, and Moore, 2007; Sterling et al., 2010). A transient brightening at or near the polarity inversion line (PIL), coincident with emerging and/or canceling magnetic flux has been observed and are considered as precursors of the flare and filament eruption (Martin, 1980; Chifor et al., 2007; Kim et al., 2007; Liu et al., 2009; Sterling, Moore, and Freeland, 2011).
Antiochos, DeVore, and Klimchuk (1999) proposed ‘breakout’ model, in which the topology of photospheric magnetic field is quadrupolar which plays a crucial role for the CME initiation. The basic idea of this model is that magnetic reconnection at a null point in the corona above a sheared neutral line, removes the constraint of the higher magnetic flux tends to hold down the sheared low-lying field and thereby triggers the sheared core field to erupt explosively outward (Antiochos, 1998; Antiochos, DeVore, and Klimchuk, 1999; Karpen, Antiochos, and DeVore, 2012). In the context of both models, the role of magnetic reconnection for the eruption can be investigated during the pre-eruption phase.
The magnetic reconnection can also occur at low level in the solar atmosphere (e.g., Wang and Shi, 1993). It may be observed at the photosphere as a cancellation of magnetic features (Priest, Parnell, and Martin, 1994). Flux cancellation (Martin, Livi, and Wang, 1985) is the process where the magnetic flux disappears at the PIL; as formulated by van Ballegooijen and Martens (1989). The flux cancellation at the polarity inversion line can lead to the coronal structure evolving towards highly sheared fields which eventually can erupt in the later stage (Green, Kliem, and Wallace, 2011). The gradual flux cancellation continuing over an extended period can trigger the filament eruption (e.g., Sterling et al., 2010; Zuccarello et al., 2007).
Filament eruptions occur in a very short time scale as compared to the time scale of the coronal magnetic energy accumulation, hence there should be MHD instability related to the trigger of the eruption. Therefore, different instability mechanisms have been evoked (review by Forbes, 2000). Numerical MHD simulations of the kink instability suggest that if the twist of the flux rope exceeds a critical value, then flux rope becomes unstable (e.g., Hood and Priest, 1979, Török and Kliem, 2003, Török, Kliem, and Titov, 2004). This value depends on the aspect ratio of the loop, the ratio of the plasma to magnetic pressure. Previous observational studies support the kink instability to be the triggering mechanism for the solar eruptions (e.g., Srivastava et al., 2010, Kumar et al., 2012, Kumar and Cho, 2014). One of the example of a filament eruption studied by Yan et al. (2014) for the active region NOAA 11485 showed that the leg of the filament rotated up to 2.83 around the axis of the filament with a maximum rotation speed 100 degrees/minute. This study indicates that the kink instability is the trigger mechanism for the solar filament eruption.
The filament/flux rope can experience an another type of instability called “torus instability”(e.g., Kliem and Török, 2006, Zuccarello et al., 2014, Dhara, Ravindra, and Banyal, 2014). Some pre-eruptive processes, such as flux cancellation/emergence at the neutral line and magnetic reconnection during the observed brightening, initiate the eruption by bringing the flux rope to a height of torus instability. Using MHD numerical simulations in a 3D spherical geometry of emergence of a flux rope from the subsurface into the magnetized corona, Fan and Gibson (2007) finds that when the background magnetic field decreases slowly with height, a strongly-twisted flux tube emerging out of the solar surface can rupture through the arcade field via kink instability. But when the background magnetic field decreases rapidly with height, then the flux rope can become unstable to the lateral expansion and then it erupts. This kind of loss of equilibrium could be interpreted as torus instability (Chen, 2011). In this model, a current ring of major radius is embedded in an external magnetic field (). The current rings are subjected to a radially outward-directed hoop force. When the ring expands, the hoop force decreases. If the inward-directed Lorentz force due to the external field () decreases faster with radius than the hoop force, the system is unstable to perturbations. The decay index for a current ring of major radius and embedded in an external field , is defined as follows (Zuccarello et al., 2014):
| (1) |
Assuming external magnetic field , Bateman (1978) numerically showed such an instability will occur when = 1.5.
In this paper, we study the origin of two successive filament eruptions (F1 & F2) that occurred in AR NOAA 11444, observed by SDO and STEREO. Here we present the important morphological changes in and around the filament prior to eruptions and the possible triggering mechanism of the filament eruptions (F1 and F2). This paper is organized as follows. In the next section, we describe about the different instruments and data used in this study. A brief description about filament and a sequences of the events in the corona, chromosphere as well as at the photosphere are presented in Section \irefsection3. Finally, we discuss our results in Section \irefsection4.
2 Instruments and Data
section2
We used the EUV images obtained from Atmospheric Imaging Assembly (AIA; Lemen et al., 2012) on board the Solar Dynamics Observatory (SDO; Pesnell, Thompson, and Chamberlin, 2012) to study the filament eruption in detail. In particular we have used data obtained in AIA 171, 193 and 304 Å channels which correspond to the corona and chromosphere. We have used Level-1.0 data. We used routine available in SSW packages to co-align the images from all of the AIA channels (171, 193 and 304 Å). From these data set the filament regions are extracted and tracked over time. These images are obtained with a cadence of 12 seconds and a pixel resolution of 0.6′′. We acquired the data starting from 22:00 UT on March 26, 2012 until 07:00 UT on March 27, 2012 which covers activation of the filament eruption and subsequent runaway motion for the entire event. To study the filament eruption above the solar limb, we also used EUVI 304 and 195 Å images from the Sun-Earth Connection Coronal and Heliospheric Investigation (SECCHI; Howard et al., 2008) onboard the Solar-Terrestrial Relations Observatory-A (STEREO; Kaiser et al., 2008). The EUVI’s 20482048 pixel detectors have a field of view out to 1.7 solar radii, which completely covered this filament eruption event.
The morphology of the filament at chromospheric heights can be studied with H images. We obtained full-disk H images from Global Oscillation Network Group (GONG; Harvey et al., 1996) which collects H images at six sites around the world. The dark, flat, smear corrected and compressed H images are available with almost 1-minute cadence. These H images are obtained with 2k2k pixel CCD camera whose pixel resolution is about 1′′. We acquired H images starting from 23:00 UT on March 26, 2012 until 06:00 UT on March 27, 2012. The data set covers first and second eruption of the filament and subsequent flares.
In order to examine the changes in the photospheric magnetic field near the filament footpoints, we utilized the full-disk line-of-sight magnetograms at level-1.0 from Helioseismic and Magnetic Imager (HMI; Scherrer et al., 2012) with a cadence of 45 seconds. The line-of-sight magnetogram has pixel resolution of 0.5′′. We used routine available in SSW packages to upgrade HMI magnetogram to level-1.5 from level-1.0 so that it is interpolated to the AIA pixel-resolution. We have tracked the ROI by utilizing the heliographic co-ordinate information and finally corrected for the line-of-sight effect by multiplying 1/cos, where is the heliocentric angle. We then averaged 4 magnetograms to reduce the noise level (Liu et al., 2012) to about 10 G. These magnetograms have been used to study the evolution of magnetic fields in and around the filament at the photospheric level.
3 Observations and Results
section3
3.1 AIA observations of the filament eruption
The filament was observed in the active region (AR) NOAA 11444 at the location of N19 E26 on March 23, 2012 and survived for almost 3 days. On March 27, 2012, before the eruption, the filament was observed at heliographic position of N21 W17. The filament appeared as inverse J shaped in H (top-left), He II 304 (top-right), 193 Å (bottom-left) and 171 Å (bottom-right) images in Figure \ireffig:ch1_1, respectively. The arrow followed by letter ‘T’ in Figure \ireffig:ch1_1 show the filament and the arrow followed by letter ‘A’ in H image indicates the location of the protrusion which appears as barb. The appearance of the filament in the coronal images (193 and 171 Å) are also shown in Figure \ireffig:ch1_1 (bottom-left and right, respectively). The filament followed the polarity inversion line. The northern end of the filament rooted in compact negative polarity plage region and the southern portion ended in the positive polarity plage. The axial field component of the filament is right bearing when we look at the filament from positive polarity side. This corresponds to the dextral chirality and is consistent with hemispheric helicity rule (Martin, 1998; Martin, Bilimoria, and Tracadas, 1994). It was confirmed further in erupting filament. The erupting filament (shown in Figure \ireffig:171_hel_img) shows a crossing of dark and bright threads in 171 Å image. The crossing of dark features over the bright regions is easily identified in the zoomed image, where a bright feature in the background is seen going from left to right while the dark feature in the foreground crosses it from right to left. This crossing threads correspond to the negative mutual (type III) helicity (Chae, 2000).
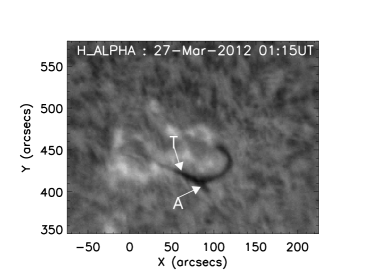
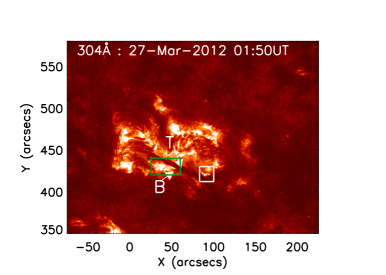
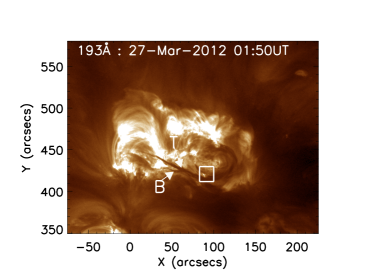
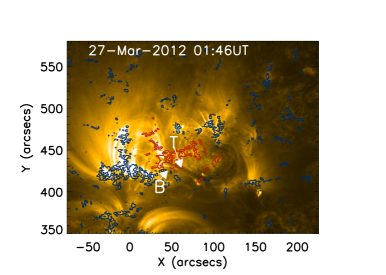
fig:ch1_1
The filament seems to have two structures. One is broad inverse J shaped which is visible in H–6563 Å, AIA 171, 193 and 304 Å wavelengths. This filament region is shown by an arrow with letter ‘T’ symbol, indicating the top most filament. One more thin filament lying below the top filament or it could be just a bifurcation of the main filament, shown by an arrow with ‘B’ symbol. It appears to start at a location of 35′′ in the horizontal direction and at 425′′ in the vertical direction in EUV images. It bends down at 45′′ and later continues with the main ‘T’ filament, also taking inverse J shape. The bottom side or bifurcated filament is shown by the letter ‘B’ in Figures \ireffig:ch1_1.
In order to study the filament eruption in detail, we created an online movie111Movies (AIA304.avi and AIA171.avi) generated from SDO/AIA 171 and 304 Å images, respectively, of the filament eruption associated with active region NOAA 11444 are available in the electronic version of the manuscript. of the erupting filament in 304 and 171 Å channel of AIA. The movie clearly shows that the filament erupted in two stages. In the first stage, the southern part of the filament erupted. This eruption is followed by a C5.3 class flare identified by GOES detector at 02:52 UT. The second eruption initiated at around 3:50 UT during which the northern part of the filament erupted and accelerated at 4:20 UT followed by a C1.7 class flare at 04:25 UT.
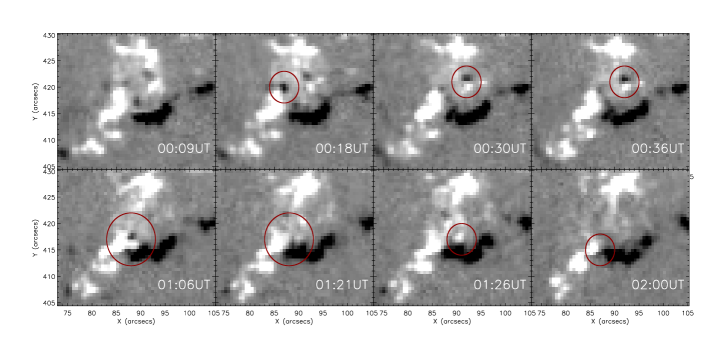
The contours of photospheric magnetic fields overlaid upon the 171 Å images, shown in Figure \ireffig:ch1_1 (bottom-right), indicate that the filament is lying along the neutral line and the southern portion of the filament ending in the bipolar regions where the flux cancellation was observed. The jet in the cusp shaped regions observed close to the filament is shown by white boxed region in the 304 and 193 Å wavelengths in Figure \ireffig:ch1_1. Over the period of 2.5 hrs starting from 00:00 UT to 02:30 UT (on March 27, 2012), jets are repeatedly observed in this region. The photospheric magnetograms showed repeated emergence and cancellations of magnetic flux at the same site. Figure \ireffig:ch1_3 shows the sequence of line-of-sight magnetograms for the same location at different times during the observations of jet. The emergence and cancellation of magnetic flux regions are marked by circles in the time sequence of magnetograms.
3.2 Pre-flare brightening and filament eruptions (F1 & F2)
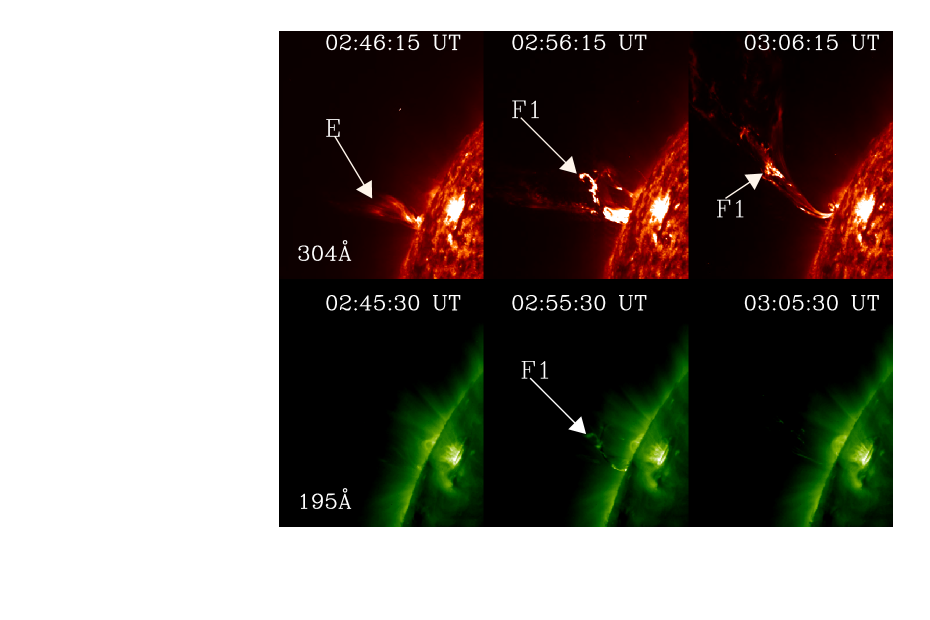
A brightening was observed starting at 01:56 UT below the filament T. The brightening location is shown in 304 Å channel by a green box in Figure \ireffig:ch1_1 (top-right). The brightening was followed by a bright plasma flow which moved from east end of the filament to the west. During the flow, the filament appeared as a sequence of bright and dark threads. The bright flow reached the barb location at 02:03 UT. During that time the bifurcated filament (B) moved up a little and also raised the top filament (T). At around 2:35 UT the separation between the bright and dark threads of the filament became large and in the west side, one end of the filament started to move upward. At around 2:53 UT there was a C5.3 class flare and during that time a large amount of bright mass was ejected along with the filament eruption (F1). Figure \ireffig:stereo_1 shows the sequence of STEREO-A/EUVI 304 Å and 195 Å images during the eruption of F1. The first panel of Figure 4 (top) shows the bright upward flow/jet which is seen in 304 images before the eruption. The middle and last panel shows the eruption of the filament. The estimated speed of filament eruption (F1), computed from 304 Å images, is 274 11 km/s. The formation of a close underlying flare loop, observed in the 195 Å image during the jet, suggests the magnetic reconnection as a driver of jet and associated filament eruption.
Soon after the eruption of F1, we observed the activation of filament F2 that does not erupt and remains stationary for a longer period. This filament (F2) is shown by an arrow in 171 Å image in Figure \ireffig:ch1_8 (top). At around 4:20 UT this filament also started to erupt followed by a C1.7 class flare. The filament disappeared from the field-of-view at around 4:30 UT in the AIA 171 Å images.
3.3 Temporal evolution of filament eruptions and flares
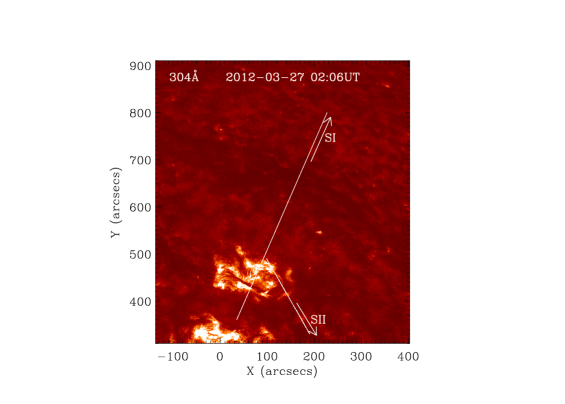
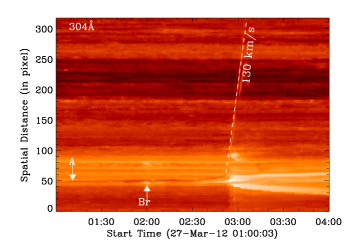
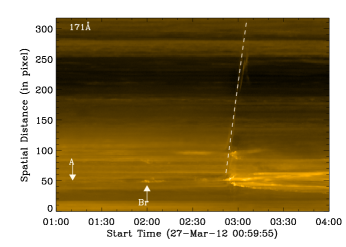
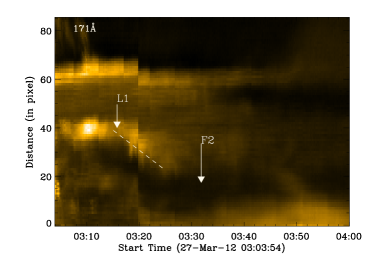
To investigate the temporal evolution of the successive filament eruptions and associated flare activities, we constructed TD maps from a series of AIA 304 and 171 Å images starting from 01:00 UT on March 27, 2012. The TD map for the first filament eruption is extracted from slit-I and the second eruption is extracted from slit-II (shown in Figure \ireffig:ch1_5 (top)). The TD maps shown in Figure \ireffig:ch1_5 are extracted from 304 and 171 Å images. The position of the filament in TD map generated from 304 Å images (middle-left image), is shown by an arrow ‘A’. There was a pre-flare brightening close to the filament at 01:56 UT. The location of the brightening in TD map is shown by an arrow ‘Br’. A similar brightening is also visible in other TD map, generated from 171 Å images (bottom-left). Later, the filament showed slow-rise motion at a projected speed of 1.50.3 km s-1. At around 2:30 UT, there was another brightening which is related to the C5.3 class flare. The filament rose faster during this time. This location is indicated by a vertical line close to the filament in TD map. The flare maximum occurred at around 3:08 UT. The filament accelerated during the flare and erupted with a projected speed of 1303 km/sec.
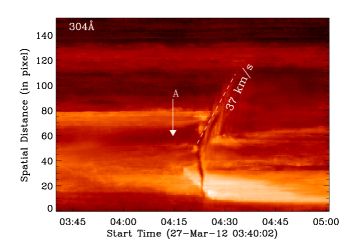
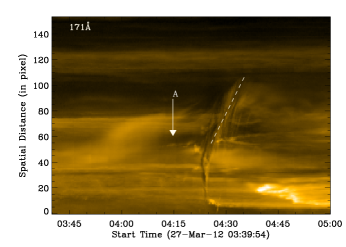
The second filament F2 erupted in a different manner compared to the previous eruption. After its activation, filament seems to have a counter clockwise motion and then moved away towards the south. This filament accelerated and erupted with a projected speed of 372 km/sec. This event was followed by the C1.7 class flare. Figure \ireffig:stereo_2 shows the sequence of STEREO-A/EUVI 304 Å and 195 Å images during eruption of the filament (F2) in second phase. The speed during eruption of F2 on the sky plane estimated from these 304 Å images was about 14510 km/sec.
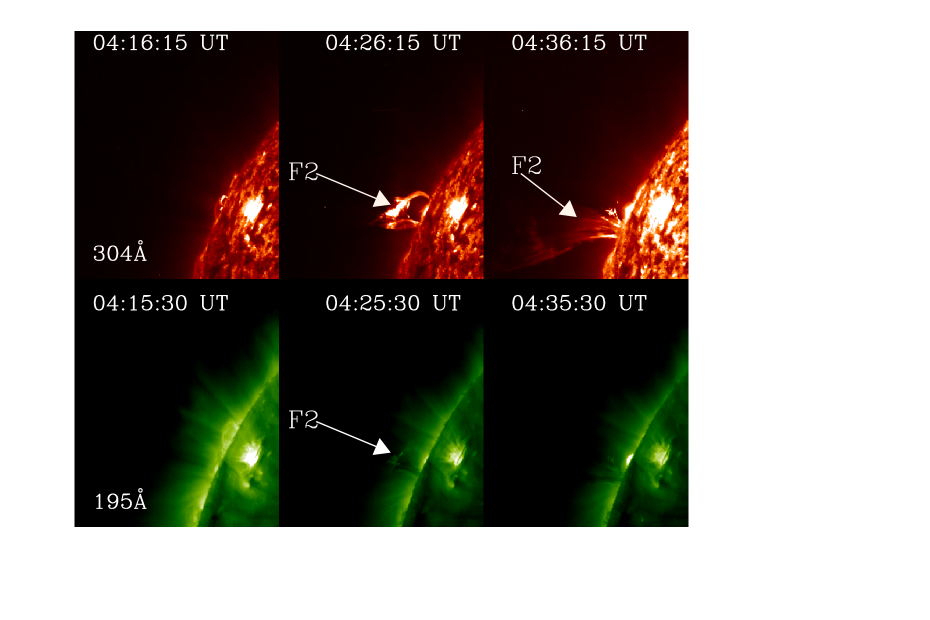
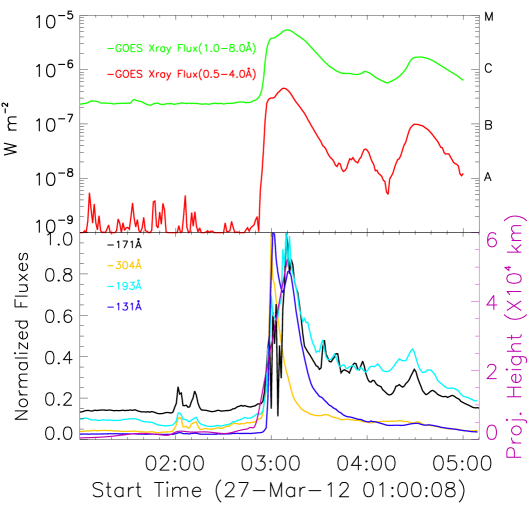
Figure \ireffig:ch1_6 (bottom panel) shows the intensity profiles in the AIA 171, 304, 131 and 193 Å channels. The pre-flare brightening was observed below the filament. The light-curve is obtained by integrating the intensity in a small region (green colored box) shown in the AIA 304 Å image (Figure \ireffig:ch1_1 (top-right)). The light-curves showed a small rise at around 01:56 UT in the boxed region. The TD maps indicated that the filament activation started at the same time. Later, at around 2:50 UT there was a jump in the GOES X-ray curve in the 1.0–8.0 Å band. At the same time we observed a jump in intensity for all the 304, 131, 171, and 193 Å wavelength bands. Therefore, the EUV and X-ray flux profiles are consistent. The brightening in the GOES and in other EUV wavelengths reached the background level over a period of about 40 minutes after the flare. During the initiation of the C5.3 flare, the filament showed an acceleration and eventual eruption. Interestingly, GOES soft X-ray flux profiles reveal a small B-class flare (peak around 03:56 UT) between these two filament eruption. However, it can not be distinguished in the EUV light curves. This flare was associated with the eruption of an overlying loop arcade prior to the successful eruption of filament F2.
3.4 Contraction of a coronal loop in the first phase
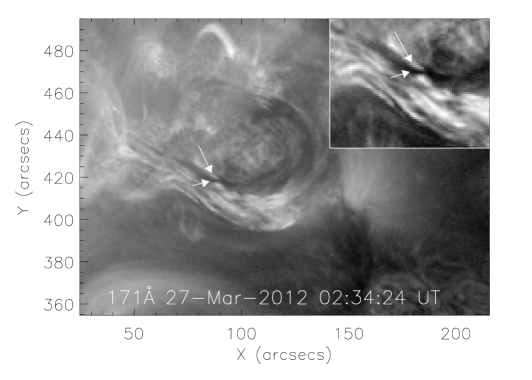
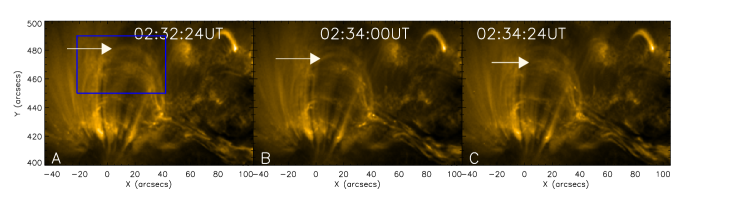
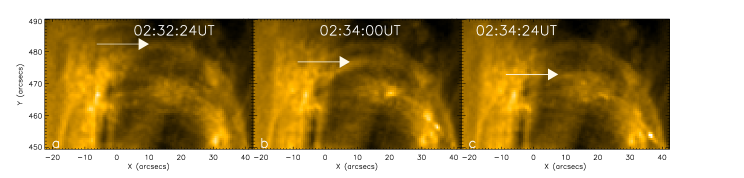
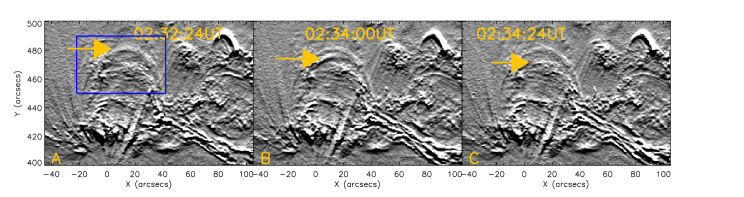
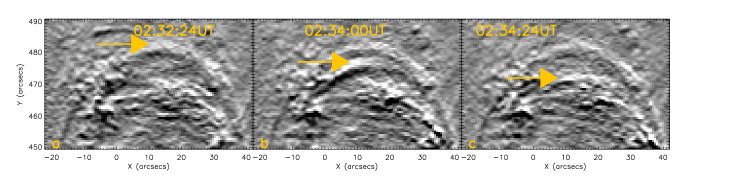
Just a few minutes before the eruption F1, there was an contraction of coronal loop on the eastern part of the filament. The loop contraction was observed during 2:32-2:35 UT. Figure \ireffig:ch1_7 (top – 1st panel) shows the contraction of the coronal loop in a sequence of 171 Å images in different time epoch. Magnified portion of the contracting loop regions (blue boxed region) are shown in Figure \ireffig:ch1_7 (top – 2nd panel) for the corresponding time of the top – 1st panel images. The time sequence of high-pass filtered 171 Å images for the contraction loop are shown in Figure \ireffig:ch1_7 (bottom – 1st panel) for better contrast. Magnified portion of the contracting loop regions (blue boxed region) are shown in Figure \ireffig:ch1_7 (bottom – 2nd panel) for the corresponding time of the bottom – 1st panel filtered images. These high-pass filtered images are obtained by using the wavelet transform (Young, 2007). The contracted loop is shown by arrow in every images in both the panels. During collapsing period it covered about 15′′ in height. Later, though its signature is not visible due to the weakening of its brightness, we do see falling of material on to the filament at 2:37 UT indicating the collapsing loop reaching the filament location at that time. Soon after the collapse of the loop the filament started to erupt.
3.5 Simultaneous contraction and expansion of arcade loops
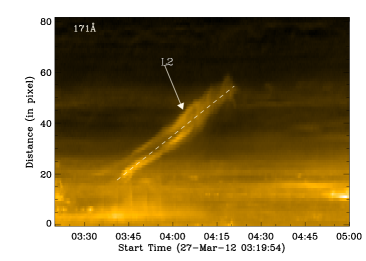
After the first eruption (F1), the north-west portion of the filament activated. One of the post-flare loops started to shrink over the filament which is shown by an arrow (L1) in Figure \ireffig:ch1_8 (top). The space–time plot along the slit (overlaid on Figure \ireffig:ch1_8 (top-1st image)) shows the contraction of the loop. The space–time plot is shown in Figure \ireffig:ch1_9 (left). The filament (F2) and contracting loop (L1) are shown in this plot. The contracting loop was also visible in the AIA 193, 211 and 335 Å channels. The loop height reduced over the time. Once the shrinking loop disappeared in the AIA 171 Å channel, the dark material in the filament appeared to be moving towards western side at 3:40 UT. After this, several loops around the filament cooled down and the length of the dark filament increased in size at 4:15 UT.
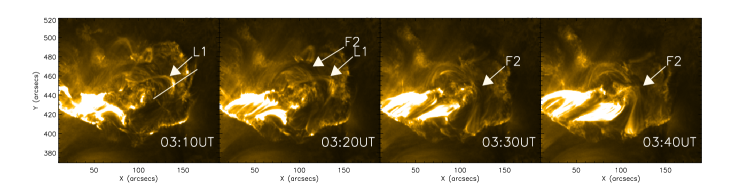
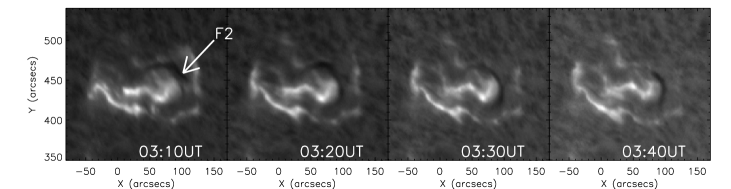
In sequence of H images, the shrinking loop was not visible, but the motion of the dark material in the filament channel was visible over the time. At 3:20 UT, a dark arc shaped filament in the northern portion of the two-ribbon flare was visible and is shown in Figure \ireffig:ch1_8 (bottom).
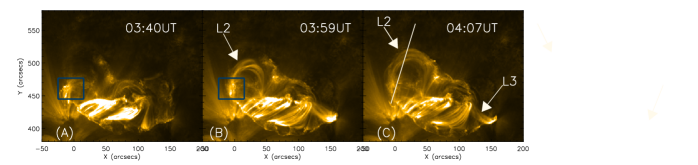
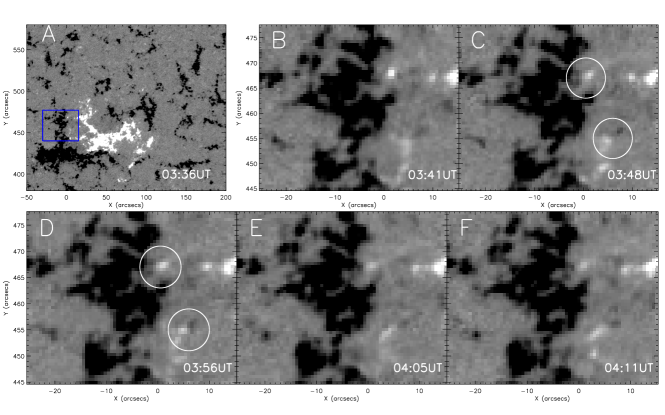
Near the east side of the filament, several loops were visible. At around 03:45 UT, there was a radially outward expansion of these loops in the active region, as shown in a sequence of 171 Å images in Figure \ireffig:ch1_10 (panel A–F). The arrow followed by ‘L2’ shows the expanding loops. A small brightening was observed at around 03:40 UT in EUV channel in the eastern footpoint location of the expanding loop. This brightening location is shown by a blue rectangular box in Figure \ireffig:ch1_10 (panel A & B) in the 171 Å channel.
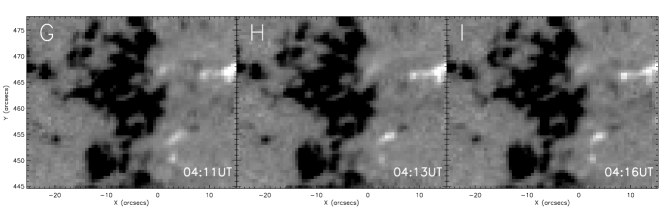
In the brightening location, a small-scale magnetic flux cancellation was observed (shown in boxed region in Figure \ireffig:ch1_10a (panel A)). The magnified view of the box region in magnetograms is also shown in the same Figure \ireffig:ch1_10a (panel B – I) with time. In the magnified magnetograms, the circled region show the canceling features wherein the positive polarity region moved towards the negative region and eventually canceled.
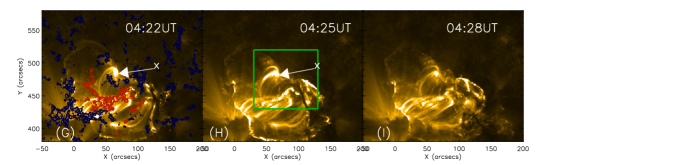
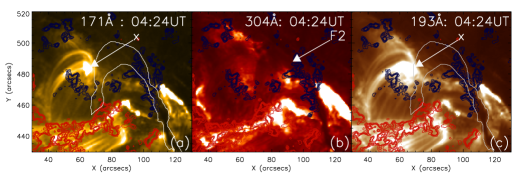
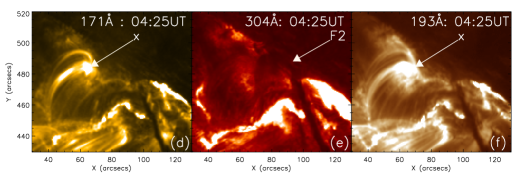
During the time period 03:45 UT to 04:21 UT expanding loops reached about 60′′ in height from initial position with a projected speed of 202.3 km/sec, while the collapsing coronal loops came down by 35′′ with a projected speed of 122.0 km/sec. During the rise of the loop, a brightening was seen in the adjacent loop top. This brightened loop was cusp shaped, as shown by white an arrow ‘x’ in the sequence of 171 Å images in Figure \ireffig:ch1_10 (panels F – J). The magnified view of the green boxed region (shown in Figure \ireffig:ch1_10 (panel J)) are shown in 171, 304 and 193 Å wavelengths in the panels (a – f) of Figure \ireffig:ch1_10. The brightened cusp shaped loop shown by arrow ‘x’, is visible in 171 and 193 Å channels, but not in 304 Å channel. The erupting filament is shown by arrow ‘F2’ in 304 Å channel. The contour of the erupting filament extracted from 304 Å channel (panel b) is overlaid on the 171 and 193 Å channels, shows the position of the filament. This brightened loop was visible from 04:16 UT until 04:27 UT. The brightening could be due to the reconnection between the rising and overlying loops. At the same time the filament activated and started to rise. The top coronal loop on the western side of the filament started to collapse at the time 03:59 UT. The arrow followed by ‘L3’ in Figure \ireffig:ch1_10 (panel C & D) shows the collapsing of the coronal loops. Later, the filament rose to higher heights and the overlying loop in the western footpoint collapsed. While erupting, the filament appeared to be twisted and eventually disappeared. In summary, on the east side of the filament, the loops moved in upward direction and expanded. On the west side of the filament the loops moved in downward direction and shrunk.

3.6 Magnetic field evolution
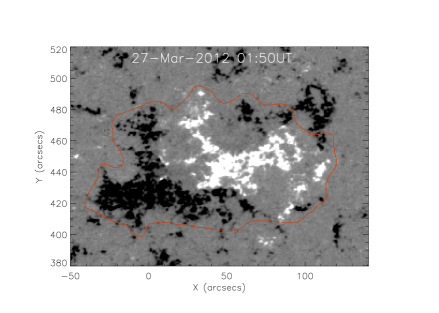
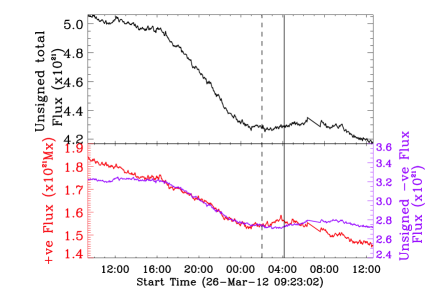
fig:ch1_12
The magnetogram shows the filament location near the PIL of the two opposite polarity plage regions (Figure \ireffig:ch1_1 (bottom-right)). The HMI magnetogram movie (hmi.avi) shows the interaction/cancellation of opposite polarity magnetic regions at the PIL. This region also showed a pre-flare brightening at around 01:56 UT on March 27, 2012. The flux cancellations near the PIL could be a cause for the preflare brightening near the filament.
Figure \ireffig:ch1_12 (left) shows the magnetogram few minutes before the pre-flare brightening. Magnetic flux in the active region was computed within the contoured region shown in Figure \ireffig:ch1_12 (left). This contour encloses the bipolar region of interest. Figure \ireffig:ch1_12 (right) shows the calculated negative and positive fluxes for this contoured region. In the beginning there was a slight difference in the magnetic flux of both polarities. The flux starts to decrease in both the polarities from the beginning of observations. However, in the negative polarity region the flux started to decrease clearly after 16:00 UT. The flux decreased at a rate of 2.521019 Mx/hr in the positive and 5.89 1019 Mx/hr in the negative polarity regions over 9 hours time period starting from 16:00 UT on March 26, 2012. When the flux decrease is stopped we observed the first filament eruption followed by the C5.3 class flare (shown by dashed line in the plot). The second event occurred when there was a slight increase of negative flux and decrease in positive flux (shown by solid line in the plot). The temporal evolution of the flux suggests that there was a continuous cancellations of the flux in this region.
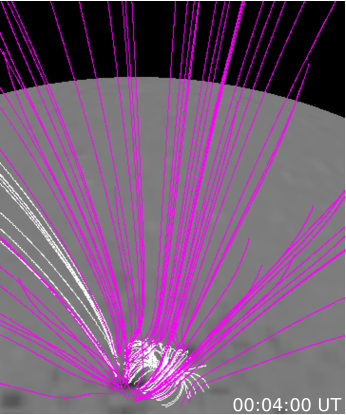
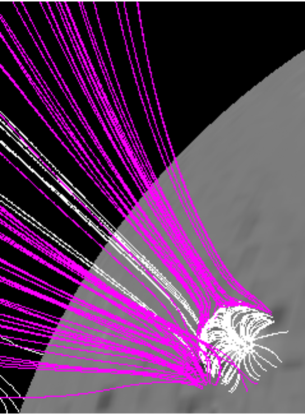
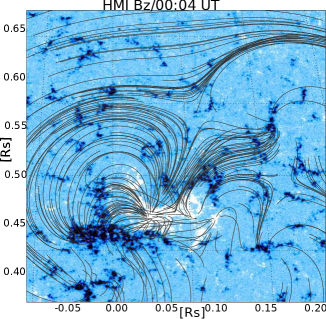
To explore the magnetic topology of the active region, we performed the potential field extrapolation using a HMI magnetogram at 00:04:00 UT on March 27, 2012. Figure \ireffig:pfss1 (left panel) displays the potential field source surface extrapolation (PFSS; Schrijver and De Rosa, 2003) of the active region. The white and pink lines indicate the closed and open field lines. The rotated view of the AR (toward eastern limb) is shown in the right panel. The fan loops emanates from the central positive polarity region and connects the surrounding opposite polarity fields. The magnetic configuration is almost similar to a fan-spine topology (Pariat, Antiochos, and DeVore, 2010) with a possible magnetic null point.
We used “Vertical-Current Approximation Nonlinear Force-Free Field” (VCA - NLFFF; Aschwanden, 2016) code using SDO/HMI and SDO/AIA data to obtain a nonlinear force-free field solution of the magnetic field in an active region. We used HMI line of sight magnetogram obtained at 00:04 UT and near simultaneous 6 channels AIA images (211, 193, 94, 131, 335 and 171 Å) as an input to determine the NLFFF solution. The bottom-left panel of Fig. \ireffig:pfss1 displays the NLFFF extrapolation of the field lines in a closer view. We can see clear connectivities of the central positive polarity region to the surrounding negative polarities, which is in agreement with PFSS extrapolation. It seems to have a magnetic null point above the positive polarity region, which is expected in a breakout magnetic topology.
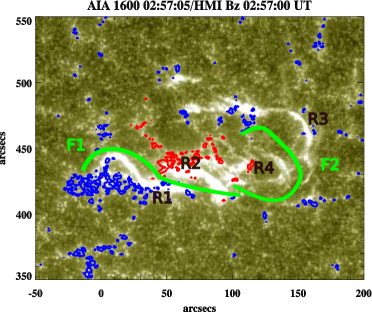
The right panel shows the AIA 1600 Å image during the appearance of flare ribbons by the eruption of F1 at 02:57 UT. We see multiple flare ribbons (R1, R2, R3,and R4). We draw the location of the filaments F1 and F2 to see their association with flare ribbons. Ribbons R1/R2 are associated with F1 whereas R3/R4 with F2. However, F2 could not erupt during the first flare and stopped by the overlying loop systems as shown in NLFFF extrapolation.
We notice low-lying connecting loops above the filament F1 and no higher loops are revealed at the sight of F1. However, we see higher closed fields above F2 where it was trapped during the first flare. Therefore, NLFFF extrapolation suggests the role of overlying magnetic fields in producing the successful and failed eruption.
| Time (UT) | Observation |
|---|---|
| 01:56 | A brightening was observed (green boxed region in Figure \ireffig:ch1_1 (top-right)) in AIA 171, 193, 131 and 304 Åchannels. |
| 01:57 – 02:35 | A bright flow was observed, which moved from east side of the filament to the west side. |
| 02:30 | One more brightening was observed near the east end of the filament which is related to preflare brightening of C5.3 class flare (see Figure \ireffig:ch1_5) and filament eruption (F1) starts. |
| 02:32 –02:35 | Contraction of coronal loop on the eastern part of the filament (see Figure \ireffig:ch1_7). |
| 02:53 | C5.3 class flare along with the filament eruption (F1). |
| 03:08 | Peak time of the C5.3 class flare. |
| 03:14 | A dark filament portion appeared over the bright and dark filament channel (see Figure \ireffig:ch1_8). |
| 03:14 –03:40 | The north-west portion of the filament started to activate. Shrinking of one of the post-flare loop (L1) is visible (see Figure \ireffig:ch1_8). |
| 03:45 | There was an expansion of loops (L2) towards higher heights in the east side of filament. At the same time a contraction of loops (L3) in the west side are also visible and these loops were sitting over the filament (see Figure \ireffig:ch1_10). |
| 04:16 – 04:26 | A brightened cusp shaped loop was observed near the east end of the filament, as shown by arrow ‘x’ in the Figure \ireffig:ch1_10 (panel a – f). |
| 04:20 | This filament eruption (F2) started followed by C1.7 class flare. |
Table:1
4 Summary and Discussions
section4
We observed successive eruption of filaments (F1 & F2) in AR NOAA 11444. The inverse ‘J’ shaped filament erupted in two different phases. In the first phase of the eruption the southern portion of the filament erupted, while in the second phase the northern portion erupted. The summary of the events are given in the Table \irefTable:1. These two phases of eruptions were accompanied with GOES C5.3 and C1.7 flares, respectively.
The transient brightening in EUV started at 01:56 UT at bottom of the filament, as discussed in Section 3.2. and it was followed by a bright plasma flow which moved from east end of the filament to the west. The filament appeared as a sequence of bright and dark threads in 171 Å during this flow. Photospheric magnetograms showed continuous cancellation of the flux near the PIL. The flux cancellation produced a jet below the filament F1. Chae (2003) studied the formation of reverse S-shaped filament in NOAA AR 8668 associated with series of magnetic flux cancellation at the photosphere. The flux cancellations along the PIL can form the twisted helical flux rope which support the filament, as formulated by van Ballegooijen and Martens (1989) and the same processes can also destabilize the filament (Amari et al., 2003; Martin and Livi, 1992). Prior to eruption, the filament F1 rose slowly at a velocity of 1.50.3 km s-1. The filament’s slow rise started about concurrently with the EUV brightening beneath the F1. Later, it accelerated during the flare. A similar kind of slow rise of filament prior to eruption during the EUV brightening beneath the filament was reported by Sterling and Moore (2005). They interpreted their observations as the slow-rise phase of the eruption is resulted from the onset of tether cutting reconnection beneath the filament. We believe that the slow rise of the filament in the first phase of the eruption was most likely caused by the tether cutting reconnection (Moore and Roumeliotis, 1992; Sterling and Moore, 2005) due to the flux cancellation between the opposite polarity magnetic fields below F1. The reconnection below F1 can reduce the tension of the overlying twisted fields and push F1 to higher heights.
Sterling, Moore, and Freeland (2011) observed a gradual magnetic flux cancellation under the filament, which built the filament flux rope over the time, causing it to rise gradually. The filament eventually erupted due to the onset of a magnetic instability and/or runaway tether cutting. During the onset and early development of the explosion for six bipolar events, Moore et al. (2001) observed that in each of the events the magnetic explosion was unleashed by runaway tether-cutting via reconnection in the middle of the sigmoid. As this internal reconnection starts at the beginning of the sigmoid eruption and grows in step of the magnetic explosion, their study suggests that this reconnection is essential for the onset and growth of magnetic explosion in eruptive flares. Recent results also show a direct observational evidences for tether-cutting mechanism in at least two events (Chen et al., 2014). We believe that the observed brightening near the low lying filament end followed by a jet-like flow along the filament could be the reconnection occurred in the lower layers and a signature of tether-cutting mechanism, which could have activated the filament F1 and it eventually erupted during C5.3 class flare.
Further, in the same active region, we observed a second phase of filament eruption F2, after 1.5 hrs of the first filament eruption (F1). We observed a flux cancellations near the east side of the filament wherein a small positive polarity region interacts with the negative polarity region. A brightening, followed by rising of the loops to higher heights was observed at the same location. The eruption of the overlying loops above filament could have removed the sufficient amount of overlying flux (as numerically explained by Török et al. (2011)), and made an easy way for the filament eruption F2. For the same event, Lee et al. (2016) also explained that the eruption was possible as the topology of the dome-like magnetic fan structure confined over the AR, was enabled to continue during the eruptions in spite of the significant changes in its geometry. The reason for the collapsing loop observed near the western end of the filament is not clear. However, Liu and Wang (2010); Yan et al. (2013) explained that the collapsing of the loops could be due to the reduced magnetic pressure underneath the filament.
In summary, the filament eruption F1 is consistent with the scenario: the gradual flux cancellation at PIL resulted the brightening followed by jet-like ejection below filament main axis. The brightening could be due to the reconnection occurred in the lower layers and a signature of tether-cutting mechanism, which could have triggered filament F1 initially with slow-rise and it eventually erupted during C5.3 class flare. However, filament F2 was trapped within the overlying loops and most likely did not reach the height of torus instability/loss of equilibrium and remain trapped for about 1.5 hrs. The filament F2 erupted after the removal of the overlying loops. Both filament eruptions were associated with two high speed CMEs (111http://cdaw.gsfc.nasa.gov/CMElist/UNIVERSAL/201203/htpng/20120327.031209.p346g.htp.html1148 km/s and 222http://cdaw.gsfc.nasa.gov/CMElist/UNIVERSAL/201203/htpng/20120327.042405.p097g.htp.html880 km/s, respectively), which were observed by SOHO/LASCO and STEREO COR1 & COR2 coronagraphs. The future studies of successive filament eruption with high resolution observations would be helpful to understand the origin of sequence of events that trigger the eruption.
Acknowledgments
We thank the referee for many valuable and insightful comments which greatly helped us to improve the quality of the manuscript. The AIA data used here is the courtesy of SDO (NASA) and AIA consortium. SDO/HMI is a joint effort of many teams and individuals to whom we are greatly indebted for providing the data. This work also utilizes data obtained by the Global Oscillation Network Group (GONG) Program, managed by the National Solar Observatory, which is operated by AURA, Inc. under a cooperative agreement with the National Science Foundation. The data were acquired by instruments operated by the Big Bear Solar Observatory, High Altitude Observatory, Learmonth Solar Observatory, Udaipur Solar Observatory, Instituto de Astrofisica de Canarias, and Cerro Tololo Inter-American Observatory. The EUVI images are supplied courtesy of the STEREO Sun Earth Connection Coronal and Heliospheric Investigation (SECCHI) team.
References
- Amari et al. (2003) Amari, T., Luciani, J.F., Aly, J.J., Mikic, Z., Linker, J.: 2003, Coronal Mass Ejection: Initiation, Magnetic Helicity, and Flux Ropes. II. Turbulent Diffusion-driven Evolution. ApJ 595, 1231. DOI. ADS.
- Antiochos (1998) Antiochos, S.K.: 1998, The Magnetic Topology of Solar Eruptions. ApJ 502, L181. DOI. ADS.
- Antiochos, DeVore, and Klimchuk (1999) Antiochos, S.K., DeVore, C.R., Klimchuk, J.A.: 1999, A Model for Solar Coronal Mass Ejections. ApJ 510, 485. DOI. ADS.
- Aschwanden (2016) Aschwanden, M.J.: 2016, The Vertical-current Approximation Nonlinear Force-free Field Code Description, Performance Tests, and Measurements of Magnetic Energies Dissipated in Solar Flares. ApJS 224, 25. DOI. ADS.
- Bateman (1978) Bateman, G.: 1978, MHD Instabilities. Cambridge, MA: MIT Press.
- Chae (2000) Chae, J.: 2000, The Magnetic Helicity Sign of Filament Chirality. ApJ 540, L115. DOI. ADS.
- Chae (2003) Chae, J.: 2003, The Formation of a Prominence in NOAA Active Region 8668. II. Trace Observations of Jets and Eruptions Associated with Canceling Magnetic Features. ApJ 584, 1084. DOI. ADS.
- Chen et al. (2014) Chen, H., Zhang, J., Cheng, X., Ma, S., Yang, S., Li, T.: 2014, Direct Observations of Tether-cutting Reconnection during a Major Solar Event from 2014 February 24 to 25. ApJ 797, L15. DOI. ADS.
- Chen (2011) Chen, P.F.: 2011, Coronal Mass Ejections: Models and Their Observational Basis. Living Reviews in Solar Physics 8, 1. DOI. ADS.
- Chifor et al. (2007) Chifor, C., Tripathi, D., Mason, H.E., Dennis, B.R.: 2007, X-ray precursors to flares and filament eruptions. A&A 472, 967. DOI. ADS.
- Dhara, Ravindra, and Banyal (2014) Dhara, S.K., Ravindra, B., Banyal, R.K.: 2014, Observations of Photospheric Vortical Motions During the Early Stage of Filament Eruption. Sol. Phys. 289, 4481. DOI. ADS.
- Fan and Gibson (2007) Fan, Y., Gibson, S.E.: 2007, Onset of Coronal Mass Ejections Due to Loss of Confinement of Coronal Flux Ropes. ApJ 668, 1232. DOI. ADS.
- Forbes (2000) Forbes, T.G.: 2000, A review on the genesis of coronal mass ejections. J. Geophys. Res. 105, 23153. DOI. ADS.
- Gilbert, Alexander, and Liu (2007) Gilbert, H.R., Alexander, D., Liu, R.: 2007, Filament Kinking and Its Implications for Eruption and Re-formation. Sol. Phys. 245, 287. DOI. ADS.
- Gopalswamy et al. (2003) Gopalswamy, N., Shimojo, M., Lu, W., Yashiro, S., Shibasaki, K., Howard, R.A.: 2003, Prominence Eruptions and Coronal Mass Ejection: A Statistical Study Using Microwave Observations. ApJ 586, 562. DOI. ADS.
- Green, Kliem, and Wallace (2011) Green, L.M., Kliem, B., Wallace, A.J.: 2011, Photospheric flux cancellation and associated flux rope formation and eruption. A&A 526, A2. DOI. ADS.
- Harvey et al. (1996) Harvey, J.W., Hill, F., Hubbard, R.P., Kennedy, J.R., Leibacher, J.W., Pintar, J.A., Gilman, P.A., Noyes, R.W., Title, A.M., Toomre, J., Ulrich, R.K., Bhatnagar, A., Kennewell, J.A., Marquette, W., Patron, J., Saa, O., Yasukawa, E.: 1996, The Global Oscillation Network Group (GONG) Project. Science 272, 1284. DOI. ADS.
- Hood and Priest (1979) Hood, A.W., Priest, E.R.: 1979, Kink instability of solar coronal loops as the cause of solar flares. Sol. Phys. 64, 303. DOI. ADS.
- Howard et al. (2008) Howard, R.A., Moses, J.D., Vourlidas, A., Newmark, J.S., Socker, D.G., Plunkett, S.P., Korendyke, C.M., Cook, J.W., Hurley, A., Davila, J.M., Thompson, W.T., St Cyr, O.C., Mentzell, E., Mehalick, K., Lemen, J.R., Wuelser, J.P., Duncan, D.W., Tarbell, T.D., Wolfson, C.J., Moore, A., Harrison, R.A., Waltham, N.R., Lang, J., Davis, C.J., Eyles, C.J., Mapson-Menard, H., Simnett, G.M., Halain, J.P., Defise, J.M., Mazy, E., Rochus, P., Mercier, R., Ravet, M.F., Delmotte, F., Auchere, F., Delaboudiniere, J.P., Bothmer, V., Deutsch, W., Wang, D., Rich, N., Cooper, S., Stephens, V., Maahs, G., Baugh, R., McMullin, D., Carter, T.: 2008, Sun Earth Connection Coronal and Heliospheric Investigation (SECCHI). Space Sci. Rev. 136, 67. DOI. ADS.
- Kahler et al. (1988) Kahler, S.W., Moore, R.L., Kane, S.R., Zirin, H.: 1988, Filament eruptions and the impulsive phase of solar flares. ApJ 328, 824. DOI. ADS.
- Kaiser et al. (2008) Kaiser, M.L., Kucera, T.A., Davila, J.M., St. Cyr, O.C., Guhathakurta, M., Christian, E.: 2008, The STEREO Mission: An Introduction. Space Sci. Rev. 136, 5. DOI. ADS.
- Karpen, Antiochos, and DeVore (2012) Karpen, J.T., Antiochos, S.K., DeVore, C.R.: 2012, The Mechanisms for the Onset and Explosive Eruption of Coronal Mass Ejections and Eruptive Flares. ApJ 760, 81. DOI. ADS.
- Kim et al. (2007) Kim, S., Moon, Y.-J., Kim, K.-H., Kim, Y.-H., Sakurai, T., Chae, J., Kim, K.-S.: 2007, Two-Step Reconnections in a C3.3 Flare and Its Preflare Activity Observed by Hinode XRT. PASJ 59, 831. ADS.
- Kliem and Török (2006) Kliem, B., Török, T.: 2006, Torus Instability. Physical Review Letters 96(25), 255002. DOI. ADS.
- Kumar and Cho (2014) Kumar, P., Cho, K.-S.: 2014, Multiwavelength observation of a large-scale flux rope eruption above a kinked small filament. A&A 572, A83. DOI. ADS.
- Kumar et al. (2012) Kumar, P., Cho, K.-S., Bong, S.-C., Park, S.-H., Kim, Y.H.: 2012, Initiation of Coronal Mass Ejection and Associated Flare Caused by Helical Kink Instability Observed by SDO/AIA. ApJ 746, 67. DOI. ADS.
- Kusano et al. (2012) Kusano, K., Bamba, Y., Yamamoto, T.T., Iida, Y., Toriumi, S., Asai, A.: 2012, Magnetic Field Structures Triggering Solar Flares and Coronal Mass Ejections. ApJ 760, 31. DOI. ADS.
- Lee et al. (2016) Lee, J., Liu, C., Jing, J., Chae, J.: 2016, Solar Multiple Eruptions from a Confined Magnetic Structure. ApJ 829, L1. DOI. ADS.
- Lemen et al. (2012) Lemen, J.R., Title, A.M., Akin, D.J., Boerner, P.F., Chou, C., Drake, J.F., Duncan, D.W., Edwards, C.G., Friedlaender, F.M., Heyman, G.F., Hurlburt, N.E., Katz, N.L., Kushner, G.D., Levay, M., Lindgren, R.W., Mathur, D.P., McFeaters, E.L., Mitchell, S., Rehse, R.A., Schrijver, C.J., Springer, L.A., Stern, R.A., Tarbell, T.D., Wuelser, J.-P., Wolfson, C.J., Yanari, C., Bookbinder, J.A., Cheimets, P.N., Caldwell, D., Deluca, E.E., Gates, R., Golub, L., Park, S., Podgorski, W.A., Bush, R.I., Scherrer, P.H., Gummin, M.A., Smith, P., Auker, G., Jerram, P., Pool, P., Soufli, R., Windt, D.L., Beardsley, S., Clapp, M., Lang, J., Waltham, N.: 2012, The Atmospheric Imaging Assembly (AIA) on the Solar Dynamics Observatory (SDO). Sol. Phys. 275, 17. DOI. ADS.
- Liewer et al. (2009) Liewer, P.C., de Jong, E.M., Hall, J.R., Howard, R.A., Thompson, W.T., Culhane, J.L., Bone, L., van Driel-Gesztelyi, L.: 2009, Stereoscopic Analysis of the 19 May 2007 Erupting Filament. Sol. Phys. 256, 57. DOI. ADS.
- Liu and Wang (2010) Liu, R., Wang, H.: 2010, Fast Contraction of Coronal Loops at the Flare Peak. ApJ 714, L41. DOI. ADS.
- Liu et al. (2009) Liu, W., Wang, T.-J., Dennis, B.R., Holman, G.D.: 2009, Episodic X-Ray Emission Accompanying the Activation of an Eruptive Prominence: Evidence of Episodic Magnetic Reconnection. ApJ 698, 632. DOI. ADS.
- Liu et al. (2012) Liu, Y., Hoeksema, J.T., Scherrer, P.H., Schou, J., Couvidat, S., Bush, R.I., Duvall, T.L., Hayashi, K., Sun, X., Zhao, X.: 2012, Comparison of Line-of-Sight Magnetograms Taken by the Solar Dynamics Observatory/Helioseismic and Magnetic Imager and Solar and Heliospheric Observatory/Michelson Doppler Imager. Sol. Phys. 279, 295. DOI. ADS.
- Martin (1980) Martin, S.F.: 1980, Preflare conditions, changes and events. Sol. Phys. 68, 217. DOI. ADS.
- Martin (1998) Martin, S.F.: 1998, Conditions for the Formation and Maintenance of Filaments (Invited Review). Sol. Phys. 182, 107. DOI. ADS.
- Martin and Livi (1992) Martin, S.F., Livi, S.H.B.: 1992, The Role of Cancelling Magnetic Fields in the Buildup to Erupting Filaments and Flares. In: Svestka, Z., Jackson, B.V., Machado, M.E. (eds.) IAU Colloq. 133: Eruptive Solar Flares, Lecture Notes in Physics, Berlin Springer Verlag 399, 33. ADS.
- Martin, Bilimoria, and Tracadas (1994) Martin, S.F., Bilimoria, R., Tracadas, P.W.: 1994, Magnetic field configurations basic to filament channels and filaments. In: Rutten, R.J., Schrijver, C.J. (eds.) NATO Advanced Science Institutes (ASI) Series C, NATO Advanced Science Institutes (ASI) Series C 433, 303. ADS.
- Martin, Livi, and Wang (1985) Martin, S.F., Livi, S.H.B., Wang, J.: 1985, The cancellation of magnetic flux. II - In a decaying active region. Australian Journal of Physics 38, 929. ADS.
- Moore and Labonte (1980) Moore, R.L., Labonte, B.J.: 1980, The filament eruption in the 3B flare of July 29, 1973 - Onset and magnetic field configuration. In: Dryer, M., Tandberg-Hanssen, E. (eds.) Solar and Interplanetary Dynamics, IAU Symposium 91, 207. ADS.
- Moore and Roumeliotis (1992) Moore, R.L., Roumeliotis, G.: 1992, Triggering of Eruptive Flares - Destabilization of the Preflare Magnetic Field Configuration. In: Svestka, Z., Jackson, B.V., Machado, M.E. (eds.) IAU Colloq. 133: Eruptive Solar Flares, Lecture Notes in Physics, Berlin Springer Verlag 399, 69. ADS.
- Moore and Sterling (2006) Moore, R.L., Sterling, A.C.: 2006, Initiation of Coronal Mass Ejections. Washington DC American Geophysical Union Geophysical Monograph Series 165, 43. ADS.
- Moore et al. (2001) Moore, R.L., Sterling, A.C., Hudson, H.S., Lemen, J.R.: 2001, Onset of the Magnetic Explosion in Solar Flares and Coronal Mass Ejections. ApJ 552, 833. DOI. ADS.
- Nagashima et al. (2007) Nagashima, K., Isobe, H., Yokoyama, T., Ishii, T.T., Okamoto, T.J., Shibata, K.: 2007, Triggering Mechanism for the Filament Eruption on 2005 September 13 in NOAA Active Region 10808. ApJ 668, 533. DOI. ADS.
- Pariat, Antiochos, and DeVore (2010) Pariat, E., Antiochos, S.K., DeVore, C.R.: 2010, Three-dimensional Modeling of Quasi-homologous Solar Jets. ApJ 714, 1762. DOI. ADS.
- Pesnell, Thompson, and Chamberlin (2012) Pesnell, W.D., Thompson, B.J., Chamberlin, P.C.: 2012, The Solar Dynamics Observatory (SDO). Sol. Phys. 275, 3. DOI. ADS.
- Priest and Forbes (2002) Priest, E.R., Forbes, T.G.: 2002, The magnetic nature of solar flares. A&A Rev. 10, 313. DOI. ADS.
- Priest, Parnell, and Martin (1994) Priest, E.R., Parnell, C.E., Martin, S.F.: 1994, A converging flux model of an X-ray bright point and an associated canceling magnetic feature. ApJ 427, 459. DOI. ADS.
- Scherrer et al. (2012) Scherrer, P.H., Schou, J., Bush, R.I., Kosovichev, A.G., Bogart, R.S., Hoeksema, J.T., Liu, Y., Duvall, T.L., Zhao, J., Title, A.M., Schrijver, C.J., Tarbell, T.D., Tomczyk, S.: 2012, The Helioseismic and Magnetic Imager (HMI) Investigation for the Solar Dynamics Observatory (SDO). Sol. Phys. 275, 207. DOI. ADS.
- Schmieder et al. (2002) Schmieder, B., van Driel-Gesztelyi, L., Aulanier, G., Démoulin, P., Thompson, B., de Forest, C., Wiik, J.E., Saint Cyr, C., Vial, J.C.: 2002, Relationships between CME’s and prominences. Advances in Space Research 29, 1451. DOI. ADS.
- Schrijver and De Rosa (2003) Schrijver, C.J., De Rosa, M.L.: 2003, Photospheric and heliospheric magnetic fields. Sol. Phys. 212, 165. DOI. ADS.
- Srivastava et al. (2010) Srivastava, A.K., Zaqarashvili, T.V., Kumar, P., Khodachenko, M.L.: 2010, Observation of Kink Instability During Small B5.0 Solar Flare on 2007 June 4. ApJ 715, 292. DOI. ADS.
- Sterling and Moore (2005) Sterling, A.C., Moore, R.L.: 2005, Slow-Rise and Fast-Rise Phases of an Erupting Solar Filament, and Flare Emission Onset. ApJ 630, 1148. DOI. ADS.
- Sterling, Harra, and Moore (2007) Sterling, A.C., Harra, L.K., Moore, R.L.: 2007, New Evidence for the Role of Emerging Flux in a Solar Filament’s Slow Rise Preceding Its CME-producing Fast Eruption. ApJ 669, 1359. DOI. ADS.
- Sterling, Moore, and Freeland (2011) Sterling, A.C., Moore, R.L., Freeland, S.L.: 2011, Insights into Filament Eruption Onset from Solar Dynamics Observatory Observations. ApJ 731, L3. DOI. ADS.
- Sterling et al. (2010) Sterling, A.C., Chifor, C., Mason, H.E., Moore, R.L., Young, P.R.: 2010, Evidence for magnetic flux cancelation leading to an ejective solar eruption observed by Hinode, TRACE, STEREO, and SoHO/MDI. A&A 521, A49. DOI. ADS.
- Toriumi et al. (2013) Toriumi, S., Iida, Y., Bamba, Y., Kusano, K., Imada, S., Inoue, S.: 2013, The Magnetic Systems Triggering the M6.6 Class Solar Flare in NOAA Active Region 11158. ApJ 773, 128. DOI. ADS.
- Török and Kliem (2003) Török, T., Kliem, B.: 2003, The evolution of twisting coronal magnetic flux tubes. A&A 406, 1043. DOI. ADS.
- Török, Kliem, and Titov (2004) Török, T., Kliem, B., Titov, V.S.: 2004, Ideal kink instability of a magnetic loop equilibrium. A&A 413, L27. DOI. ADS.
- Török et al. (2011) Török, T., Panasenco, O., Titov, V.S., Mikić, Z., Reeves, K.K., Velli, M., Linker, J.A., De Toma, G.: 2011, A Model for Magnetically Coupled Sympathetic Eruptions. ApJ 739, L63. DOI. ADS.
- van Ballegooijen and Martens (1989) van Ballegooijen, A.A., Martens, P.C.H.: 1989, Formation and eruption of solar prominences. ApJ 343, 971. DOI. ADS.
- Wang and Shi (1993) Wang, J., Shi, Z.: 1993, The flare-associated magnetic changes in an active region. II - Flux emergence and cancellation. Sol. Phys. 143, 119. DOI. ADS.
- Xu, Jing, and Wang (2010) Xu, Y., Jing, J., Wang, H.: 2010, Measurements of Filament Height in H and EUV 304 Å. Sol. Phys. 264, 81. DOI. ADS.
- Yan et al. (2013) Yan, X.L., Pan, G.M., Liu, J.H., Qu, Z.Q., Xue, Z.K., Deng, L.H., Ma, L., Kong, D.F.: 2013, The Contraction of Overlying Coronal Loop and the Rotating Motion of a Sigmoid Filament during Its Eruption. AJ 145, 153. DOI. ADS.
- Yan et al. (2014) Yan, X.L., Xue, Z.K., Liu, J.H., Ma, L., Kong, D.F., Qu, Z.Q., Li, Z.: 2014, Kink Instability Evidenced by Analyzing the Leg Rotation of a Filament. ApJ 782, 67. DOI. ADS.
- Young (2007) Young, C.A.: 2007, Mkit: An IDL Multiscale Toolbox. In: American Astronomical Society Meeting Abstracts #210, Bulletin of the American Astronomical Society 39, 133. ADS.
- Zuccarello et al. (2014) Zuccarello, F.P., Seaton, D.B., Mierla, M., Poedts, S., Rachmeler, L.A., Romano, P., Zuccarello, F.: 2014, Observational Evidence of Torus Instability as Trigger Mechanism for Coronal Mass Ejections: The 2011 August 4 Filament Eruption. ApJ 785, 88. DOI. ADS.
- Zuccarello et al. (2007) Zuccarello, F., Battiato, V., Contarino, L., Romano, P., Spadaro, D.: 2007, Plasma motions in a short-lived filament related to a magnetic flux cancellation. A&A 468, 299. DOI. ADS.