On the properties of a single OPLS-UA model curcumin molecule in water, methanol and dimethyl sulfoxide. Molecular dynamics computer simulation results
Abstract
The properties of model solutions consisting of a solute — single curcumin molecule in water, methanol and dimethyl sulfoxide solvents have been studied using molecular dynamics (MD) computer simulations in the isobaric-isothermal ensemble. The united atom OPLS force field (OPLS-UA) model for curcumin molecule proposed by us recently [ J. Mol. Liq., 2016, 223, 707] in combination with the SPC/E water, and the OPLS-UA type models for methanol and dimethyl sulfoxide have been applied. We have described changes of the internal structure of the solute molecule induced by different solvent media in very detail. The pair distribution functions between particular fragments of a solute molecule with solvent particles have been analyzed. Statistical features of the hydrogen bonding between different species were explored. Finally, we have obtained a self-diffusion coefficient of curcumin molecules in three model solvents.
Key words: curcumin, united atom model, molecular dynamics, water, methanol, dimethyl sulfoxide
PACS: 02.70.Ns, 61.20.Ja, 82.30.Rs, 87.15.hp
Abstract
Çà äîïîìîãîþ ìåòîäó ìîëåêóëÿðíî¿ äèíàìiêè (ÌÄ) ïðîâåäåíî êîìï’þòåðíå ìîäåëþâàííÿ òà äîñëiäæåíî âëàñòèâîñòi îäíiє¿ ìîëåêóëè êóðêóìiíó ó âîäi, ìåòàíîëi òà äèìåòèëñóëüôîêñèäi ïðè ïîñòiéíèõ òåìïåðàòóði òà òèñêó. Äëÿ öüîãî âèêîðèñòàíî ìîäåëü, çàïðîïîíîâàíó íàìè íåùîäàâíî äëÿ êóðêóìiíó â ðàìêàõ ñèëîâîãî ïîëÿ OPLS-UA [ J. Mol. Liq., 2016, 223, 707] òà ïîєäíàíî ¿¿ iç ìîäåëëþ âîäè SPC/E òà ìîäåëÿìè OPLS-UA äëÿ ìåòàíîëó i äèìåòèëñóëüôîêñèäó. Íàìè îòðèìàíî äåòàëüíèé îïèñ çìií ó âíóòðiøíié ñòðóêòóði ðîçчèíåíî¿ ìîëåêóëè, ÿêi ñïðèчèíþþòüñÿ ðiçíèìè ñåðåäîâèùàìè ðîçчèííèêà. Ïðîàíàëiçîâàíî ïàðíi ôóíêöi¿ ðîçïîäiëó ìiæ îêðåìèìè ôðàãìåíòàìè ìîëåêóëè êóðêóìiíó òà ìîëåêóëàìè ðîçчèííèêà. Äîñëiäæåíî ñòàòèñòèчíi õàðàêòåðèñòèêè âîäíåâèõ çâ’ÿçêiâ ìiæ ðiçíèìè êîìïîíåíòàìè. Íàñàìêiíåöü, îòðèìàíî êîåôiöiєíò ñàìîäèôóçi¿ ìîëåêóëè êóðêóìiíó â òðüîõ ìîäåëüíèõ ðîçчèííèêàõ.
Ключовi слова: êóðêóìií, ìîëåêóëÿðíà äèíàìiêà, âîäà, ìåòàíîë, äèìåòèëñóëüôîêñèä
1 Introduction
Curcumin, derived from the root of turmeric Curcuma longa, is well known not only as a spice and natural colorant but also as an important substance in biomedicine due to possible ample applications. Namely, the issues concerning the antioxidant, anti-inflammatory, antiviral and anticancer activity of curcumin have become the subject of numerous experimental studies for the recent few decades, see e.g., recent reviews and references therein [1, 2, 3, 4, 5]. We are unable to comment on the problems related to the applications of curcumin-based agents in medicinal chemistry [6] and just wish to mention that experimental research has urged the use of methods of theoretical chemistry in this area, more specifically, methods of quantum chemistry. However, as noted by Wright [7], from a theoretical modelling perspective, there is a bewildering number of variables involved in the experiments. Consequently, there is much room for the development of adequate modelling and for confronting predictions from computer simulations against experimental data.
The studies of liquid systems containing curcumin solutes by using computer simulation techniques have been initiated quite recently [8, 9, 10, 11, 12, 13, 14, 15, 16, 17]. The works [12, 13] are of particular interest for the present study. In each of them, the modelling of a curcumin molecule force field has been undertaken starting from quantum chemical calculations within the B3LYP DFT method by using different versions of Gaussian software. Unfortunately, not all the details of modelling were presented in the original papers and in supplementary materials to them. For, example, in [13] only charges for the interaction sites are given whereas all parameters concerning bonds, angles and dihedral angles were omitted. This was one of the reasons that in the previous work from this laboratory we have developed the OPLS-united atom model for enol-tautomer of curcumin molecule and tested it in vacuum and water using classical MD simulations [18]. It has been already mentioned [7] that experiments were performed in a variety of solvents (e.g., chlorobenzene, isopropanol-water mixture, dimethylsulfoxide, acetonitrile) due to marginal solubility of curcumin in pure water. Therefore, in the current study we extend our recent work by considering a single curcumin molecule in pure methanol (MeOH) and pure dimethylsulfoxide (DMSO). It is worth mentioning that specific features of curcumin molecule conformations in liquid DMSO were studied experimentally quite recently [19]. Our principal objective here is to elucidate the similarities and differences in the behavior of this molecule in water, MeOH and DMSO. With this aim we also needed to recalculate some of the results for curcumin in water from the previous study [18] in order to make the time extent of computer simulations for all three systems similar.
2 Model and technical details of calculations
Simulations of a single curcumin molecule in three solvents, H2O, MeOH and DMSO, were performed in the isothermal-isobaric (NPT) ensemble at a temperature of K and at bar. In all cases we used GROMACS simulation engine [20] version 4.6.7.
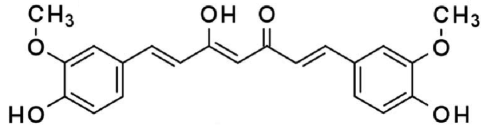
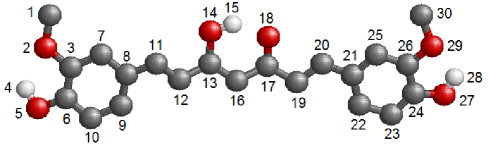
In close similarity to the previous work [18], our attention is restricted to the enol-tautomer of curcumin solely. Its chemical formula is given in figure 1. This tautomer was investigated in the recent computer simulation studies [12, 13]. It is a dominant tautomer both in solids and in various solutions as confirmed in various works, see e.g., [19, 21, 22, 23]. Besides, it is the major phytoconstituent of extracts of Curcuma longa according to [6]. Thus, we are interested in the effects of solvents on a particular tautomer, while diketo-tautomer will be explored elsewhere. A “ball-and-stick” schematic representation of the curcumin molecule is shown in figure 2, with labels denoting the sites (carbon groups, oxygen and hydrogen) of the united atom force field model. All the parameters of the force field are taken from [18], see supporting information file to that article.
For water we used the SPC/E model [24]. For MeOH, the OPLS-UA model was taken according to [25]. However, in contrast to [25], we used the harmonic bond-angle potential for CH3-O-H with the force constant from the OPLS-UA database [26]. In the case of DMSO, we used the four-site model with all parameters taken from the OPLS-UA database, except that the improper dihedral angle S-CH3-O-CH3 was added, it was described by the GROMOS set of parameters [27].
The geometric combination rules were used to determine parameters for cross interactions (rule 3 of GROMACS package). To evaluate the contributions of Coulomb interactions the particle mesh Ewald method was used (fourth-order spline interpolation and grid spacing for fast Fourier transform equal to ). The electrostatic and Lennard-Jones cut-off distances were chosen equal to nm. The van der Waals tail correction terms to the energy and pressure were taken into account. The lengths of the bonds were constrained by LINCS. For each system, a periodic cubic simulation box was set up with solvent particles and a single curcumin molecule.
The initial configuration of particles was prepared by placing them randomly in the simulation box using the GROMACS genbox tools. Next, the systems underwent energy minimization to remove the possible overlap of atoms in the starting configuration. This was done by applying the steepest descent algorithm. After minimization we performed equilibration of each system for ps at a temperature of K and at bar using a timestep fs.
The Berendsen thermostat with the time coupling constant of and isotropic Berendsen barostat with the time constant of ps were used. We are aware that this thermostat may yield certain inaccuracies in common MD, see, e.g., comments in [28] concerning the application of replica exchange MD to conformational equilibria, and becomes completely unsatisfactory in calculations of fluctuation-based properties. Still, for purposes of the present work, and to keep a consistency with the previous development [18], we have decided to use this thermostat for the moment.
The compressibility parameter was taken equal to bar-1 for water, bar-1 for methanol, similar to [29], and bar-1 for DMSO. All the properties were collected by performing the averages over consecutive simulation runs of the length of ns. Each run started from the last configuration of the previous one. The timestep in the production runs was chosen to be .
3 Results and discussion
First, we would like to discuss the changes of the internal structure of a single curcumin molecule induced by each solvent under study. Various properties are described in terms of histograms of the probability distributions termed as the distribution functions. For each production run, we select a set of frames with the distance in time equal to 2 ps. The outputs for any property of interest are collected on a set of frames and the resulting histogram is then normalized. Next, the average over a set of runs is performed.
3.1 Distributions of dihedral angles
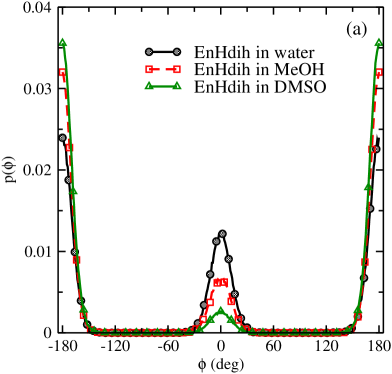
The histograms of probability distributions of the dihedral angles of curcumin in water, MeOH and DMSO are presented in three panels of figure 3. The abbreviated notations for dihedral angles are given in table 1.
| dih. group abbr. | dihedrals | ||
|---|---|---|---|
| EnHdih | 12-13-14-15 | ||
| Phdih | 3-6-5-4 | and | 26-24-27-28 |
| Andih | 6-3-2-1 | and | 24-26-29-30 |
| 12-11-8-7 | and | 25-21-20-19 | |
| 13-12-11-8 | and | 21-20-19-17 | |
| 16-13-12-11 | and | 20-19-17-16 | |
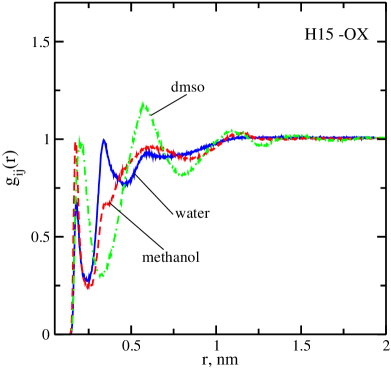
To begin with, we consider the EnHdih dihedral angle distribution [figure 3 (a)] that describes the orientation of hydrogen atom H15 within the enol group. For all three solvents in question, is characterized by the maxima at and of different height. The maxima located at indicate that H15 is preferentially directed toward the ketone oxygen (O18), rather than outward the enol group. Thus, the trans-conformation of EnHdih angle is dominant compared to the cis-conformation in all cases. It seems that intramolecular electrostatic interaction between H15 and O18 leads to these trends. However, solvent effect is manifested in the difference of heights of the maxima at characteristic angles. Apparently, the cis-conformation is suppressed, comparing to its trans-counterpart in two solvents capable of solubilizing curcumin. By contrast, in water, H15 has enough freedom to accommodate in both conformations. An abundant population of cis-conformation witnesses a possibility of the formation of H-bonds between water oxygens and H15 belonging to the enol group. It is worth noting that for curcumin molecule in vacuum, the only state of EnHdih is trans-conformation [18].
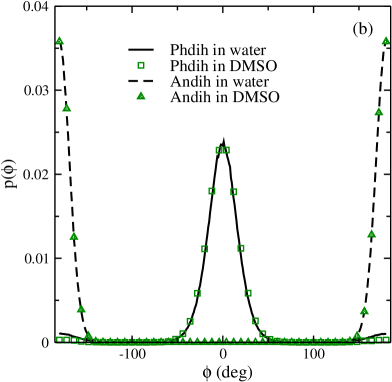
Histograms of probability distribution of dihedral angles of phenol and anisole groups [figure 3 (b)] practically coincide for three systems studied [the curve describing the influence of MeOH on is omitted to make the figure less loaded]. Thus, interpretation of the results is similar for all cases. The Phdih dihedrals have a principal maximum at (cis-conformation) due to the hydrogens H4 and H28 directed toward the oxygens O2 and O29, respectively. Trans-conformation for Phdih can happen, but with negligible probability as it follows from the figure. The Andih angle distributions have solely two maxima at . In the trans-conformation, the methyl groups, C1 and C30, point away from the oxygens O5 and O27, respectively.
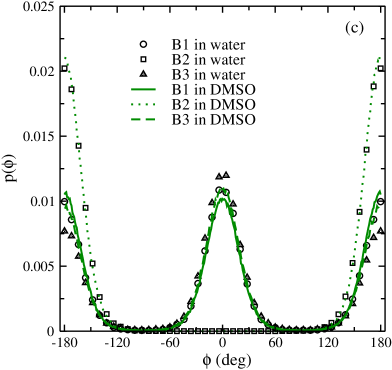
Dihedral distributions, , and [figure 3 (c)] characterize the flexibility of the spacer connecting aromatic rings to the central enol group. The changes in the dihedrals describe the rotation of aromatic rings apart from the spacer, whereas the changes of the and are related to the rotation of all the side branches including aromatic rings and the spacer fragments connected to them. The distribution qualitatively differs from the and curves. While the and histograms have maxima at and , the has a maximum around (trans-conformation). Consequently, there is no rotation around the and bonds. The same behaviour for the is observed for a curcumin molecule in water and in DMSO, two curves practically coincide (the MeOH curve is omitted). The difference between the and curves in water and in DMSO is better pronounced but small. We are unaware of any direct experimental spectroscopic evidence or computer simulation studies of the relevant properties to estimate the quality of our predictions. Nevertheless, some indirect supporting arguments are given in the following subsection.
3.2 Distance and angles distributions
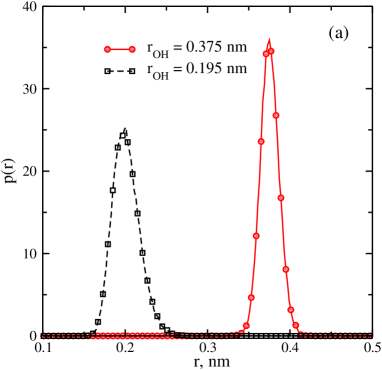
The distribution function of the EnHdih angle discussed in the previous subsection can be interpreted in terms of the changes of the distance between hydrogen, H15, and ketone oxygen, O18, figure 4 (a). Well pronounced maxima at nm and nm correspond to H15 pointing toward and outward the enol group, respectively. As expected from the behavior of EnHdih [figure 3 (a)], the site H15 prefers to be directed toward the enol group in all solvents considered. The maximum of the O18-H15 distance distribution at nm is higher for the system with DMSO solvent, in comparison with MeOH and water. On the other hand, the maximum at nm is much lower in magnitude for curcumin-DMSO system compared with two other solvents. Consequently, the trans-conformation of the enol group is most frequent and possibly most stable in thermodynamic sense for curcumin-DMSO solution.
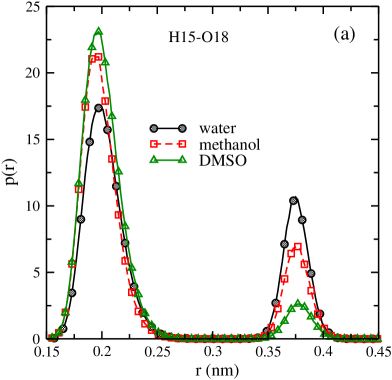
This is a valuable result. There is no experimental evidence supporting our observation. However, in computer simulations of Samanta and Roccatano [12], the H15-O18 distance distribution was discussed. According to their model [12], the H15-O18 distance distribution in water solvent is bimodal with two maxima of almost equal height located at and nm. These values do not differ much from what we observe. It seems, however, that the discrepancy of the absolute values of maxima reported in figure 4 of [12] and our data in figure 4 (a) is due to the differences of parameters used in modelling the dihedral angles. Moreover, in the case of MeOH solvent, the second maximum is totally absent in the model of [12] whereas in our distribution it is seen.
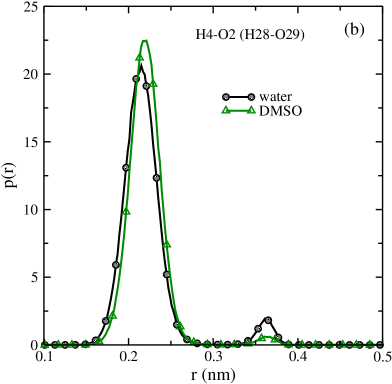
The trends of the behavior of the distances H4-O2 and H28-O29 have been analyzed by us as well. Histograms of the probability distribution for each of these distances in figure 4 (b) confirm our conclusions concerning the dihedral angles Phdih [cf. figure 3 (b)]. In particular, one can observe a bimodal distribution with two maxima at nm and nm. They correspond to the cis- and trans-conformations. It is clearly seen that the larger distance (trans-conformation) is realized with very low probability in water and DMSO solvents, though in DMSO it is noticeably lower. Therefore, we can conclude that such a rare change of Phdih conformation can hardly have an effect on the overall behavior of the curcumin molecule.
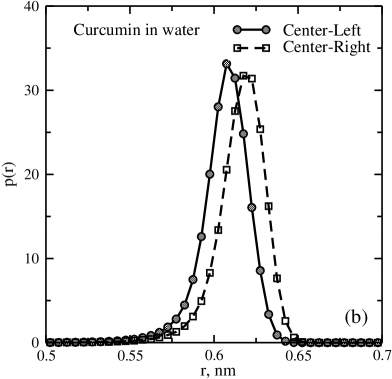
Probability distributions describing the flexibility of a curcumin molecule in three solvents are shown in figure 5 (a) and figure 5 (b). The Left ring-Right ring distance is defined as a distance between centers of aromatic rings, whereas the Center-Left and Center-Right are the distances from the center of the enol ring to the center of the left and right ring, respectively. The center of a ring is chosen as a center of mass of carbons and hydrogens composing it. For the Left-Right distance of curcumin in water presented in figure 5 (a), three well pronounced maxima at nm, nm and nm are observed.
As it was discussed in our previous study [18], this shape is explained by the conformational states available for the , and dihedrals. It was also concluded that only the dihedrals involving 16-13-12-11 and 20-19-17-16 groups are responsible for the Left-Right distance of a curcumin molecule. Since only three possible combinations of cis- and trans- conformation states of these two groups may occur, the number of the most probable Left-Right distances is three.
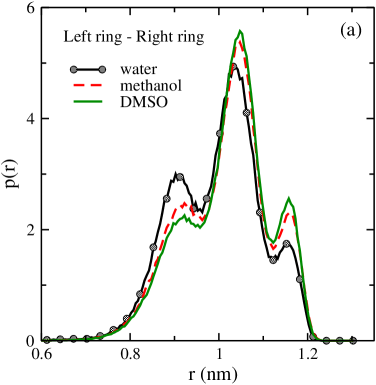
The maximum which corresponds to the middle distance nm is the most pronounced, and consequently this structure is the most probable, figure 5 (a). The left-hand maximum in the figure corresponding to the distance nm is much lower. Finally, the lowest maximum can be found at the distance nm. The obtained distances agree well with the results from our previous investigation of curcumin in SPC-E water [18].
In the case of the MeOH solvent [figure 5 (a)], we again observe three maxima, but of different heights, in comparison with water. Moreover, all of them are slightly shifted towards higher distances. The middle peak becomes higher in a “better” solvent that solubilizes curcumin in contrast to water. Specifically, in the case of MeOH, the middle maximum of the Left-Right distance distribution is higher than in water. It is even higher for curcumin in DMSO compared to the curcumin molecule in MeOH. Similar behavior is observed for the right-hand maximum. By contrast, opposite trends are seen for the left-hand maximum. Finally, for curcumin molecules in DMSO, the height of the right-hand maximum becomes higher than the left-hand one.
The Center-Left and Center-Right distance distributions are shown in figure 5 (b) only for the curcumin in water, since for MeOH and DMSO, the results are very close to the system with water. As can be seen, both distributions have a single maximum, approximately of equal heights, just slightly shifted. The Center-Left distance has the most probable value at nm whereas the Center-Right most probable distance is slightly higher. The shift can be attributed to the asymmetry of the spacer of the curcumin molecule. We are not aware of the data coming from other models of a curcumin molecule in various solvents. However, a detailed discussion of fine features of the molecular internal structure can be helpful in designing more sophisticated models in future research. Namely, the modification and reparameterization of the dihedral-angle potentials can be attempted along the lines proposed by Kurokawa et al. [30].
Changes of the internal structure of a molecule can be interpreted in terms of the angles between certain fragments of the curcumin molecule immersed in a solvent. To begin with, we explored the trends of the behavior of the angle between planes of aromatic rings. A plane is determined by picking up three sites belonging to a ring, namely C6, C7, C9 for the left-hand ring and C22, C24, C25 for the right-hand ring. The distribution of the angles between the rings, , has been analysed, but the figure is not shown for the sake of brevity. The probability distributions of are very similar in all the solvents considered and they almost coincide with the histogram for presented in figure 10 of [18]. The distribution has a bimodal shape principally determined by the intrinsic structure of a molecule within the framework of the modelling applied.
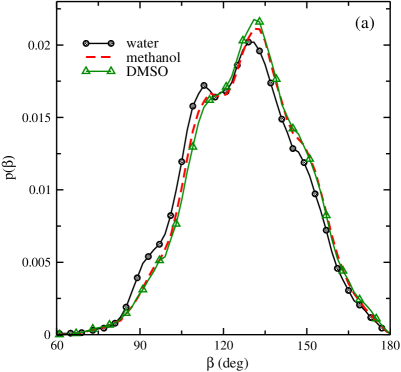
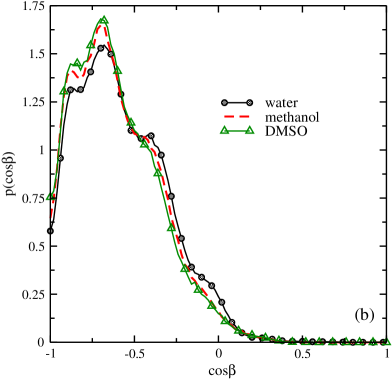
Another characteristic angle is , which is the side-side angle defined via the triplet of sites, C3-C16-C26. Its behavior is given in terms of angular distribution , figure 6 (a). Actually, the distribution is unimodal with the maximum at . At a larger value of the angle, there is a shoulder for all three solvents. However, the shape of in DMSO is very close to that in MeOH. Only in water, a weakly pronounced secondary maximum can be observed at a smaller angle, . These distributions reflect the bending of curcumin molecules and in some sense should yield information similar to figure 5 (a). However, splitting into three maxima using the distance variable [figure 5 (a)] in terms of the angles is manifested solely in shoulders of the distribution. Nevertheless, the angular distribution curves indicate that the curcumin molecule is slightly more bent in water compared to DMSO or MeOH. In figure 6 (b), we also show the corresponding distributions for the angle cosine []. It provides conclusions similar to , though in such representation the shoulders become more prominent.
3.3 Dipole moment
The dipole moment distribution only marginally changes upon the solvent change within the framework of the model. Therefore, only the histograms of the probability distribution of the magnitude of the dipole moment of a curcumin molecule in water and DMSO are presented in figure 7, the curve for MeOH is omitted.
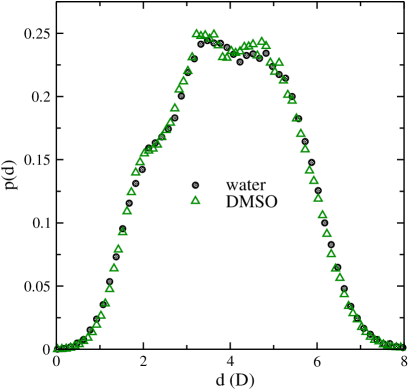
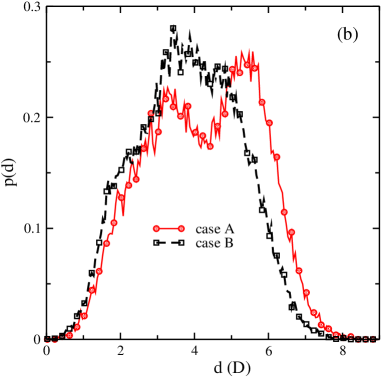
The dipole moment distribution reflects superposition of the conformational states of a curcumin molecule discussed in terms of dihedral angles and the related properties in the previous subsections. It seems that an essential conformation change is the position of hydrogen site in the enol group. The splitted maximum in the dipole moment distribution is due to the enol hydrogen, H15, pointing toward ketone-oxygen, O18, or outward the enol group. To get a profounder insight, we have analyzed two distributions obtained from the curcumin trajectories. Namely, we picked up a part of the trajectory when H15 is pointing solely outwards (case A: nm) and the other part when H15 is directed toward (case B: nm) the enol group. Histograms describing for these trajectories are given in figure 8 (a). The corresponding functions are presented in figure 8 (b). The is clearly a unimodal function in each case. However, in the case A, we observe two maxima D and D on coming from distinct conformation states. Additional exploration leads to the conclusion that this bimodality in the present case comes from the behavior of , i.e., from the bending of the spacer. In the case B, the splitting of a maximum part of the curve is less pronounced. From the results above, it seems that “closed” states of the enol ring influence the formation of the left-hand side maximum on the resulting curve in figure 7, or, in other words, contribute to lower values of the dipole moment compared to other conformations.
To summarize, for a curcumin molecule in MeOH and DMSO, we observe a similar behavior of the dipole moment distribution as in water (figure 7). However, the maxima at the distribution are found to be a bit more pronounced in MeOH and DMSO. Further studies are necessary to establish the validity of these conclusions for other protic and aprotic solvents.
3.4 Pair distribution functions
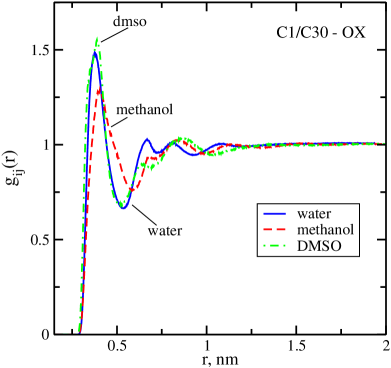
In order to characterize the surrounding of the curcumin molecule in different solvents, we consider some selected pair distribution functions (PDFs). Here, our focus is on PDFs of solvent molecules around the polar groups of curcumin, since these groups formally yield the strongest attractive interactions between a curcumin molecule and solvent species compared to other groups of a molecule. We pick up the groups where oxygen is present. Taking into account the molecular symmetry of curcumin, some of them are combined into pairs, e.g., for the hydroxyl groups (O5-H4 and O27-H28), we consider the functions H4/H28-OX and O5/O27-OX (X = OW, OMe and OD) each resulting from the averaging of the two PDFs. A similar procedure is used for methoxy groups O2-C1 and O29-C30. Prior to any kind of such averaging, we have checked whether the functions are similar, up to statistical inaccuracy.
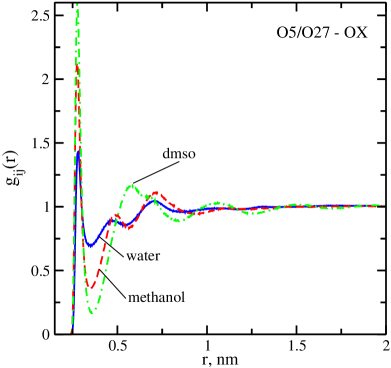
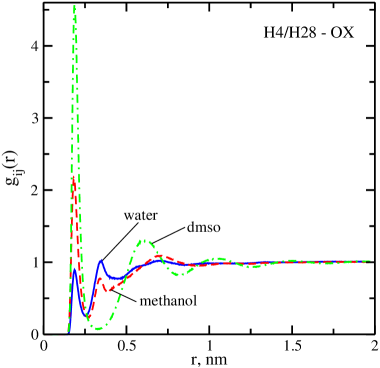
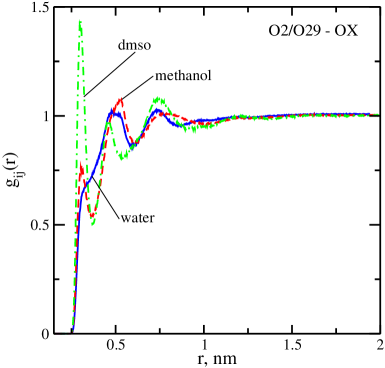
As concerns the groups at aromatic rings, one should mention that the PDFs O5/O27-OX are characterized by a sharp first maximum at nm for all solvents in question (figure 9, left-hand panel). The first maximum in MeOH and in DMSO is much higher than in water (, and , respectively). The second peak is weakly pronounced both in water (at about nm) and in MeOH (at nm). Actually, this is a local maximum. Only in the case of DMSO, the second maximum is well manifested but it is not high (the height is at nm). The ordering of solvent species around hydrogens H4/H28 (H4/H28-OX PDFs) resembles the above description. Finally, for the methoxy groups, it is observed that the first peak of PDF O2/O29-OX in the MeOH solvent is less than unity at the distance nm, while in water it is absent at all. In the case of DMSO, the first maximum is well defined at the same distance nm, but not as high as in the case of hydroxyl groups.
Our conclusions concerning three left-hand panels are as follows. This part of the curcumin molecule perturbs the solvent density up to two layers at most. Distribution of solvent species around this region of curcumin is heterogenous. The most “dry” part is around the methoxy group. Only the DMSO solvent fills the first layer in the methoxy part. By contrast, the DMSO particles form two layers in the hydroxy group region. Moreover, it seems that there exists a possibility that OD can form hydrogen bonds with H4/H28. These trends become weaker for MeOH. Finally, in terms of adsorption terminology, one can say that water molecules tend to their bulk rather than approach this part of curcumin molecules or “dewet” it.
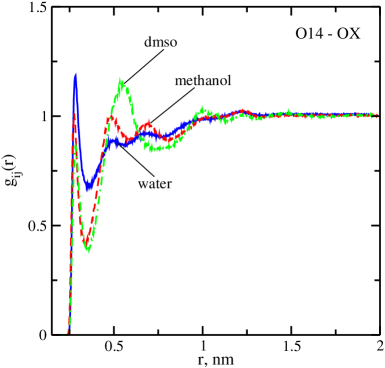
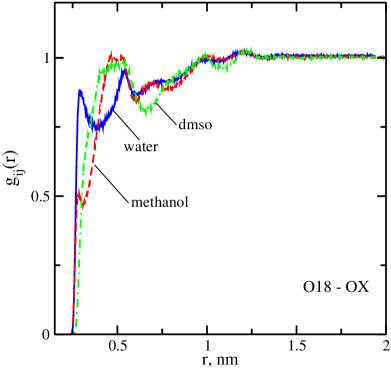
Now, consider the arrangement of solvent molecules around the hydroxyl and ketone groups at the spacer of a curcumin molecule (figure 9, right-hand panel). The first maximum of PDF for O14-OX (at nm) in the case of DMSO solvent is found lower than in water and in MeOH, for which the first maxima are observed at about the same distances. The second maximum in DMSO is well manifested at nm and is much higher than in water and MeOH. Those are just local maxima on a gradually increasing function that tends to unity. For the PDFs H15-OX in water, the distribution function is similar to H4/H28-OX, but the height of the first maximum is somewhat lower. For MeOH and DMSO solvents, we observe essentially lower first maxima compared to the curves for solvent species around hydroxyl groups at the aromatic rings. However, the picture is different for the second maximum, which is absent in MeOH, but well pronounced in DMSO at nm. Finally, the PDFs for the last group on the list of oxygen containing groups of the curcumin molecule (the ketone group) exhibits a “desorption” type arrangement of solvent molecules. The first maximum of PDF in the case of water is less than unity at nm. In MeOH, it is much lower and in DMSO it is absent. The second maximum in DMSO is weak. The same is observed for the MeOH. The second maximum in water is just a local perturbation.
To summarize these observations, we would like to mention the following. The solvent density around this part of curcumin molecule is perturbed to larger distances, cf. right-hand and left-hand three panels of figure 9. Important events occur not only at the distance of the closest approach for sites and solvent species but in the second layer as well. Actually, the second layer should be included in the discussion of the structure of the surroundings of a curcumin molecule. This central part of the molecules does not exhibit much adsorptive capability, seemingly an interfacial region within this area is richer in hydrogen bonds compared to other parts of the surface of curcumin, while in other parts, the solvent may cover a solute without forming bonds. These issues are touched upon herein below.
From the PDFs presented in figure 9 we have calculated the first coordination numbers using the definition,
| (1) |
where is the number density of species , and refers to the minimum of the corresponding pair distribution function. The indicate the quantity of oxygens of a solvent located within the first coordination shell of the corresponding oxygen of a curcumin molecule (table 2). The distances are determined from the first minimum of the PDFs. The coordination numbers serve as the evidence that water molecules prefer to be located in the first coordination shells formed by oxygens of the enol ring rather than by the oxygens of the side phenol rings. By contrast, MeOH and DMSO surround mostly the methoxy and hydroxyl groups of the side rings. Weaker trends to observe these molecules in the first coordination shells of the enol and keto groups are evident. Thus, the side rings play an important role in the curcumin solubility in MeOH and DMSO solvent.
| CUR-SOL | , nm | |
|---|---|---|
| O14-OW | 0.355 | 3.17 |
| O18-OW | 0.390 | 4.58 |
| O5/O27-OW | 0.350 | 3.28 |
| O2/O29-OW | 0.365 | 2.46 |
| O14-OM | 0.336 | 0.86 |
| O18-OM | 0.310 | 0.35 |
| O5/O27-OM | 0.350 | 1.54 |
| O2/O29-OM | 0.365 | 1.11 |
| O14-OD | 0.360 | 0.58 |
| O5/O27-OD | 0.360 | 0.97 |
| O2/O29-OD | 0.370 | 1.00 |
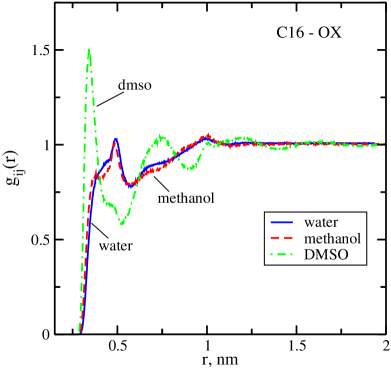
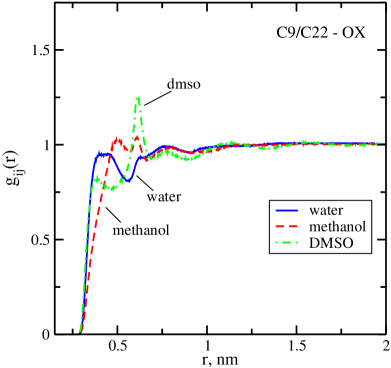
The arrangements of the solvent molecules around the hydrophobic groups of curcumin are analyzed as well (figure 10). For this purpose, we consider the PDFs of solvent oxygens around several sites at the curcumin molecule, which correspond to the sites C1/C30, C16 and C9/C22. The obtained PDFs C1-OX and C30-OX, C9-OX and C22-OX are combined due to the symmetry of a curcumin molecule. As expected, these PDFs have well pronounced extremal points in the case of DMSO solvent. A less structure is observed for water and MeOH. However, all the solvents have PDFs indicating a rather strong augmented density close to C1 and C30 sites.
The analysis of the solvent arrangements between the two rings in the vicinity of spacer shows that this location is preferably occupied by DMSO molecules, rather than by water or MeOH molecules. This conclusion emerges from the well manifested first maximum of the PDF C16-OX for DMSO at nm. In the case of water and MeOH, the PDF C16-OX describes “desorptive” trends, the solvent molecules tend to the bulk rather than come close to a curcumin molecule. Similar trends are observed for the PDFs O9-O22.
3.5 Spatial distributions
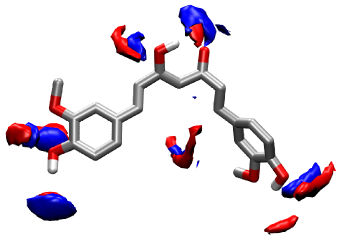
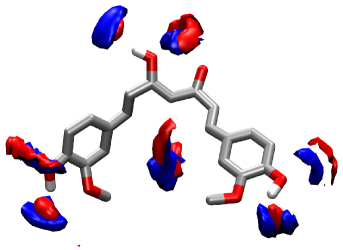
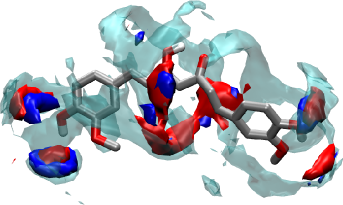
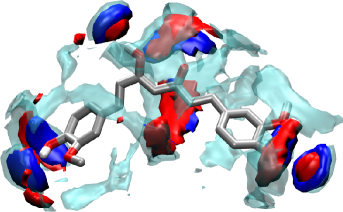
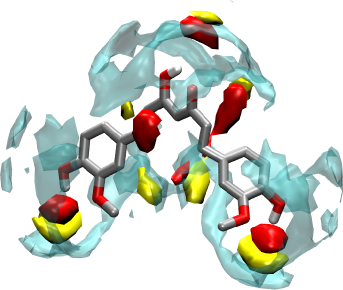
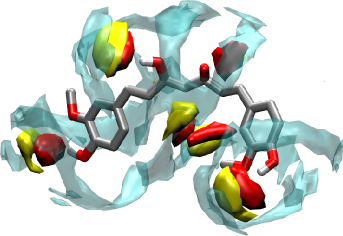
Additional insights into the solvent surrounding the curcumin molecule that are not accessible from the PDFs, follow from the analyses of the spatial density distribution of solvent species. The corresponding plots have been built with the use of the VMD software [31] in the form of isosurfaces (figures 11, 12 and 13). The input data for the construction of isosurfaces of the three-dimensional density distribution function (SDF) of solvent molecules are calculated from the simulation trajectories. Each of the trajectories were obtained from the independent ns runs performed in the NVT ensemble and for the fixed positions of sites of the curcumin molecule. The values of number density for the construction of isosurfaces were chosen to make the plots as illustrative as possible. For water oxygen, it is 0.15, whereas for methanol oxygen — 0.045 and finally for DMSO oxygen — 0.050.
We have considered two specific conformations of curcumin, which correspond to the enol hydrogen pointing toward and outward the ketone group, respectively. In figures 11, 12 and 13 we discern four main regions of solvent molecules involved into curcumin surroundings: (i) two regions with molecules near the side rings, (ii) a region near the enol group and (iii) near the spacer between the rings. It should be noted that these regions can be split into groups. Thus, for water and MeOH, one can observe two distinct groups near each of the side rings in the region (i). This can be attributed to the formation of hydrogen bonds between the corresponding hydroxyl groups and molecules of these solvents. A similar splitting can be seen near the hydroxyl group of enol and the ketone group in the region (ii). A different situation has been found for the DMSO solvent. Since in this case hydrogen bonding is absent, such splitting does not occur. Moreover, it is seen that the region (ii) is affected by the enol group conformation.
In the case of water solvent, the reorientation of water molecules in the groups of the region (ii) is observed due to the change of enol conformation. Finally, in all solvents, certain amount of molecules are concentrated in the region (iii). However, in water and MeOH, the molecules are grouped into belt-like cluster, while the DMSO molecules form several distinct clusters of a rather high density, which corresponds to the first maximum of the PDF C16-OX in figure 10.
3.6 Hydrogen bonds
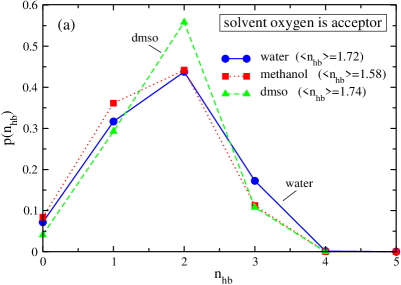
Solvent molecules in the vicinity of curcumin molecule are involved in the hydrogen bond (HB) formation. We have calculated the number of HBs, , between the oxygens or hydrogens of solvent molecules and the groups of curcumin molecule, that contain oxygens (O14, O18, O5/O27, O2/O29). GROMACS software was used for this purpose. In order to identify the hydrogen bonds, we applied a commonly used two-parameter geometric criterium, where donor-acceptor distance should be shorter than nm while the angular cut-off is taken equal to degrees. It is worth noting that oxygens of water and MeOH molecules can act both as proton donors and proton acceptors, while oxygen of DMSO can be a hydrogen bond acceptor exclusively.
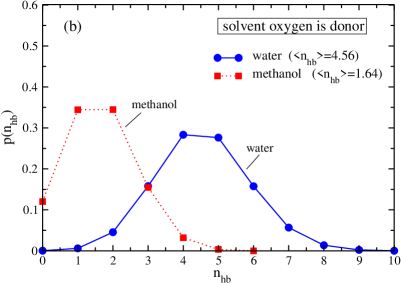
In figure 14 we present the histograms of the probability distributions of the number of HBs. It is observed that if an oxygen of the solvent acts as acceptor, the distributions for all the solvents studied are close to each other. Moreover, the maxima of these distributions obtained for water and MeOH are practically the same, and they yield a maximum at . The corresponding maximum for DMSO is somewhat higher, but for as well. On the other hand, when oxygens of a solvent are donors, the results are different. Since the DMSO oxygen cannot be a donor, the corresponding function is not present. The distribution of HBs for water is shifted toward higher values of , and the most probable number of HBs is in the interval . This distribution has a big dispersion yielding non-zero values of probability density even for equal to . On the other hand, for MeOH, the distributions in figure 14 (b) are not very different from that shown in figure 14 (a). For water, the average values of in the donor case are much larger than in the acceptor case ( against , respectively), while for MeOH, the corresponding values are rather close to each other.
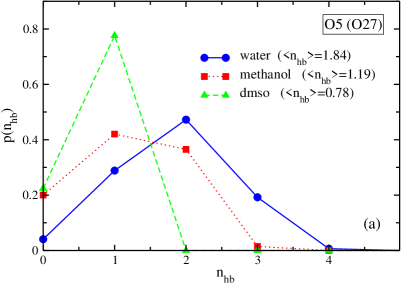
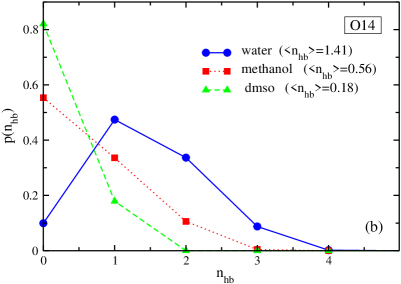
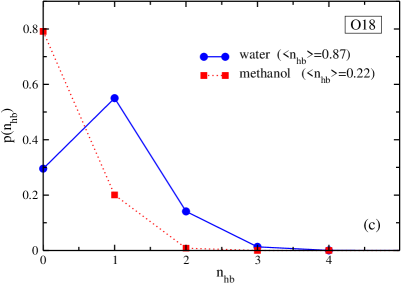
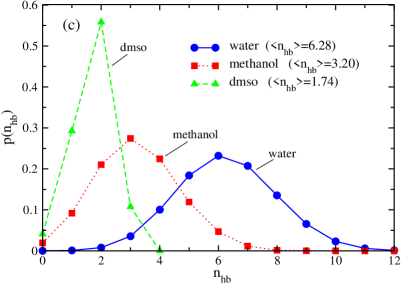
Finally, in figure 14 (c), we present the probability distributions of the total number of the HBs formed between solvent particles and the curcumin molecule, regardless of the role of solvent oxygens (acceptor or donor) in hydrogen bonding. It follows that the most probable number of HBs formed between water and curcumin is equal to , for MeOH it is and for DMSO it is equal to . We have also calculated the averaged numbers of HBs for curcumin in each of the solvents (table 3). The average number of HBs for water as solvent is . It is almost twice higher than the estimate for MeOH (). At the same time, for MeOH is almost twice higher than the one calculated for DMSO ().
| water | MeOH | DMSO | |||||
| acceptor | donor | both | acceptor | donor | both | acceptor | |
| O14 | 0.40 | 1.01 | 1.41 | 0.25 | 0.31 | 0.56 | 0.18 |
| O18 | 0.87 | 0.87 | 0.22 | 0.22 | |||
| O5/O27 | 0.66 | 1.18 | 1.84 | 0.66 | 0.53 | 1.19 | 0.78 |
| O2/O29 | 0.16 | 0.16 | 0.02 | 0.02 | |||
| Sum | 1.72 | 4.56 | 6.28 | 1.58 | 1.64 | 3.20 | 1.74 |
In addition, we have analyzed the number of HBs formed with the particular groups of the curcumin molecule. It is shown in figure 15 that the major contribution to the total number of HBs follows from the oxygens of phenol groups (O5/O27). For water, the most probable number of HBs occurring between the phenol groups and water is found to be equal to , for MeOH this value is in the interval whereas for DMSO it is always unity.
The probability of the formation of two HBs between distinct water molecules with the enol group (O14) is rather high, but this is not the case for MeOH molecules that prefer to form a single bond. For DMSO, only a single H-bond with the enol group can be formed, although with a rather small probability. Furthermore, hydrogen bonds can be formed between water molecules and ketone group (O18), figure 15 (c). One hydrogen bond can be formed between them with reasonable probability, the formation of two bonds being much less probable. In DMSO, a single hydrogen bond can be formed, again with low probability. The hydrogen bonding between solvent species and the anisole groups is quite a rare event. The average numbers of HBs from our calculations are summarized in table 3.
3.7 Self-diffusion coefficient
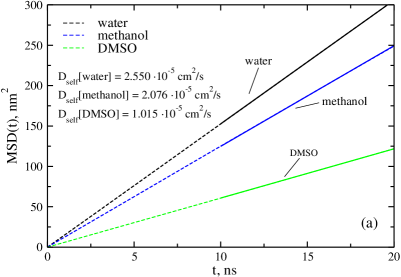
The dynamic properties of a solute can be strongly affected by the solvent environment. The self-diffusion coefficient, , of a single curcumin molecule in three solvents is estimated from the mean-square displacement (MSD) dependence on time, according to the Einstein relation [32],
| (2) |
where is the time origin. This expression is used for each species. First, we have checked the shape of the MSDs and the values for self-diffusion coefficients for pure solvents that follow directly from the GROMACS software [figure 16 (a)]. Time interval ns was used, the curves for MSD are almost linear therein. The obtained results agree reasonably well with the already reported values for various models of solvents considered [33, 34, 35, 36, 37].
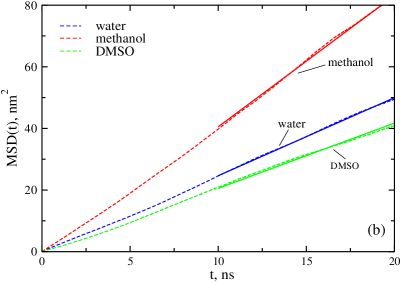
A similar procedure was then used to obtain the self-diffusion coefficient of curcumin in each solvent [figure 16 (b)]. The results for a single curcumin molecule follow from the trajectory of the center of mass (COM) that can be conveniently generated by software. Moreover, the COM MSD functions on time coming from each run (50 ns) were collected to yield the average COM MSD curve, which is plotted in the figure. Then, the value was evaluated from the slope.
As one can see, the smallest value of is found for curcumin in DMSO ( cm2/s). In water, it is somewhat higher ( cm2/s). A much higher value for has been obtained for curcumin in MeOH ( cm2/s). We are not aware of the experimental data for the self-diffusion coefficient of curcumin molecule at infinite dilution in the solvents considered. On the other hand, the self-diffusion coefficient of curcumin in water and methanol was reported by Samanta and Roccatano [12] from MD simulation for their curcumin model. Contrary to our results, they obtained of curcumin in water higher than in methanol and their absolute values are much higher than ours. This discrepancy can be due to the SPC model used in [12] whereas we used the SPC/E model. Additional calculations are necessary to reach a definite conclusion.
Nevertheless, in order to validate our results, we used the procedure based on the Stokes-Einstein equation,
| (3) |
where is the hydrodynamic radius and is the solvent viscosity. Applying the definition,
| (4) |
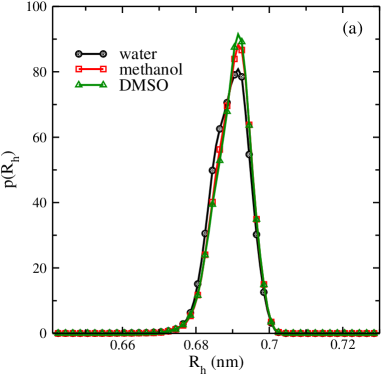
we have calculated the hydrodynamic radius for curcumin in three solvents. The histograms of the probability distributions of are shown in figure 17 (a) and the corresponding average values can be found in table 4.
| solvent | , nm | , nm | , Pas | , cm2s-1 | , cm2s-1 |
|---|---|---|---|---|---|
| water | 0.689 | 0.519 | 0.890 | 0.356 | 0.423 |
| methanol | 0.690 | 0.523 | 0.545 | 0.580 | 0.710 |
| DMSO | 0.690 | 0.525 | 1.996 | 0.158 | 0.353 |
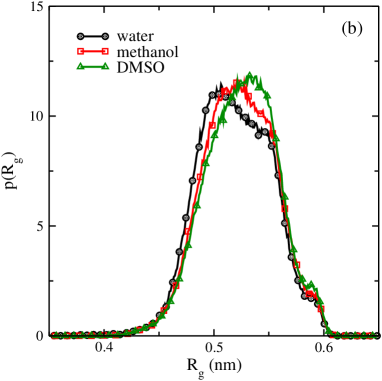
It could be seen that the most probable values for hydrodynamic radius of curcumin practically does not change with the solvent. More pronounced changes are observed for the radius of gyration ,
| (5) |
| (6) |
as it follows from the results in figure 17 (b) given in the form of histograms of probability distributions. The average values for are included in table 4. The experimental values of viscosity of water, methanol and DMSO are given in table 4 as well. We have found that the values for the self-diffusion coefficient calculated from the equation (4) exhibit similar trends upon changing the solvent as obtained from the MSDs. However, the values differ quantitatively. One of possible reasons is that equation (3) is approximate and does not take into account the molecular shape. However, we do not expect that the observed trends would be reversed.
3.8 Summary and conclusions
To conclude, in this work we have presented a very detailed description of the properties of model solutions consisting of a single curcumin molecule in 2000 molecules of water, MeOH and DMSO solvent. We have evaluated and analyzed the changes of the internal structure of a curcumin molecule in terms of dihedral angles, most important characteristic distances between particular atoms as well as the distances and angles between segments of the molecule. The solvent effect on the value of the dipole moment of a curcumin molecule has been elucidated. An interface between the molecule and solvent surroundings has been characterized in terms of pair distribution functions, coordination numbers and spatial distribution density maps. Quantitative description of the probability of cross hydrogen bonds between atoms of a curcumin molecule and solvent species has been given. Self-diffusion coefficient of curcumin in three solvents has been evaluated and analyzed.
Our principal findings comprise the following points. The intrinsic bending of the molecule already discussed in vacuum [18] is affected by different solvents differently. In water, the molecule avoids contacts with solvent particles and becomes even more bent whereas in MeOH and DMSO, more extended conformations are observed. We believe that this behavior can be attributed to an overall hydrophobicity of the molecule. However, it would be of interest to test this hypothesis using two or more curcumin molecules in different solvents. “Switching” of the enol hydrogen is an important event as well, inward and outward conformations of this atom occur with different frequency upon changing the solvent. This behavior was analyzed in terms of the corresponding dihedral angle and histograms of the distance distribution. A similar effect has been discussed in [12] within the framework of another curcumin model. Both, the bending trends and “switching” of the enol hydrogen contribute to the resulting value of the dipole moment of the molecule in solvent media. Larger values of the magnitude of the dipole moment in comparison with vacuum [40, 18] are observed.
The pair distribution functions built for particular atoms of a curcumin molecule with solvent species reflect that the surroundings of the molecule are heterogenous in terms of density, higher density is probable around phenol groups whereas “desorption” type effects are more probable close to enol group. The formation of cross hydrogen bonds is most probable therein. Seemingly, the formation of hydrogen bonds counterarrests hydrophobicity of certain fragments of the molecule, while in water this effect is weak. The solvent density is perturbed in approximately single layer around phenol groups whereas it is more extended around the enol fragment. Important effects can be seen in the second layer therein. Coordination numbers of particular atoms and density distribution maps illustrate a solvent distribution around the molecule at a quantitative and at a qualitative level.
In the final part of this work, our results are given for the self-diffusion coefficient of a curcumin molecule in three solvents. We presented additional arguments to prove that the trends observed upon changing the solvent are correct by performing auxiliary calculations having involved concepts of radius of gyration and hydrodynamic radius.
It is of much interest to extend this study along several lines. For the moment, it seems most important to perform comparisons of the behavior of a single curcumin molecule in other protic and aprotic solvents and extend present calculations to a finite concentration interval for curcumin molecules in the spirit of recent work [13]. Construction of bridges to experimental observations is not just desirable but certainly indispensable for a better understanding of curcumin solutions with simultaneous improvement of the force fields.
Acknowledgements
O.P. is grateful to D. Vazquez and M. Aguilar for technical support of this work at the Institute of Chemistry of UNAM. Fruitful discussions with Dr. Manuel Soriano and Dr. Hector Dominguez are gratefully acknowledged. T.P. acknowledges allocation of computer time at the cluster of ICMP of the National Academy of Science of Ukraine and Ukrainian National Grid.
References
- [1] Ghosh S., Banerjee S., Sil P.C., Food Chem. Toxicol., 2015, 83, 111, doi:10.1016/j.fct.2015.05.022.
- [2] Kumar G., Mittal S., Sak K., Tuli H.S., Life Sci., 2016, 148, 313, doi:10.1016/j.lfs.2016.02.022.
- [3] Luthra P.M., Lal N., Eur. J. Med. Chem., 2016, 109, 23, doi:10.1016/j.ejmech.2015.11.049.
-
[4]
Mehanny M., Hathout R.M., Geneidi A.S., Mansour S., J. Controlled Release, 2016, 225, 1,
doi:10.1016/j.jconrel.2016.01.018. - [5] Ngo S.T., Li M.S., Mol. Simul., 2013, 39, 279, doi:10.1080/08927022.2012.718769.
- [6] Nelson K.M., Dahlin J.L., Bisson J., Graham J., Pauli G.F., Walters M.A., J. Med. Chem., 2017, 60, 1620, doi:10.1021/acs.jmedchem.6b00975.
- [7] Wright J.S., J. Mol. Struct. THEOCHEM, 2002, 591, 207, doi:10.1016/S0166-1280(02)00242-7.
- [8] Ngo S.T., Li M.S., J. Phys. Chem. B, 2012, 116, 10165, doi:10.1021/jp302506a.
- [9] Suhartanto H., Yanuar A., Hilman M.H., Wibisono A., Dermawan T., Int. J. Comput. Sci. Issues, 2012, 9, No. 2, 90.
- [10] Varghese M.K., Molecular Dynamics Simulations of Some Nucleic Acids and their Complexes, Ph.D. thesis, Mahatma Gandhi University, Kottayam, Kerala, India, 2009.
- [11] Wallace S.J., Kee T.W., Huang D.M., J. Phys. Chem. B, 2013, 117, 12375, doi:10.1021/jp406125x.
- [12] Samanta S., Roccatano D., J. Phys. Chem. B, 2013, 117, 3250, doi:10.1021/jp309476u.
- [13] Hazra M.K., Roy S., Bagchi B., J. Chem. Phys., 2014, 141, 18C501, doi:10.1063/1.4895539.
- [14] Sreenivasan S., Alameen M., Krishnakumar S., Vetrivel U., Int. J. Pharm. Pharm. Sci., 2014, 6, 234.
- [15] Yadav I.S., Nandekar P.P., Shrivastava S., Sangamwar A., Chaudhury A., Agarwal S.M., Gene, 2014, 539, 82, doi:10.1016/j.gene.2014.01.056.
-
[16]
Parameswari A.R., Rajalakshmi G., Kumaradhas P., Chem. Biol. Interact., 2015, 225, 21,
doi:10.1016/j.cbi.2014.09.011. - [17] Priyadarsini K.I., J. Photochem. Photobiol. C, 2009, 10, 81, doi:10.1016/j.jphotochemrev.2009.05.001.
- [18] Ilnytskyi J., Patsahan T., Pizio O., J. Mol. Liq., 2016, 223, 707, doi:10.1016/j.molliq.2016.08.098.
- [19] Slabber C.A., Grimmer C.D., Robinson R.S., J. Nat. Prod., 2016, 79, 2726, doi:10.1021/acs.jnatprod.6b00726.
- [20] Van der Spoel D., Lindahl E., Hess B., Groenhof G., Mark A.E., Berendsen H.J.C., J. Comput. Chem., 2005, 26, 1701, doi:10.1002/jcc.20291.
- [21] Kawano S.-I., Inohana Y., Hashi Y., Lin J.-M., Chin. Chem. Lett., 2013, 24, 685, doi:10.1016/j.cclet.2013.05.006.
- [22] Kolev T.M., Velcheva E.A., Stamboliyska B.A., Spiteller M., Int. J. Quantum Chem., 2005, 102, 1069, doi:10.1002/qua.20469.
-
[23]
Cornago P., Claramunt R.M., Bouissane L., Alkorta L., Elguero J.,
Tetrahedron, 2008, 64, 8089,
doi:10.1016/j.tet.2008.06.065. - [24] Berendsen H.J.C., Grigera J.R., Straatsma T.P., J. Phys. Chem., 1987, 91, 6269, doi:10.1021/j100308a038.
- [25] Van Leeuwen M.E., Smit B., J. Phys. Chem., 1995, 99, 1831, doi:10.1021/j100007a006.
- [26] Jorgensen W.L., Maxwell D.S., Tirado-Rives J., J. Am. Chem. Soc., 1996, 118, 11225, doi:10.1021/ja9621760.
- [27] Oostenbrink C., Villa A., Mark A.E., van Gunsteren W.F., J. Comput. Chem., 2004, 25, 1656–1676, doi:10.1002/jcc.20090.
- [28] Rosta E., Buchete N.-V., Hummer G., J. Chem. Theory Comput., 2009, 5, 1393, doi:10.1021/ct800557h.
- [29] Hezaveh S., Samanta S., Milano G., Roccatano D., J. Chem. Phys., 2011, 135, 164501, doi:10.1063/1.3643417.
-
[30]
Kurokawa Y., Kojima H., Yamada A., Okazaki S., Mol. Simul., 2012, 38, 442,
doi:10.1080/08927022.2011.566609. - [31] Humphrey W., Dalke A., Schulten K., J. Mol. Graphics, 1996, 14, 33, doi:10.1016/0263-7855(96)00018-5.
- [32] Hansen J.P., McDonald I.R., Theory of Simple Liquids, Academic Press, London, 2006.
- [33] Liu H., Mueller-Plathe F., van Gunsteren W.F., J. Am. Chem. Soc., 1995, 117, 4363, doi:10.1021/ja00120a018.
- [34] Vishnyakov A., Lyubartsev A.P., Laaksonen A., J. Phys. Chem. A, 2001, 105, 1702, doi:10.1021/jp0007336.
- [35] Van der Spoel D., van Maaren P.J., J. Chem. Theory Comput., 2006, 2, 1, doi:10.1021/ct0502256.
- [36] Wu Y., Tepper H.L., Voth G.A., J. Chem. Phys., 2006, 124, 024503, doi:10.1063/1.2136877.
- [37] Guevara-Carrion G., Nieto-Draghi C., Vrabec J., Hasse H., J. Phys. Chem. B, 2008, 112, 16664, doi:10.1021/jp805584d.
-
[38]
González B., Calvar N., Gómez E., Domínguez Á., J. Chem. Thermodyn., 2007,
39, 1578,
doi:10.1016/j.jct.2007.05.004. -
[39]
Grande M.C., Juliá J.A., García M., Marschoff C.M., J. Chem. Thermodyn., 2007,
39, 1049,
doi:10.1016/j.jct.2006.12.012. - [40] Párkányi C., Stem-Beren M.R., Martínez O.R., Aaron J.-J., Bulaceanu-MacNair M., Arrieta A.F., Spectrochim. Acta, Part A, 2004, 60, 1805, doi:10.1016/j.saa.2003.07.013.
Ukrainian \adddialect\l@ukrainian0 \l@ukrainian
Âëàñòèâîñòi OPLS-UA ìîäåëi îäíiє¿ ìîëåêóëè êóðêóìiíó ó âîäi, ìåòàíîëi òà äèìåòèëñóëüôîêñèäi. Ðåçóëüòàòè êîìï’þòåðíîãî ìîäåëþâàííÿ ìåòîäîì ìîëåêóëÿðíî¿ äèíàìiêè Ò. Ïàöàãàí, ß.Ì. Iëüíèöüêèé, Î. Ïiçiî
Iíñòèòóò ôiçèêè êîíäåíñîâàíèõ ñèñòåì ÍÀÍ Óêðà¿íè, âóë. Ñâєíöiöüêîãî, 1, 79011 Ëüâiâ, Óêðà¿íà
Iíñòèòóò ìàòåðiàëîçíàâñòâà, Íàöiîíàëüíèé àâòîíîìíèé óíiâåðñèòåò ì. Ìåõiêî, Ìåõiêî, Ìåêñèêà