Sunspot Light Walls Suppressed by Nearby Brightenings
Abstract
Light walls, as ensembles of oscillating bright structures rooted in sunspot light bridges, have not been well studied, although they are important for understanding sunspot properties. Using the Interface Region Imaging Spectrograph and Solar Dynamics Observatory observations, here we study the evolution of two oscillating light walls each within its own active region (AR). The emission of each light wall decays greatly after the appearance of adjacent brightenings. For the first light wall, rooted within AR 12565, the average height, amplitude, and oscillation period significantly decrease from 3.5 Mm, 1.7 Mm, and 8.5 min to 1.6 Mm, 0.4 Mm, and 3.0 min, respectively. For the second light wall, rooted within AR 12597, the mean height, amplitude, and oscillation period of the light wall decrease from 2.1 Mm, 0.5 Mm, and 3.0 min to 1.5 Mm, 0.2 Mm, and 2.1 min, respectively. Particularly, a part of the second light wall becomes even invisible after the influence of nearby brightening. These results reveal that the light walls are suppressed by nearby brightenings. Considering the complex magnetic topology in light bridges, we conjecture that the fading of light walls may be caused by a drop in the magnetic pressure, where flux is cancelled by magnetic reconnection at the site of the nearby brightening. Another hypothesis is that the wall fading is due to the suppression of driver source (p-mode oscillation), resulting from the nearby avalanche of downward particles along reconnected brightening loops.
Subject headings:
sunspots — Sun: chromosphere — Sun: photosphere — Sun: UV radiation1. INTRODUCTION
Light bridges are bright structures deeply anchored in the convection zone, and they are often accounted for the incompletely suppressed convection (Sobotka et al. 1993; Borrero & Ichimoto 2011; Lagg et al. 2014). The magnetic field in a light bridge is mostly much weaker than the neighboring umbra (Rueedi et al. 1995; Jurčák et al. 2006; Sobotka et al. 2013). Analysing images obtained in the 1600 Å ultraviolet (UV) channel of the Transition Region and Coronal Explorer, Berger & Berdyugina (2003) found persistent brightness enhancements over a light bridge. In some other studies, more dynamic brightenings and surges were observed in the lower atmosphere above sunspot light bridges (Asai et al. 2001; Shimizu et al. 2009; Tian et al. 2014; Louis et al. 2014; Toriumi et al. 2015a, b; Robustini et al. 2016; Song et al. 2017).
Combining observations of AR 12192 made by the New Vacuum Solar Telescope (Liu et al. 2014) and Interface Region Imaging Spectrograph (IRIS; De Pontieu et al. 2014), Yang et al. (2015) found an ensemble of oscillating bright structures rooted in a light bridge and named it light wall. The light wall, especially the wall top, is much brighter than the surroundings. Yang et al. (2015) suggested that the light wall oscillations are caused by the leakage of p-modes from the sub-photosphere. Bharti (2015) also noted that a wave phenomenon seems to be responsible for the coherent behavior of neighbouring oscillating structures above the light bridge. Afterward, a survey of seven-month IRIS observations by Hou et al. (2016a) reveals that most light walls are rooted in light bridges. Recently, Zhang et al. (2017) analyzed IRIS spectral data of a light wall which also exhibits pronounced oscillations in the height of the light wall. They deduced from the blue- and red-shifted Doppler signals that the oscillations are likely caused by shocked p-mode waves originated from the sub-photosphere.
Last but not least, Yang et al. (2016) found that, when falling material reached the base of a light wall, the height and brightness of the light wall increased, implying that the light wall can be enhanced by external disturbance. Different from the light wall enhancement, we report in the present Letter an unusual and puzzling phenomenon, i.e., light walls can be significantly weakened due to the suppression of nearby brightenings observed by IRIS and the Solar Dynamics Observatory (SDO; Pesnell et al. 2012).
2. OBSERVATIONS AND DATA ANALYSIS
An associated animation (Movie1.mp4) of this figure is available.
An associated animation (Movie2.mp4) of this figure is available.
An animation (Movie3.mp4) relevant to this figure is available.
An animation (Movie4.mp4) relevant to this figure is available.
We study two light walls suppressed by nearby brightenings. The first event (Event 1) was observed by IRIS from 22:04:13 UT on 2016 July 22 to 02:08:33 UT on July 23 with a cadence of 37 s. The second one (Event 2) was observed also by IRIS from 12:01:52 UT to 19:30:10 UT on 2016 September 26 with a cadence of 21 s. For each event, there are four series of images obtained with Slit-Jaw Imager (SJI) in 2832 Å, 2796 Å, 1330 Å, and 1400 Å channels. These SJI images have a pixel size of 0.″333 and a field-of-view (FOV) of 120″ 119″. The Atmospheric Imaging Assembly (AIA; Lemen et al. 2012) on-board SDO monitors the Sun in ten (E)UV lines with a pixel size of 0.6 and cadence of (12)24 s. For these two events, we mainly focus on two sequences of AIA 94 Å images in order to study the loop brightenings nearby the light walls. To coalign the IRIS images with the AIA intensity maps, we use concurrently taken continuum images from the Helioseismic and Magnetic Imager (HMI; Scherrer et al. 2012) on-board SDO. Each sequence of the SDO data are processed to Level 1.5 by applying the standard routine aia_prep.pro and then differentially rotated to a reference time. Thus the AIA and HMI images are automatically aligned. Next, we coalign the IRIS 2832 Å data with the HMI intensity maps using the cross-correlation method (setpts.pro available as part of the SSWIDL software tree).
3. RESULTS
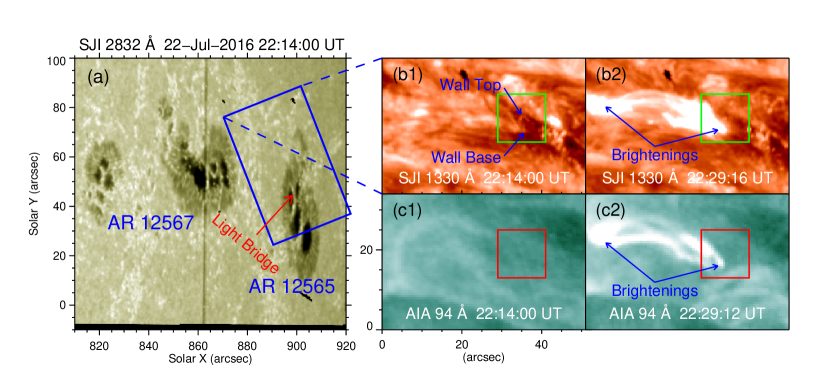
The first light wall is rooted in a light bridge (denoted by the red arrow in Figure 1(a)) within AR 12565, which is located at the west of AR 12567 and close to the west limb of the solar disk. At 22:14:00 UT, the light wall, especially the wall top and wall base (pointed by two arrows in panel (b1)) can be identified in the SJI 1330 Å image. At the left side, nearby the light wall, a set of loops with length of about 25 Mm brightened, which were quite conspicuous at 22:29:16 UT (the footpoints of these loops are marked by arrows in panel (b2)). Since the appearance of the light wall and nearby brightenings in SJI 1400 Å images are similar to that in 1330 Å images, we do not show the 1400 Å images here. In the simultaneous AIA image, the loops were very bright in the EUV 94 Å line (panel (c2); also see the animation of Figure 1). The loop brightening corresponds to a B5.6 flare with the peak at 22:30 UT, according to the Geostationary Operational Environmental Satellite soft x-ray flare classification. However, the loops were invisible in 94 Å 15 min ahead (see panel (c1)).
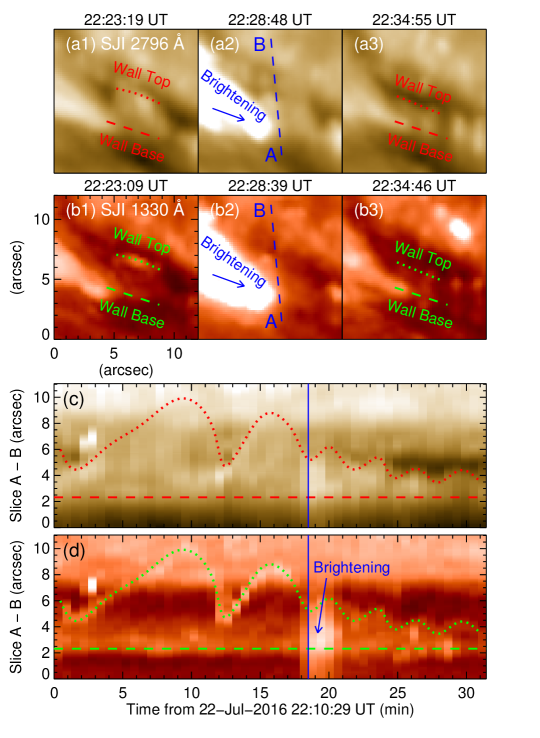
Figures 2(a1)-(a3) and the associated animation show the light wall in SJI 2796 Å before, during, and after the influence of the nearby brightening, respectively. The corresponding appearances in SJI 1330 Å are presented in panels (b1)-(b3). The top and base of the light wall are identified from both the 1330 Å and 2796 Å images. At 22:23 UT, the projected height (the distance between the wall top and wall base) was about 2.1 Mm (see panels (a1) and (b1)). The nearby brightening extended to the light wall from the left side and then impacted on the wall base (panels (a2) and (b2)). After that, the light wall became much fainter and less pronounced, both in emission and height (panels (a3) and (b3)). To study the fading of the light wall, we derive two time-distance plots (see panels (c) and (d)) from two sequences of SJI 2796 Å and 1330 Å images along slice “A–B” (marked by blue dashed lines in panels (a2) and (b2)). From analysing the time-distance plots in panels (c) and (d), we conclude that the wall top moved upward and downward successively, indicating an oscillatory pattern in the height of the light wall. At the time around 22:29 UT (marked by the vertical lines), the brightening nearby the wall (denoted by the blue arrow) began to affect the light wall. The average height of the light wall before this influence was about 3.5 Mm. Due to the influence caused by the brightening, the mean height of the light wall decreased to 1.6 Mm. The average amplitude of the associated oscillation also decreased, from 1.7 Mm to 0.4 Mm. In addition, the oscillation period of the light wall has also changed. In the 18.5 min interval preceding the interaction with the brightening, the mean period of oscillation was about 8.5 min, and after the interaction, it has dropped down to about 3.0 min in the following 13 min interval.
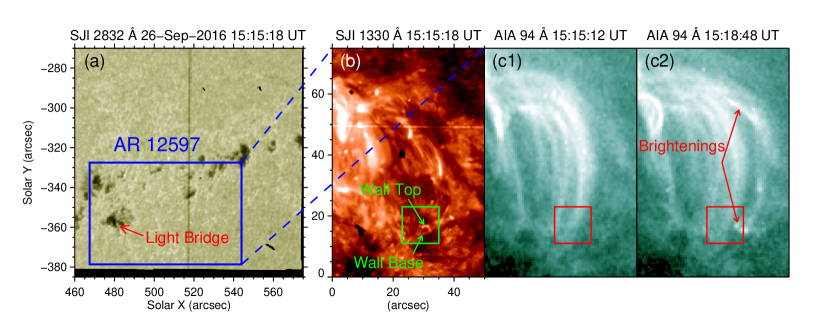
The second light wall is located within the emerging AR 12597 (see Figure 3(a)). We note that, there is another light bridge (pointed by the red arrow in panel (a)) in one sunspot of the AR. In the SJI 1330 Å image (panel (b)), a light wall rooted in the light bridge can be clearly identified, and its top and base are marked by two green arrows. However, the light wall was almost invisible in the AIA 94 Å image at 15:15:12 UT (panel (c1)). Several minutes later, a set of coronal loops with an average length of about 45 Mm brightened, i.e., that this is an estimated length, as highlighted by the arrows in panel (c2) (also see the animation of Figure 3). The loop brightening corresponds to a B2.5 flare with the peak at 15:20 UT. We note that the loop set itself connects to the opposite polarity fields of the AR, and, one of its ends appears as brighter points (marked by the lower arrow), located nearby the base of the light wall.
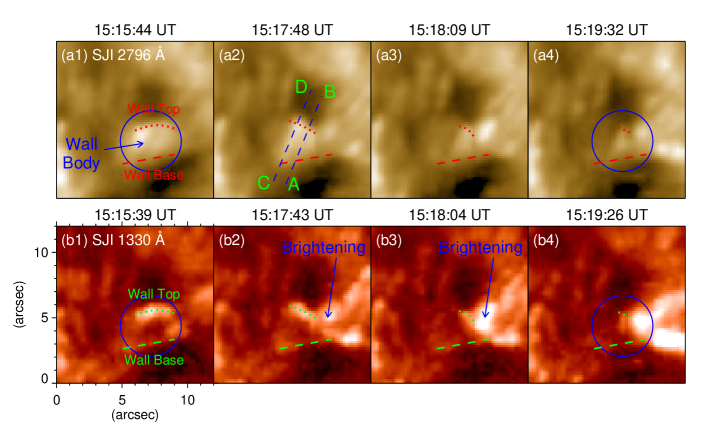
Figure 4(a1) shows that the light wall (outlined by the blue circle) is brighter than the surrounding area observed in SJI 2796 Å. In the SJI 1330 Å line, the emissions of the wall top and wall base are much higher than those of the wall body and the surrounding region (see panel (b1)). The right side nearby region of the light wall brightened and was very appealing at 15:17:43 UT in SJI 1330 Å, as indicated by the arrow in panel (b2). Then, the brightening became more violent and affected the light wall at 15:18:04 UT, as shown in panels (a3) and (b3). The left part of the light wall (overlaid by slice “C-D”) almost disappeared, and only the right part (overlaid by slice “A-B”) remained (also see the animation of Figure 4). One and a half minutes later, the right part of the light wall became more faint in both 2796 Å and 1330 Å (see panels (a4) and (b4)).
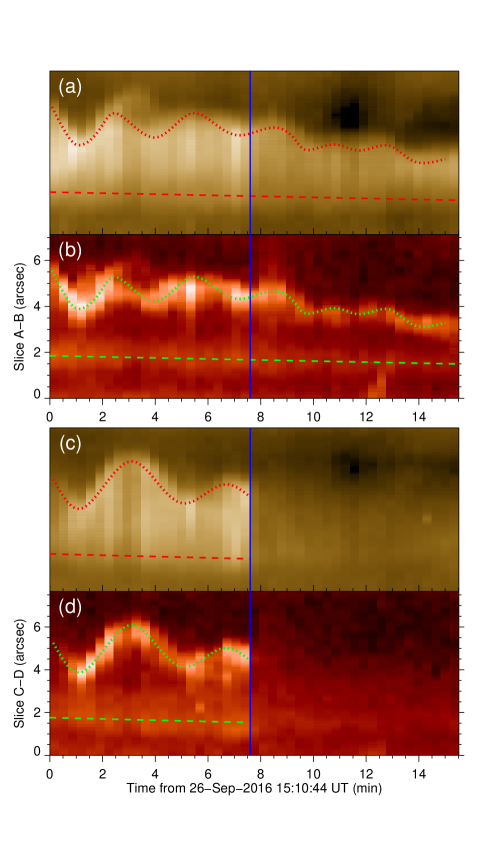
In order to study the change of the light wall and to explore the corresponding cause(s) behind, we construct the time-distance plots along slices “A–B” and “C-D” (marked in Figure 4(a2)), which cross the right and left parts of the light wall, respectively. Figures 5(a) and 5(b) are the time-distance plots obtained along slice “A–B” from SJI 2796 Å and 1330 Å, respectively. We can see that, in the 7.5 min interval before 15:18 UT (the start time of brightening marked by the vertical line), the light wall (exactly the right part of the wall) was very bright, and its mean height was about 2.1 Mm. The mean amplitude and oscillation period were about 0.5 Mm and 3.0 min, respectively. After the influence caused by the brightening, the light wall became less prominent, as e.g., the wall height decreased to about 1.5 Mm; the mean amplitude became 0.2 Mm and the oscillation period dropped down to around 2.1 min in the following 8 min. Along slice “C–D”, two time-distance plots, derived from the SJI 2796 Å and 1330 Å images, are presented in Figures 5(c) and 5(d), respectively. The light wall (in particular, the left part of the wall) before 15:18 UT appeared as a bright oscillating structure with the oscillation period of about 4 min. Finally, after 15:18 UT, the light wall suddenly disappeared.
4. CONCLUSIONS AND DISCUSSION
Using IRIS and SDO multi-wavelength observations, we studied here two oscillating light walls within two active regions. Due to the influence of nearby brightenings, the brightness of each light wall decayed greatly. For the first light wall, rooted within AR 12565, the average height, amplitude, and oscillation period significantly decreased from 3.5 Mm, 1.7 Mm, and 8.5 min to 1.6 Mm, 0.4 Mm, and 3.0 min, respectively. For the second light wall, rooted within AR 12597, the mean height, amplitude, and oscillation period of the right part of the light wall decreased from 2.1 Mm, 0.5 Mm, and 3.0 min to 1.5 Mm, 0.2 Mm, and 2.1 min, respectively. Especially, the left part of the second light wall became invisible after the influence of nearby brightening. Our results imply that these two light walls are suppressed by nearby brightenings.
In the study of Hou et al. (2016b), a light wall in AR 12403 was disturbed by an eruptive flare. The light wall was suggested to share a group of magnetic lines with the flaring loops, and the height variation of the light wall was interpreted with the projection effect due to the inclination changes. The upward pushing of large-scale loops lets the light wall turn to the vertical direction, thus resulting in the increase of the projective height of the wall. Afterward, the formation of low-lying post-flare loops makes the light wall seem to be lower in projection since the light wall inclined. However, in the present study, there are only some loop brightenings (denoted by the arrows in Figures 1(c2) and 3(c2)) instead of eruptive flares. The loop brightenings seem to be caused by magnetic reconnection among braided field lines, which is different from the eruptive flares with dramatic inclination changes due to the rise of stretching lines and the formation of post-flare loops. Therefore, the cartoons in Hou et al. (2016b) cannot be used to explain the decreases of the height, amplitude, oscillation period, and brightness of the light walls studied in the present work.
Solar flares often eject material from the lower atmosphere into the corona, and some material may fall back to the solar surface. Yang et al. (2016) noted, when the falling material reaches the base of a light wall, the kinetic energy is converted to thermal energy. The heated material of the light wall let the wall itself be much brighter. The pressure at the wall base increases, which powers the light wall to reach greater heights. Different from the light wall enhancement by falling material, our results in the present study reveal that the light walls are suppressed by nearby brightenings. Since the height of a light wall can be determined by the pressure at the wall base, applying the logic presented in Yang et al. (2016), one would expect here a pressure decrease caused by the nearby brightening. This decrease could be, e.g., due to a drop in the magnetic pressure, where flux is cancelled by magnetic reconnection at the site of the nearby brightening. The intermittent reconnection may cause the changes of the light wall oscillation periods. Another opinion may be that the decrease of light walls properties (e.g., its height) is due to the suppression of the driver source (p-mode oscillation) itself, resulting from the nearby hit of downward bulk plasma along reconnected brightening loops. Recent studies have revealed that the magnetic fields in sunspot light bridges are quite complex (Louis et al. 2015; Toriumi et al. 2015a, b; Yuan & Walsh 2016). For example, Toriumi et al. (2015b) found that, in the light bridge, the magnetic field lines are highly inclined (almost horizontal to the solar surface in the direction along the light bridge) and appear as serpentine or arched structures. Thus, here we propose that, when the downward propagating bulk plasma hits the light bridge possessing a complex magnetic topology, it can not only affect the impact site but also influences the nearby light wall rooted in the light bridge. However, the exact mechanism for the light wall fading is not yet clear, and to further explore we need more observations and (MHD) modeling.
References
- Asai et al. (2001) Asai, A., Ishii, T. T., & Kurokawa, H. 2001, ApJ, 555, L65
- Berger & Berdyugina (2003) Berger, T. E., & Berdyugina, S. V. 2003, ApJ, 589, L117
- Bharti (2015) Bharti, L. 2015, MNRAS, 452, L16
- Borrero & Ichimoto (2011) Borrero, J. M., & Ichimoto, K. 2011, Living Reviews in Solar Physics, 8, 4
- De Pontieu et al. (2014) De Pontieu, B., Title, A. M., Lemen, J. R., et al. 2014, Sol. Phys., 289, 2733
- Hou et al. (2016) Hou, Y. J., Li, T., Yang, S. H., & Zhang, J. 2016a, A&A, 589, L7
- Hou et al. (2016) Hou, Y. J., Zhang, J., Li, T., Yang, S. H., et al. 2016b, ApJ, 829, L29
- Jurčák et al. (2006) Jurčák, J., Martínez Pillet, V., & Sobotka, M. 2006, A&A, 453, 1079
- Lagg et al. (2014) Lagg, A., Solanki, S. K., van Noort, M., & Danilovic, S. 2014, A&A, 568, A60
- Lemen et al. (2012) Lemen, J. R., Title, A. M., Akin, D. J., et al. 2012, Sol. Phys., 275, 17
- Liu et al. (2014) Liu, Z., Xu, J., Gu, B.-Z., et al. 2014, Research in Astronomy and Astrophysics, 14, 705-718
- Louis et al. (2015) Louis, R. E., Bellot Rubio, L. R., de la Cruz Rodríguez, J., Socas-Navarro, H., & Ortiz, A. 2015, A&A, 584, A1
- Pesnell et al. (2012) Pesnell, W. D., Thompson, B. J., & Chamberlin, P. C. 2012, Sol. Phys., 275, 3
- Robustini et al. (2016) Robustini, C., Leenaarts, J., de la Cruz Rodriguez, J., & Rouppe van der Voort, L. 2016, A&A, 590, A57
- Rueedi et al. (1995) Rueedi, I., Solanki, S. K., & Livingston, W. 1995, A&A, 302, 543
- Scherrer et al. (2012) Scherrer, P. H., Schou, J., Bush, R. I., et al. 2012, Sol. Phys., 275, 207
- Shimizu et al. (2009) Shimizu, T., Katsukawa, Y., Kubo, M., et al. 2009, ApJ, 696, L66
- Sobotka et al. (1993) Sobotka, M., Bonet, J. A., & Vazquez, M. 1993, ApJ, 415, 832
- Sobotka et al. (2013) Sobotka, M., Švanda, M., Jurčák, J., et al. 2013, A&A, 560, A84
- Song et al. (2017) Song, D., Chae, J., Yurchyshyn, V., et al. 2017, ApJ, 835, 240
- Tian et al. (2014) Tian, H., Kleint, L., Peter, H., et al. 2014, ApJ, 790, L29
- Toriumi et al. (2015) Toriumi, S., Katsukawa, Y., & Cheung, M. C. M. 2015a, ApJ, 811, 137
- Toriumi et al. (2015) Toriumi, S., Cheung, M. C. M., & Katsukawa, Y. 2015b, ApJ, 811, 138
- Yang et al. (2015) Yang, S. H., Zhang, J., Jiang, F. Y., & Xiang, Y. Y. 2015, ApJ, 804, L27
- Yang et al. (2016) Yang, S. H., Zhang, J., & Erdélyi, R. 2016, ApJ, 833, L18
- Yuan & Walsh (2016) Yuan, D., & Walsh, R. W. 2016, A&A, 594, A101
- Zhang et al. (2017) Zhang, J. W., Tian, H., He, J. S., & Wang, L. H. 2017, ApJ, 838, 2