Detection of Buckminsterfullerene emission in the diffuse interstellar medium
Emission of fullerenes in their infrared vibrational bands has been detected in space near hot stars. The proposed attribution of the diffuse interstellar bands at 9577 and 9632 Å to electronic transitions of the buckminsterfullerene cation (i.e. C ) was recently supported by new laboratory data, confirming the presence of this species in the diffuse interstellar medium (ISM). In this letter, we present the detection, also in the diffuse ISM, of the 17.4 and 18.9 m emission bands commonly attributed to vibrational bands of neutral C60 . According to classical models that compute the charge state of large molecules in space, C60 is expected to be mostly neutral in the diffuse ISM. This is in agreement with the abundances of diffuse C60 we derive here from observations.
Key Words.:
infrared : ISM, ISM: molecules, ISM : lines and bands1 Introduction
Fullerenes are cage-like macromolecules made of carbon. The most emblematic member of this family, C60 , i.e. Buckminsterfullerene, was serendipitously discovered by Kroto et al. (1985) during experiments aimed at simulating carbon chemistry in the atmospheres of evolved stars. Fullerenes have been extensively studied in the field of chemistry because of their unique properties and potential applications for nanotechnologies. Soon after the discovery of these macromolecules, it was recognized that fullerenes could be present in space and constitute a family of species relevant to astrochemistry (Kroto et al., 1985; Kroto & Jura, 1992). In particular, it was postulated that their electronic transitions could be at the origin of some of the numerous unidentified absorption bands observed towards reddened stars, the so-called diffuse interstellar bands (DIBs). Foing & Ehrenfreund (1994) proposed that two DIBs at 9577 and 9632 Å could be due to the C60 cation, C , but this proposal could not be confirmed at that time because of the lack of gas-phase laboratory spectroscopy. Clear evidence for the presence of fullerenes (C60 , C , C70) in space was provided recently with the detection of infrared (IR) emission bands of fullerenes in regions with intense UV radiation such as evolved stars (e.g. Cami et al. 2010; García-Hernández et al. 2010) and star-forming regions (Sellgren et al., 2010; Roberts et al., 2012; Berné et al., 2013; Castellanos et al., 2014). In parallel, new gas-phase laboratory experiments (Campbell et al., 2015) provided an accurate wavelength determination of the electronic transitions of C , which were found to be in excellent agreement with observations, therefore supporting the hypothesis that the 9577 and 9632 Å DIBs are due to the presence of C in the diffuse interstellar medium (ISM). If fullerenes are present in the diffuse ISM, they should absorb ultraviolet (UV) photons and re-emit their energy in the IR, hence their IR vibrational bands should be observed. Unfortunately, in the diffuse ISM, the exciting UV radiation field is orders of magnitude smaller compared to star-forming regions, resulting in extremely weak IR fluorescence. For this reason fullerene emission has not been detected there so far, precluding an independent confirmation of their presence in this environment.
| Chamaeleon | Scutum | Refs. | |
| Coord. (Gal. / deg.) | +300.13,-16.49 | 26.47 , -0.3– +1.0 | (1),(2) |
| UV field ∗ | 0.7-3 | 1-10 | (1), (3) |
| (H cm-2) | 2.7-5.6 | (1), (3) | |
| AV∗∗ (mag) | 1.4-3.0 | 30.5 | - |
| Comment | Single translucent cloud | Multiple clouds | - |
| ∗ corresponds to a UV field of W m-2 sr-1. | |||
| ∗∗Computed using for Scutum (value for the diffuse ISM) | |||
| and for the Chamaelon (value for translucent/dense ISM). | |||
| (1) : Ingalls et al. (2011); (2) : this work; (3) : Falgarone et al. (2005) | |||
2 Observations
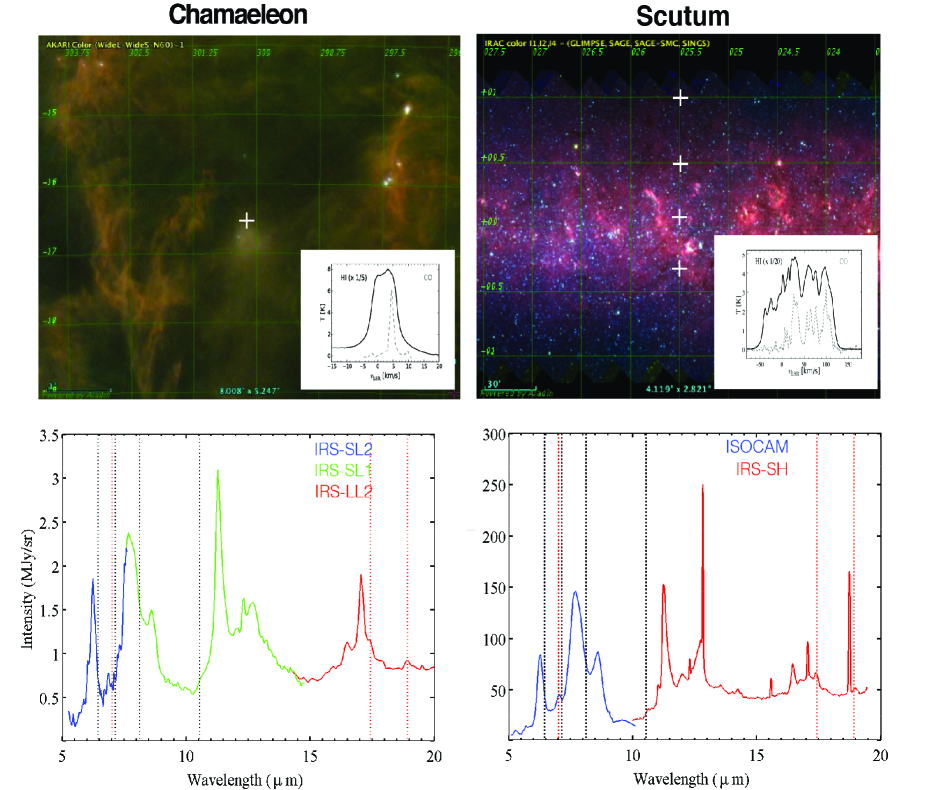
We retrieved archival IR spectra obtained with the InfraRed Spectrograph (IRS; Houck et al. 2004) on board Spitzer (Werner et al., 2004a) towards two lines of sight. To complement this data, we used the ISOCAM (Cesarsky et al., 1996) data, which was published in Flagey et al. (2006). An overview of the studied regions and data are presented in Fig. 1.
The first line of sight (Fig. 1, left column, Chamaeleon), corresponds to a translucent cloud that is situated on the frontside of the Chamaeleon complex at a distance of 70 pc (Mizuno et al., 2001). As can be seen from the HI and CO spectra (Fig. 1), this is a single cloud. The physical conditions for this cloud have been derived by Ingalls et al. (2011) based on the study of the molecular hydrogen emission: the hydrogen density is 30-100 particles cm-3 and the ultraviolet (UV) radiation field there is in the range of (with corresponding to W m-2 sr-1, the interstellar standard radiation field calculated by Habing 1968). The data for this line of sight consists of low resolution spectroscopy () covering the 5-35 m range and published in Ingalls et al. (2011) who focused on H2 emission. The second line of sight (Fig. 1, right column, Scutum) corresponds to a diffuse Galactic region, free of star formation, situated close to the Scutum. As can be seen in the HI and CO spectra presented in Fig. 1, this line of sight probes several clouds, where hydrogen can be in molecular, atomic, or ionized form. Falgarone et al. (2005) studied this region of the Galaxy in detail using ISO spectroscopy and were able to decompose the line of sight into several density components. The radiation field on this line of sight varies between and (Falgarone et al., 2005). The Spitzer spectroscopic data for this line of sight was not previously published; it consists of medium resolution spectroscopy () covering the 9-20 m range. For both lines of sight, we reduced the data starting from the basic calibrated data and carefully subtracting background emission (see Appendix A). The extracted mid-IR spectra over the full spectral range for the two lines of sight are presented in Fig. 1.
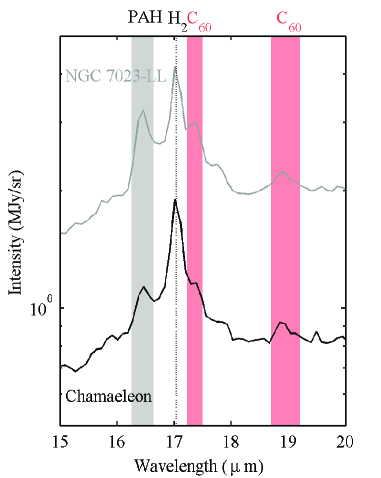
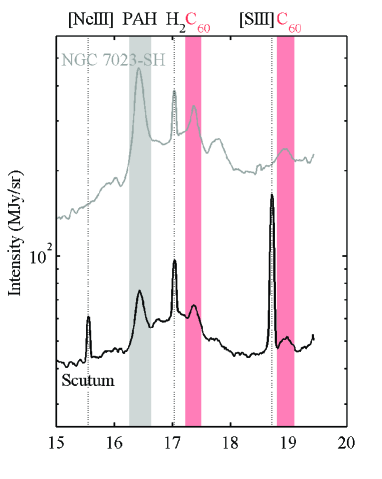
In Fig. 2, the same spectra are shown over a smaller spectral range that is of interest when searching for the emission of C60 . For comparison, the spectra of the NGC 7023 massive star-forming region are shown, where C60 was detected by Sellgren et al. (2010) and where the UV radiation field is much higher, i.e. . The diffuse and translucent cloud spectra show a number of broad features, which are commonly attributed to the emission of large carbonaceous molecules i.e. polycyclic aromatic hydrocarbons (PAH; Tielens 2008). The ratio between the 11.2 and 7.7 m PAH bands observed in both lines of sight is compatible with PAHs being mostly neutral (Pilleri et al., 2012). The molecular hydrogen lines at 17.0 m and 12.3 m are also observed towards both lines of sight. In addition, ionic lines from the warm ionized medium are detected towards the Scutum line of sight. The two most intense bands of C60 , situated at 17.4 and 18.9 m, are clearly detected in both lines of sight (Fig. 2).111The 17.4 m can be contaminated by emission from polycyclic aromatic hydrocarbons. The vibrational spectrum of C60 is characterized by two additional weaker bands at 7.0 and 8.5 m, which are not detected. However this non-detection is consistent with the noise level that exceeds the expected intensity for these bands. The 18.9 m band is detected at a level that is 3.2 and 12.2 times above the root mean square noise, for the Chameleon cloud and for the Scutum line of sight, respectively. The strongest bands of C (at 6.4 and 7.1 m, Berné et al. 2013) are not detected. C also has an emission band close to 18.9 m, which could correspond to the emission band detected the spectra in Fig. 2, but we show in Appendix F that C cannot contribute more than 25% to the observed band.
3 Abundances of C60
Using the integrated intensity of the 18.9 m band of C60 and information reported in Table 1, it is possible to estimate an abundance for C60 in both lines of sight (see Appendix B). The values found are of the order of a few to a few 10-3 of the gas-phase carbon locked in C60 (Table 2). This can be compared to the abundances of C for the diffuse ISM derived from DIB measurements. Using the recent laboratory measurements for the oscillator strength of C electronic transitions (Campbell et al., 2016), we derived the abundance of C towards lines of sight where the 9577 Å DIB has been detected (Appendix C). These abundances are in the range of 0.6-1.1 of the carbon (Table 3), i.e. comparable to what is found for C60 in this study; they are also in agreement with the upper limit for the abundance of C we derived from the non-detection of the infrared bands of this species of 1.8 of the carbon (See Appendix D). Abundances for C60 in the diffuse ISM, star-forming regions and evolved stars are summarized in Table 2. Fullerenes are most abundant in carbon-rich evolved stars, roughly an order of magnitude less abundant in the diffuse ISM, and two orders of magnitude less abundant in star forming regions. It should however be noted that C60 is detected towards only 3% of the evolved stars observed with Spitzer (Otsuka et al., 2014). Overall, the relatively large abundance of C60 in the diffuse ISM may therefore reflect the long-term processing of carbonaceous material by UV photons of massive stars, which can lead to the formation of fullerenes (Berné & Tielens, 2012; Berné et al., 2015).
| Emission | Absorption | |
| Star-forming regions | ||
| C | 0.01∗ | - |
| C60 | - | |
| Diffuse ISM | ||
| C | 0.2 ⋆† | 0.06-0.1 ⋆ |
| C60 | 0.03-0.4 ⋆ | - |
| Evolved stars | ||
| C | - | 1.2 ⋆⋆ |
| C60 | 0.1-3.0 ⋆⋆⋆ | - |
| ∗ From Berné et al. (2013); ∗∗ From Castellanos et al. (2014); | ||
| ⋆ This work, see Appendices B, C and D; † Upper limit; | ||
| ⋆⋆ From Cami et al. (2011) and references therein | ||
| ⋆⋆⋆ From Iglesias-Groth & Esposito (2013), for one source only | ||
According to classical theoretical models for the charge state of large molecules in space, C60 should be mostly neutral for standard physical conditions of the diffuse ISM. Bakes & Tielens (1995) computed the charge distribution for the specific case of C60 in the diffuse ISM and find that is anionic, is neutral, and is cationic. These numbers are compatible with the absolute abundances summarized in Table 2, which point to a (not very restrictive) C60 over C ratio ranging between 0.3 to 6. C is expected to be abundant in models and hence could be searched for in space. The strongest vibrational bands of C are around 17.5 and 7.3 m (Kupser et al., 2008). The 17.5 m band is difficult to identify because of the presence of PAH emission at 17.4 m. A band at 7.3 m seems present in the spectrum of the Chamaeleon line of sight, however this region of the spectrum is quite noisy and higher sensitivity data will be required to confirm this. Observations of diffuse lines of sight with the James Webb Space Telescope, which has the sensitivity to detect C60 and C as well as tracers of the diffuse ISM should allow us to conduct more detailed studies on the charge balance of C60 in the diffuse ISM. Laboratory studies to quantify key molecular parameters involved, such as the electron recombination rate of C , are also required.
Finally, the detection of C60 IR emission bands in the diffuse ISM suggests that the electronic transitions of this molecules could be identified in absorption. However, given their low oscillator strengths, this will be challenging as we illustrate in Appendix E.
4 Conclusion
In the past few years, our understanding of the organic inventory in space has greatly benefited from studies of the infrared emission of the Galaxy, in particular with the first identifications of fullerenes. Meanwhile, the field of diffuse interstellar bands has been reinvigorated by the convincing assignment of the 9577 and 9632 Å DIBs to the electronic transitions of C . The detection of C IR emission in the diffuse ISM, with the same abundance as those derived from studies in absorption, would provide a strong independent confirmation of the DIB assignment. It is also likely that astronomical observations combining vibrational and electronic spectroscopy through the detection of emission and absorption bands, with the support of laboratory and theoretical investigations, can help identify new species and cast a new light on the DIB conundrum and the organic inventory in space. The detailed spectroscopy of C60 and C , which are isolated in the diffuse ISM, can also offer the possibility to study some of the fundamental molecular properties of these species in synergy with laboratory and theoretical investigations.
Acknowledgements.
We thank F. Boulanger and E. Falgarone for their thoughtful comments, especially regarding the properties of the studied lines of sight. We thank Alain Omont, for his detailed comments and for identifying a mistake regarding derivation of abundances. We thank the anonymous referee whose comments helped improve the manuscript. This work was supported by the French programme Physique et Chimie du Milieu Interstellaire (PCMI) funded by the Conseil National de la Recherche Scientifique (CNRS) and Centre National d Etudes Spatiales (CNES). The research leading to these results has also received funding from the European Research Council under the European Union’s Seventh Framework Programme (FP/2007-2013) ERC-2013-SyG, Grant Agreement n. 610256 NANOCOSMOS.References
- Bakes & Tielens (1995) Bakes, E. & Tielens, A. 1995, in Astrophysics and Space Science Library, Vol. 202, The Diffuse Interstellar Bands, ed. A. G. G. M. Tielens & T. P. Snow, 315
- Berné et al. (2015) Berné, O., Montillaud, J., & Joblin, C. 2015, Astronomy & Astrophysics, 577, A133
- Berné et al. (2013) Berné, O., Mulas, G., & Joblin, C. 2013, Astronomy & Astrophysics, 550, L4
- Berné & Tielens (2012) Berné, O. & Tielens, A. G. G. M. 2012, Proceedings of the National Academy of Science, 109, 401
- Boulanger et al. (1998) Boulanger, F., Bronfman, L., Dame, T. M., & Thaddeus, P. 1998, Astronomy and Astrophysics, 332, 273
- Cami et al. (2010) Cami, J., Bernard-Salas, J., Peeters, E., & Malek, S. E. 2010, Science, 329, 1180
- Cami et al. (2011) Cami, J., Bernard-Salas, J., Peeters, E., & Malek, S. E. 2011, in IAU Symposium, Vol. 280, The Molecular Universe, ed. J. Cernicharo & R. Bachiller, 216–227
- Campbell et al. (2015) Campbell, E. K., Holz, M., Gerlich, D., & Maier, J. P. 2015, Nature, 523, 322
- Campbell et al. (2016) Campbell, E. K., Holz, M., Maier, J. P., et al. 2016, Astrophysical Journal, 822, 17
- Castellanos et al. (2014) Castellanos, P., Berné, O., Sheffer, Y., Wolfire, M. G., & Tielens, A. G. G. M. 2014, Astrophysical Journal, 794, 83
- Cesarsky et al. (1996) Cesarsky, C. J., Abergel, A., Agnese, P., et al. 1996, A&A, 315, L32
- Cox et al. (2014) Cox, N. L. J., Cami, J., Kaper, L., et al. 2014, Astronomy & Astrophysics, 569, A117
- Dame et al. (2001) Dame, T. M., Hartmann, D., & Thaddeus, P. 2001, Astrophysical Journal, 547, 792
- Diplas & Savage (1994) Diplas, A. & Savage, B. D. 1994, Astrophysical Journal Supplement Series, 93, 211
- Falgarone et al. (2005) Falgarone, E., Verstraete, L., Pineau Des Forêts, G., & Hily-Blant, P. 2005, Astronomy & Astrophysics, 433, 997
- Fazio et al. (2004) Fazio, G. G., Hora, J. L., Allen, L. E., et al. 2004, Astrophysical Journal Supplement Series, 154, 10
- Flagey et al. (2006) Flagey, N., Boulanger, F., Verstraete, L., et al. 2006, Astronomy & Astrophysics, 453, 969
- Foing & Ehrenfreund (1994) Foing, B. H. & Ehrenfreund, P. 1994, Nature, 369, 296
- García-Hernández et al. (2010) García-Hernández, D. A., Manchado, A., García-Lario, P., et al. 2010, Astrophysical Journal Letters, 724, L39
- Habing (1968) Habing, H. J. 1968, Bulletin of the Astronomical Institutes of the Netherlands, 19, 421
- Herbig (2000) Herbig, G. H. 2000, Astrophysical Journal, 542, 334
- Houck et al. (2004) Houck, J. R., Roellig, T. L., van Cleve, J., et al. 2004, Astrophysical Journal Supplement Series, 154, 18
- Iglesias-Groth & Esposito (2013) Iglesias-Groth, S. & Esposito, M. 2013, ApJ, 776, L2
- Ingalls et al. (2011) Ingalls, J. G., Bania, T. M., Boulanger, F., et al. 2011, Astrophysical Journal, 743, 174
- Kroto et al. (1985) Kroto, H. W., Heath, J. R., Obrien, S. C., Curl, R. F., & Smalley, R. E. 1985, Nature, 318, 162
- Kroto & Jura (1992) Kroto, H. W. & Jura, M. 1992, Astronomy & Astrophysics, 263, 275
- Kupser et al. (2008) Kupser, P., Steill, J. D., Oomens, J., Meijer, G., & von Helden, G. 2008, Phys. Chem. Chem. Phys., 10, 6862
- McClure-Griffiths et al. (2009) McClure-Griffiths, N. M., Pisano, D. J., Calabretta, M. R., et al. 2009, Astrophysical Journal Supplement Series, 181, 398
- Menéndez & Page (2000) Menéndez, J. & Page, J. B. 2000, Vibrational spectroscopy of C60, ed. M. Cardona & G. Güntherodt (Berlin, Heidelberg: Springer Berlin Heidelberg), 27–95
- Mizuno et al. (2001) Mizuno, A., Yamaguchi, R., Tachihara, K., et al. 2001, Proceedings of the Astronomical Society of Japan, 53, 1071
- Omont (2016) Omont, A. 2016, A&A, 590, A52
- Otsuka et al. (2014) Otsuka, M., Kemper, F., Cami, J., Peeters, E., & Bernard-Salas, J. 2014, MNRAS, 437, 2577
- Pilleri et al. (2012) Pilleri, P., Montillaud, J., Berné, O., & Joblin, C. 2012, A&A, 542, A69
- Roberts et al. (2012) Roberts, K. R. G., Smith, K. T., & Sarre, P. J. 2012, MNRAS, 421, 3277
- Sassara et al. (2001) Sassara, A., Zerza, G., Chergui, M., & Leach, S. 2001, Astrophysical Journal, 135, 263
- Sellgren et al. (2010) Sellgren, K., Werner, M. W., Ingalls, J. G., et al. 2010, Astrophysical Journall, 722, L54
- Smith et al. (2007) Smith, J. D. T., Armus, L., Dale, D. A., et al. 2007, PASP, 119, 1133
- Sofia et al. (2004) Sofia, U. J., Lauroesch, J. T., Meyer, D. M., & Cartledge, S. I. B. 2004, Astrophysical Journal, 605, 272
- Strelnikov et al. (2015) Strelnikov, D., Kern, B., & Kappes, M. M. 2015, A&A, 584, A55
- Tielens (2008) Tielens, A. G. G. M. 2008, Annual Reviews of Astronomy and Astrophysics, 46, 289
- Walker et al. (2015) Walker, G. A. H., Bohlender, D. A., Maier, J. P., & Campbell, E. K. 2015, Astrophysical Journal Letters, 812, L8
- Werner et al. (2004a) Werner, M. W., Roellig, T. L., Low, F. J., et al. 2004a, Astrophysical Journal Supplement Series, 154, 1
- Werner et al. (2004b) Werner, M. W., Uchida, K. I., Sellgren, K., et al. 2004b, Astrophysical Journal Supplement Series, 154, 309
- Wilson & Merrill (1937) Wilson, O. C. & Merrill, P. W. 1937, Contributions from the Mount Wilson Observatory / Carnegie Institution of Washington, 570, 1
Appendix A Data analysis
The data was retrieved from the Spitzer science archive222http://sha.ipac.caltech.edu/applications/Spitzer/SHA/. We used the data at the basic calibrated level (bcd) for both lines of sight. The astronomical observation request (AOR) keys for these observations are, for the four positions of the Scutum line of sight (LoS): 11060992, 12544768, 11061504, 11061760, from the programme 3513 (PI E. Falgarone), and for the Chamaeleon LoS 28315392, from programme 491 (PI J. Ingalls). The off positions were included in this latter programme, and for the former observations, we used the offs performed the same day for extragalactic sources by another programme (programme 1420; PI L. Armus). The off subtraction, in both cases, was performed at the .bcd level, i.e. before building the 3D spectral cubes. The data reduction was achieved using the CUBISM software (Smith et al. 2007), including the slit loss correction function algorithm333http://tir.astro.utoledo.edu/jdsmith/code/cubism.php. Once the cubes were built, the spectra were obtained by averaging the spectral cubes over all the spatial positions to improve the signal to noise ratio.
The complementary data from NGC 7023 has been discussed extensively in the literature, it was first presented by Werner et al. (2004b). The positions we use to extract the reference spectra are rectangles whose vertices coordinates are given hereafter: for the low resolution spectrum (LL) used in the comparison with the translucent cloud spectrum (21:01:40.579, +68:10:42.96; 21:01:42.343, +68:10:54.6; 21:01:40.255, +68:11:04.44; 21:01:38.491,+68:10:52.80), and for the medium resolution spectrum (SH) used in the comparison with the diffuse ISM spectrum (21:01:24.800, +68:10:11.50; 21:01:32.368, +68:09:33.95; 21:01:40.448, +68:10:24.60; 21:01:32.880,+68:11:02.16). The LL spectrum was extracted in the north-west photodissociation region (PDR) of the nebula, where rotational emission is observed to be strong, i.e. at the surface of the molecular cloud. The high resolution spectrum was obtained by averaging the spectral cube over a region that covers the north-west PDR and the cavity of atomic gas situated close to the illuminating star HD 200775.
Appendix B Derivation of neutral C60 abundances from the infrared emission
The derivation of the C60 abundance performed here relies on the assumption that the energy absorbed by C60 in the UV is completely re-radiated in the IR bands. For moderate internal energies ( eV), such as those of C60 molecules excited by Far-UV photons in the ISM, the main relaxation channel is indeed IR emission (see Fig. 2 in Berné et al. 2015) and this assumption is valid. The total IR intensity in W m-2 sr-1 emitted by C60 molecules is hence,
| (1) |
where is the column density of C60 , is the UV absorption cross section of C60 which we take to be cm2 following Berné & Tielens (2012), and is the radiation field (see Table 1). Unfortunately, in our observations, the bands at shorter wavelengths (7.0 and 8.5 m) are not detected, and the 17.4 m band is contaminated by PAH emission, hence cannot be derived directly. Instead, it can be estimated using the 18.9 m band intensity (), assuming that , which is what is observed in NGC 7023 (Berné et al. 2013). This assumption is valid considering that the band ratios of the IR bands of C60 depend on the average energy of absorbed UV photons that are expected to be comparable in NGC 7023 and in the diffuse ISM, since both environments are dominated by the UV fields of young massive stars. Hence, one can solve Eq. 1 for , and derive the abundance of C60 relative to carbon as follows:
| (2) |
adopting a carbon-to-hydrogen fraction measured in the diffuse ISM, i.e. (Sofia et al. 2004), and the values for in Table 1. For the specific cases considered here, we derive and W m-2 sr-1 for the Chamaeleon and Scutum LoS respectively. Using Eqs. 1-2 and the values in Table 1 (including uncertainties on the hydrogen column density and radiation field) yields abundances of C60 of and of the gas-phase carbon locked in C60 , for the Chamaeleon and Scutum LoS, respectively.
Appendix C C abundances in the diffuse interstellar medium
The fraction of carbon locked in C relative to gas-phase carbon is given by
| (3) |
adopting a carbon-to-hydrogen fraction measured in the diffuse ISM, . Values of the column density of C , , were derived in previous works along several diffuse ISM LoS along which the two DIBs at 9577 and 9632 were observed. In Table C.1, we report the values for three well-studied LoS and derived abundances for C using the equation above. The derived values are of the order of a few of the gas-phase carbon. Omont (2016) find an average value of the fraction of carbon contained in C (with respect to the total carbon abundance, including dust) , equivalent to of the gas phase carbon, in agreement with our results.
| Line of sight | N(C)∗ | Ref. for 9577 DIB EW | N(H)∗∗ | C abundance |
| HD169454 | Walker et al. (2015) | |||
| HD183143 | Walker et al. (2015) | |||
| 4U1907+09 | Cox et al. (2014) | |||
| ∗ Column density computed from the measured equivalent width | ||||
| via the measured cross sections given by Campbell et al. (2016) | ||||
| ∗∗ Hydrogen column density, N(H) = N(Hi + 2 N(H2), from direct measurements | ||||
| (HD169454: Diplas & Savage 1994) or visual extinction, (other sightlines; see text for details). | ||||
Appendix D C infrared emission upper limit
It is possible to derive a limit for the abundance of C based on the infrared spectra of the Chamaeleon and Scutum LoS using the same approach as for C60 (see appendix B). The 7.1 m band of C is the easiest to detect (Berné et al. 2013), however it is absent in both lines of sight (Fig. 1). Based on these non-detections, we can place an upper limit on , which we can convert into an for C using the band ratio observed in NGC 7023 (Berné et al. 2013). We derive an upper limit for the C column density, which we convert into an abundance using Eq. 2. Using the equation of energy budget (Eq. 1) and assuming a similar value of the UV absorption cross section for C60 and C , we can derive an upper limit for the C column density, which we convert into an abundance using Eq. C.1. This yields an upper limit for the C abundance of of the elemental carbon abundance in the Chamaeleon line of sight and of the carbon for the Scutum line of sight. Both limits are above the measurements of C abundance resulting from the detection of the electronic transitions (Table 3).
Appendix E Prediction of neutral C60 DIB strength
The detection of the IR emission of neutral C60 in the diffuse ISM with abundances comparable to C suggests that this molecule could be a DIB carrier. Using the abundances derived in this paper and relevant data for the positions, strength, and widths of the electronic transitions of C60 (Sassara et al. 2001, Table E1), it is possible to compute the predicted depth of the electronic transitions of neutral C60. Truly accurate positions, oscillator strengths, and band widths have not yet been determined for the electronic absorption bands of neutral C60 in the gas phase at low temperatures, which could therefore be shifted by several Å with respect to these recommended values. We use the following relation between column density, N, and equivalent width, EW in Å (Wilson & Merrill 1937):
| (4) |
where is the band position (in Å) and its oscillator strength (cf. Table 4).
For a Gaussian profile the central depth, , of the line centre relative to the local continuum, is given as
| (5) |
| (Å) | FWHM (Å) | |
|---|---|---|
| 3980 | 0.007 | 5.5 |
| 4024 | 0.005 | 4.0 |
For the diffuse Scutum LoS, the column density derived from infrared emission is (C60) = cm-2 for a sightline with total visual extinction, , of 30.5 magnitudes. For the Chamaeleon LoS, with = 1–2 mag, we have (C60) = cm-2. We can thus infer (C60) 1 cm-2/ from both sightlines. Using Eq. 4 and 5, this yields central depths of 0.1% per unit visual extinction. These low values are inherent to the rather low oscillator strengths of the C60 electronic transitions and suggest that C60 is unlikely to be responsible for strong DIBs, which can be several percent of the continuum (Herbig 2000). However, weak DIBs, which can be detected thanks to highly sensitive spectroscopy, could well be attributed to C60 with the help of new gas-phase laboratory spectroscopy to provide accurate positions, width, and strengths for the electronic transitions. For instance, on the Scutum LoS, the predicted equivalent width for the C60 DIBs with the number quoted above is of the order of 200 provided one can find a proper background star.
Appendix F Possible contribution of C to the 18.9 m band
C is known to have an infrared vibrational band at a wavelength close to the strongest band of C60 , i.e. at m (see theoretical calculations in Berné et al. 2013 and experimental data in Strelnikov et al. 2015). Based on the upper limits for the 7.1 m band (Fig. 1), it is possible to derive an estimate of the maximum contribution of C to the 18.9 m band (Fig. 2). A proper analysis would require a detailed emission model, including a description of the UV field, absorption, excitation, and cooling of the molecules. Here we consider a simplified model. From the observed ratio between the 7.0 and 18.9 m bands of C60 in NGC 7023 (Sellgren et al. 2010), we can derive a mean colour temperature TC such that
| (6) |
where is the Planck function and is the infrared cross section of the molecule. Applying a similar reasoning for C and assuming the same colour temperature for both C60 and C , the ratio between the 7.1 and 18.9 m features reads
| (7) |
Using the IR cross sections for C60 and C of Menéndez & Page (2000) and Strelnikov et al. (2015), respectively, yields a theoretical value of . The upper limits for the 7.1 m band in the Chamaeleon and Scutum LoS are and W m-2 sr-1, respectively. This results in a maximum contribution of C to the 18.9 m band of and W m-2 sr-1, respectively. This is to be compared to the observed emissions of the 18.9 m band of and W m-2 sr-1. Hence, the contribution of C to the 18.9 m band is at most 25 and 10% in the Chamaeleon and Scutum LoS, respectively. In any case, the major contributor to the 18.9 m band is C60 .