Detection of X-ray spectral state transitions in mini-outbursts of black hole transient GRS 1739278
Abstract
We report the detection of the state transitions and hysteresis effect in the two mini-outbursts of the black hole (BH) transient GRS 1739278 following its 2014 major outburst. The X-ray spectral evolutions in these two mini-outbursts are similar to the major outburst, in spite of their peak luminosities and the outburst durations are one order of magnitude lower. We found the and the of the mini-outbursts also follow the correlation previous found in other X-ray binaries. The of the mini-outbursts is still higher than that of the persistent BH binary Cyg X-1, which supports that there is a link between the maximum luminosity a source can reach in the hard state and the corresponding non-stationary accretion represented by substantial rate-of-change in the mass accretion rate during flares/outbursts. The detected luminosity range of these two mini-outbursts is roughly in 3.5– 0.015 ( kpc)2() . The X-ray spectra of other BH transients at such low luminosities are usually dominated by a power-law component, and an anti-correlation is observed between the photon index and the X-ray luminosity below 1% . So the detection of X-ray spectral state transitions indicates that the accretion flow evolution in these two mini-outbursts of GRS 1739278 are different from other BH systems at such low-luminosity regime.
keywords:
accretion, accretion disks — stars:black holes —X-rays:binaries — X-rays: individual:GRS 17392781 Introduction
Most known stellar-mass black holes (BHs) in our Galaxy are harbored in low mass X-ray binary transients (LMXBTs), which are also called BH transients. After a long quiescent period they occasionally undergo an outburst, which is triggered by the disk instability (see reviews in Lasota, 2001). For most bright outbursts, the luminosity can change by several orders of magnitude, and following a certain pattern the X-ray spectrum evolves distinctively between different states (see Remillard & McClintock, 2006; Belloni, 2010; Zhang, 2013, for reviews). During the initial rise phase of the outburst, the source is in the hard X-ray state, in which the X-ray spectrum is dominated by a power-law component with a photon index . In this state, the X-ray emission is believed to be from a hot accretion flow (see review in Yuan & Narayan, 2014). During the peak or the initial decay phase of the outburst, on the other hand, the source is in the soft state where the X-ray spectrum is dominated by a multi-temperature blackbody component, emitted by the standard cold accretion disk (Shakura & Sunyaev, 1973). The source will return to the hard state during the late decay phase of the outburst. In other words, the source experiences a hard-to-soft state transition during the rise phase of the outburst and a soft-to-hard state transition during the decay phase. The standard model for the state transition is that, there exists a critical mass accretion rate for the hot accretion flow (responsible for the hard state), i.e. when the mass accretion rate is above/under that criteria, the source will leave/return the hard state (Esin et al., 1997). However, the hard-to-soft state transition is usually observed at a higher luminosity compared to that of the soft-to-hard state transition, i.e. , and it is usually called a hysteresis effect (Miyamoto et al., 1995; Maccarone & Coppi, 2003). One powerful tool to track the flux and spectral evolution during the outburst is through the hardness-intensity diagram (HID, Belloni 2010), which plots the X-ray count rate as a function of count rate ratio between two X-ray energy bands. The state transition as well as the hysteresis effect is clearly demonstrated in the HID diagram, where the outburst with state transitions follows a ‘q’-track (Belloni, 2010). Interestingly, it has been found observationally that the correlates with the peak luminosity of the following soft state in individual sources (Yu et al., 2004; Yu et al., 2007; Yu & Dolence, 2007) as well as in a sample of X-ray binaries (Yu & Yan, 2009; Tang et al., 2011). These results indicate that the well-known hysteresis effect in state transition is primarily because, the variation of the is tightly connected to the non-stationary property of accretion, which is mainly characterized by the rate-of-change of the mass accretion rate (Yu & Yan, 2009).
The typical morphology of the X-ray light curve of an outburst of BH transient is a fast-rise-exponential-decay(FRED) form. Although, many outbursts show a secondary maxima in their light curves. Chen et al. (1997) classified three morphological types of the secondary maxima: glitches, bumps, and mini-outbursts. A glitch is a peak superposed on the exponential decay, which is quite common in BH transients (Tanaka & Shibazaki, 1996; Chen et al., 1997). The bump and mini-outburst are much shorter in duration and lower in amplitude than a major outburst, and are usually superposed at the end of the decay phase. The mini-outbursts usually occur when the source is close to the quiescence. These features have been observed in several BH transients, e.g., A0620, GRO J042232, XTE J1650500, XTE J1752 and MAXI J1659 (Kuulkers, 1998; Callanan et al., 1995; Shrader et al., 1997; Tomsick et al., 2004; Russell et al., 2012; Jonker et al., 2012; Homan et al., 2013), and also in several neutron star (NS) LMXBTs, e.g., SAX J1808.43658 and XTE J1701407 (Patruno et al., 2009; Patruno et al., 2016; Degenaar et al., 2011). Interestingly, similar mini-outbursts features have also been observed in WZ Sge type dwarf novae (DN, Kuulkers et al., 1996; Kuulkers, 2000; Kato et al., 2004). The mechanism of mini-outburst is still a puzzle to astrophysicists. Similar mini-outbursts phenomenon in different accreting systems suggest that they probably relate to the accretion process rather than the central compact object. It is very challenging to explain the mini-outburst under the framework of disk instability model (Dubus et al., 2001; Lasota, 2001). Other models have been invoked, such as the irradiation on the companion (Hameury et al., 2000) and the enhanced viscosity (Osaki et al., 2001; Meyer & Meyer-Hofmeister, 2015). Although these models are designed to interpret the mini-outbursts of DN, it may be applied to X-ray binaries in general.
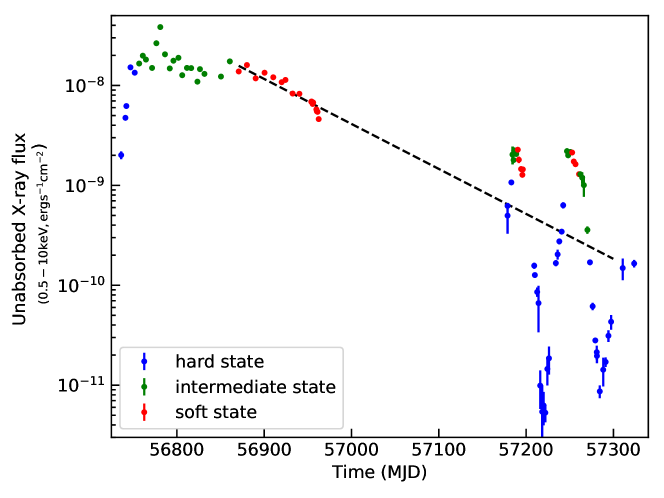
GRS 1739278 was discovered by the SIGMA gamma-ray telescope on board the Granat satellite (Paul et al., 1996; Vargas et al., 1997) during its 1996 outburst. Later on, GRS 1739 was identified as a BH candidate according to its X-ray spectral and timing properties (Borozdin et al., 1998; Borozdin & Trudolyubov, 2000; Wijnands et al., 2001). In 2014, the source underwent an outburst followed by at least two mini-outbursts. Here we report on the discovery of X-ray spectral state transitions and hysteresis effect in the two mini-outbursts (see Figure 3).
2 Observations, Data Analysis and Results
2.1 /XRT observations and data reduction
This new outburst of GRS 1739278 was firstly detected by the Burst Alert Telescope (BAT) onboard on 2014 March 9 (MJD 56725, Krimm et al., 2014). The monitoring started on 2014 March 20 (MJD 56736), but was interrupted since MJD 56962 due to Sun constraints. renewed its monitoring of this source about 200 days later, and it is found to remain active. Two mini-outbursts with lower peak luminosities and short durations were detected.
The /XRT event data were firstly processed with XRTPIPELINE (v 0.13.2) to generate the cleaned event data. We then used XSELECT to extract only grade 0 events. Since GRS 1739278 is near the Galactic center with very high column density, higher grade events are omitted in order to avoid possible calibration issue for the heavily absorbed sources 111http://www.swift.ac.uk/analysis/xrt/digest_cal.php#abs. For the observations with high count rate ( 0.6 c/s for the photon counting (PC) mode and 150 c/s for the windowed timing (WT) mode), we excluded the events in the central region that suffers the pile-up effect (Evans et al., 2009).
2.2 XRT spectral analysis during the major outburst
We used XSPEC 12.9.0 (Arnaud, 1996) for the XRT spectral fitting. The first three observations were fitted well with a single power-law component whose photon index 1.4 (see also Filippova et al., 2014; Miller et al., 2015). Then the photon index increased to 2.0 after MJD 56742. For the data after MJD 56752, an additional disk component was required to fit the XRT spectra. The photon indices were not constrained well in few observations since the power-law component was weak in the energy range of /XRT. For simplicity, the photon indices in those observations were fixed to 2.4, a typical value for the intermediate state or steep power-law state (Remillard & McClintock, 2006; Belloni, 2010). The XRT spectra after MJD 56860 during the major outburst were all well-fitted by a single disk component, and the X-ray flux and the temperature of the inner disk gradually decreased.
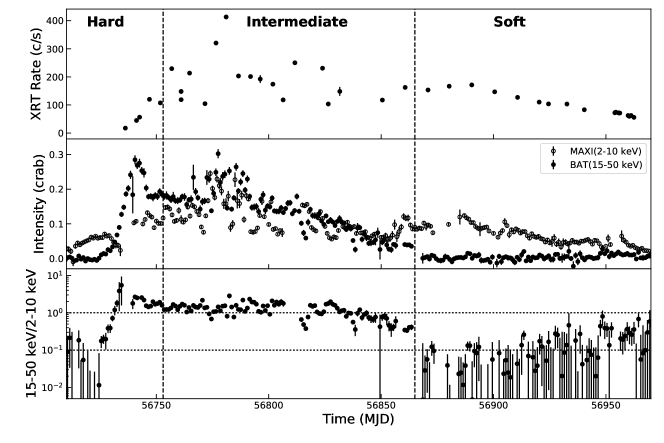
Figure 1 shows the light curves of the major outburst of GRS 1739278 obtained from /XRT (0.3–10 keV; Evans et al., 2009), MAXI (2–10 keV; Matsuoka et al., 2009) and /BAT(15-50 keV; Krimm et al., 2013). The spectral states intervals are defined according to Remillard & McClintock (2006); Belloni (2010), i.e., the hard state spectrum is characterized by a single power-law with photon index less than 2.1, the soft state spectrum is characterized by a single disk component and the in-between spectra are in the intermediate state (see Figure 1). We also plotted the hardness ratio between the count rates of BAT (15–50 keV) and MAXI (2–10 keV) in Figure 1. The hardness ratio roughly dropped by a factor of 10 after MJD 56860, mainly because this source entered into a soft state and the hard X-ray intensity by BAT dropped significantly.
2.3 XRT spectral analysis during the mini-outbursts
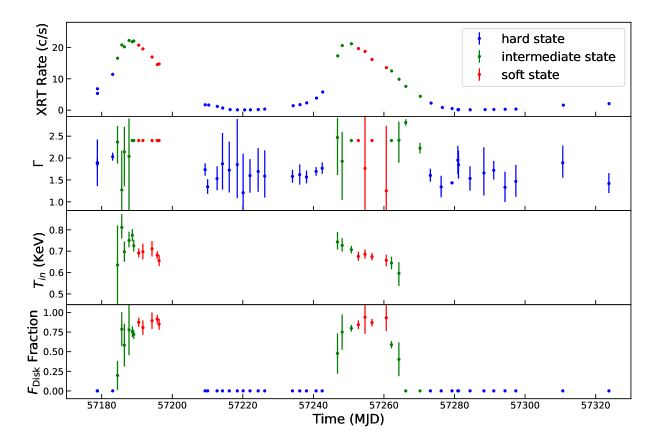
The best-fitting parameters of the XRT spectra of GRS 1739 during the two mini-outbursts are shown in Figure 2. The first observation of the mini-outbursts was performed on MJD 57178, which is about 200 days after the last observation of major outburst. The first few spectra were well fitted by a power-law component. The photon index increased from 1.8 to 2.1. Then an additional strong disk component was required for the spectral fitting. In some observations, the power-law component was too weak to constrain, and we for simplicity fixed the photon index to 2.4, following spectral modeling experience of the major outburst. Right after the peak of mini-outbursts, the flux from the disk component could contribute to more than 80% of the total flux in the 0.5–10 keV (see Figure 2). A single disk component also provided an acceptable fitting for those spectra, but above 6 keV there were still a weak excess, which can be fitted by a power-law component. The -test showed that an additional power-law component improved the spectral fitting at 2–8 significance level, depending on different observations. During the decay of the mini-outbursts, the X-ray spectra hardened with decreasing flux. The photon index dropped to 1.4–1.5 at the lowest flux level (see also Fürst et al., 2016), similar to the initial hard state of the major outburst (see also Filippova et al., 2014; Miller et al., 2015).
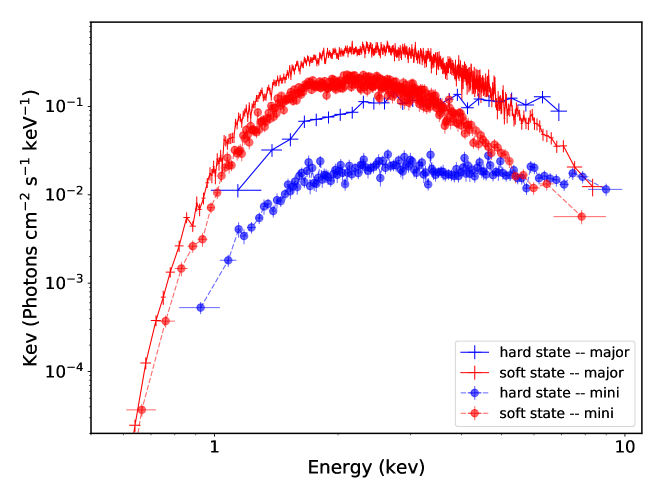
We defined the hard state in the mini-outbursts as the spectra characterized by a single power-law component with photon index less than 2.1, the soft state as the flux contribution from disk component being larger than 80% and the in-between spectra are in the intermediate state (see Figure 2). Although their duration and peak luminosity are one oder of magnitude smaller (Figure 3), the two mini-outbursts follow a similar X-ray spectral evolution track to the major outburst and bright outbursts in other BH transients (see Section 1 and the references therein). As shown in the Figure 3, the two mini-outbursts started in the hard state during the rise and made a transition to the soft state after the peak, then returned to the hard state during the decay. We further directly compared the X-ray spectra between major outburst and mini-outbursts (Figure 4). We found that spectra of the hard/soft states in mini-outbursts are almost the same (in spectral shape) as those of the major outburst, except that the inner disk temperature of the soft state in the major outburst is higher than that in the mini-outbursts. Such similarity supports that there are indeed distinct X-ray spectral states and state transitions during the mini-outbursts as well as during the major outburst.
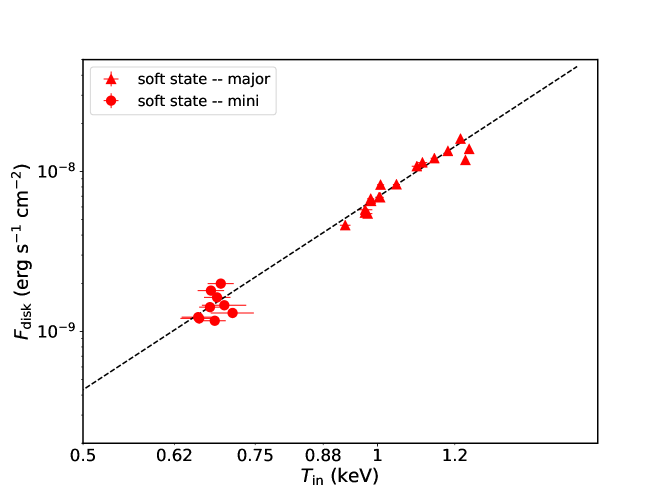
We then investigated the relationship between the the disk flux and the inner disk temperature during the soft state of mini-outbursts and the major outburst. A simple power-law fitting between and of the soft state in the major outburst indicates that , which is consistent with the expectation of emission from a geometrically thin, optically thick accretion disk with a constant inner radius (Gierliński & Done, 2004; Dunn et al., 2011). Besides, the inner disk temperature in the major outburst is typical among other BH transients in their soft states (1 keV; Dunn et al., 2011; Reynolds & Miller, 2013). Further, we found that the soft state of the two mini-outbursts roughly follow the extrapolation of the relation of the major outburst, which indicates that the inner radius of the accretion disk remains constant during the soft states of the major outburst and mini-outbursts. The inner disk temperature of the soft state during the mini-outbursts is lower by a factor of than that during the peak of the major outburst, mostly likely due to the decrease in the mass accretion rate of accretion disk (Frank et al., 2002).
3 Discussion
3.1 Distance and BH mass
The interstellar extinction along the line of sight of one object can be related to its distance. With an empirical linear correlation between the optical extinction and the column density , we can use the from X-ray spectral fitting to estimate the distance, provided the column density from the spectra of X-ray binaries is mainly dominated by the interstellar medium (Miller et al., 2009). Greiner et al. (1996) used a similar method to estimate the distance of GRS 1739 as 6–8.5 kpc. We would like to reexamine the distance measurement by using from /XRT spectral fitting and an updated extinction map. The mean value and the standard deviation of the best-fitting from all the /XRT observations is cm-2, which is in agreement with the individual and/or observations (Miller et al., 2015; Fürst et al., 2016). The variation of in different observations is probably due to the spectral changes especially in the low energy band. Therefore we can constrain the distance of GRS 1739, if this column density is also dominated by the interstellar medium (Miller et al., 2009). With the up-to-date linear relation between column density and optical extinction cm-2 (Foight et al., 2016), we derived the optical extinction . Then we converted into near-infrared extinction with the extinction law (Nishiyama et al., 2008). Based on the high resolution 3D near-infrared extinction map of the Galactic bulge (Schultheis et al., 2014), we estimated the distance of GRS 1739278 to be is 5.5–9.5 kpc, consistent with Greiner et al. (1996).
The BH mass of GRS 1739 remains unknown. In this work we would like to adopt the mean BH mass of the Galactic BH transients. The mean BH mass of the 12 BH transients with firm mass measurements (cf. Corral-Santana et al. 2016 for the latest BH transient catalogue) is 8.0 (1 range). Özel et al. (2010) also found that the BH mass distribution of transient and persistent BH binaries peaks at 7.81.2 (see also Kreidberg et al. 2012), which roughly agrees with the mean BH mass for the BH transients only.
In the following discussions, we take the distance and the BH mass of GRS 1739 as 7.52.0 kpc and 8.02.0 , respectively. Correspondingly, the peak luminosity (0.5–10 keV) of the major outburst in 2014 is about 0.25 (/7.5 kpc)2 () . The peak luminosity of 1996 outburst is about 0.83 crab in the 2–12 keV (obtained from /ASM and see also Borozdin et al., 1998; Borozdin & Trudolyubov, 2000), which is roughly 3.4 times larger than that of 2014 outburst (see Figure 1). If we assume there is no spectral change in the two outburst peaks, then the peak luminosity of the 1996 outburst is about 0.85 (/7.5 kpc)2 () . The peak luminosities of both outbursts are within the luminosity range observed in the outbursts of BH transients (Reynolds & Miller, 2013; Tetarenko et al., 2016), suggesting that the distance and the BH mass adopted here is reasonable.
3.2 Implications of the in the mini-outbursts
| ( erg/s/cm2) | ( erg/s/cm2) | ( ) | ( ) | |
| major outburst | 13.420.15 to 16.580.31 | 4.61 | 8.965.28 to 11.76.52 | <3.08 |
| first mini-outburst | 1.070.06 to 2.040.41 | 0.160.01 to 1.450.09 | 0.710.42 to 1.270.81 | 0.110.06 to 0.970.57 |
| second mini-outburst | 0.630.05 to 2.200.02 | 0.170.01 to 0.360.03 | 0.420.25 to 1.470.87 | 0.110.07 to 0.240.14 |
| a The uncertainties on the luminosities have taken into account the uncertainties in distance and BH mass. | ||||

Since the X-ray spectral states evolutions in the two mini-outbursts are similar to the the major outburst (see Section 2.3), we define the state transition fluxes of the mini-outbursts in the same way to the major outburst. As mentioned in Section 1, the represents the flux when the source leaves the hard state during the outburst rise phase and the represents the flux when the source returns to the hard state during the outburst decay phase. In practice, due to the observational intervals, we did not know the exact time when the source left or returned to the hard state. We thus constrained the () to be in the range between that of last (first) hard state during the rise (decay) phase and that of the adjacent subsequent (previous) observation (see Table 1). All the unabsorbed state transition fluxes and the corresponding luminosities are listed in Table 1. Since observations did not cover the transition to the hard state during the decay phase of the major outburst. The unabsorbed flux of last soft state is about 4.61 erg s-1 cm2, which provides an upper limit constraint on of the major outburst. The is systematically smaller than , which demonstrates the hysteresis effect (e.g. Miyamoto et al., 1995; Maccarone & Coppi, 2003) exists in the mini-outbursts as well as in the major outburst.
To our knowledge, this is for the first time to observe the spectral state transitions in mini-outbursts of BH transients (see Section 3.3). We note that similar phenomena has been detected in NS X-ray binary Aql X-1 (Yu & Dolence, 2007), in which a hard-to-soft state transition was detected in a mini-outburst about 200 days after its 2000 outburst. The hard-to-soft state transition luminosity in the mini-outburst is also one order of magnitude lower than that in the major outburst (see Figure 6). But there is no apparent hysteresis effect in the mini-outburst.
An empirical correlation between the transition luminosity and the peak luminosity of the soft state has been found in bright Galactic X-ray binaries (Yu et al., 2004; Yu et al., 2007; Yu & Dolence, 2007; Yu & Yan, 2009; Tang et al., 2011). It is interesting to check whether the mini-outbursts of GRS 1739278 follow such empirical correlation or not. For this motivation, we used the same method as Yu & Yan (2009) to measure the (i.e., the luminosity of last hard state during the outburst rise phase). The were measured in 15-50 keV for other sources in Yu & Yan (2009). For the X-ray spectra of GRS 1739278 in the hard state, however, the unabsorbed X-ray flux in 0.5–10 keV is about 2-3 times larger than that in 15–50 keV. So it seems that there is an offset of of GRS 1739 in the Figure 6. The and in mini-outbursts of both GRS 1739 and Aql X-1 roughly follow the correlation found in bright outbursts (Figure 6), which indicates that the in the mini-outbursts and the major outburst are likely driven by the same mechanism. The spectral state transition observed in the mini-outbursts suggests that the state transition mechanism can operate at such low luminosity (or a mass accretion rate). Besides, it also indicates that the dynamical range of the mass accretion rate and the timescale for the spectral state transition mechanism to work is at least one order of magnitude. The of GRS 1739 in the mini-outbursts are among the lowest transition luminosity detected in BH transients (Gierliński & Newton, 2006; Yu & Yan, 2009; Dunn et al., 2010; Tang et al., 2011). But they are still higher than that of the persistent BH XRB Cyg X-1 (see Figure 6), which supports the schematic picture of the hard state accretion regimes described in Figure 28 of Yu & Yan (2009), and the idea that the maximum luminosity in the hard state mainly depends on the non-stationary accretion process, which is represented by the substantial rate-of-change in the mass accretion rate during the flare/outburst (Yu & Yan, 2009).
3.3 Comparison with mini-outbursts in other BH transients
There are two mini-outbursts are detected after the 2014 outburst of GRS 1739. It is unclear whether or not the source went to quiescence after the major outburst due to the observational gap (see Figure 3). The decay phase of the soft state in the major outburst follows an exponential decay profile (see Figure 3). We extrapolated this profile to the end of this outburst, and find that the decay of the first mini-outburst did not resume the previous exponential decay profile. Moreover, considering the long interval between the major outburst and the first mini-outburst ( 200 days), we speculate that two mini-outbursts are not the “glitches” superposed on the exponential decay (Chen et al., 1997). It is very likely that the first mini-outburst occurred after the end of the major outburst, which are similar to those observed in other BH transients GRO J042232, XTE J1650500 and MAXI J1659 (Callanan et al., 1995; Shrader et al., 1997; Tomsick et al., 2004; Homan & Belloni, 2005; Jonker et al., 2012; Homan et al., 2013).
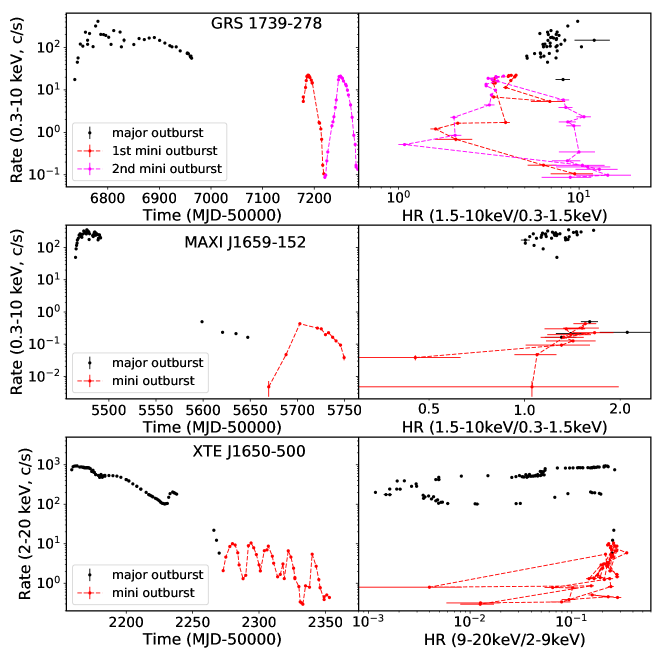
In order to show the uniquity of the mini-outbursts of GRS 1739278, we compared the X-ray spectral evolutions during the mini-outbursts of these BH transients. First, we excluded the mini-outbursts of GRO J042232, since they were detected in optical band, while the behavior in X-rays is different to that in the optical band (Shrader et al., 1997). Fortunately, high cadence X-ray observations of the mini-outbursts of XTE J1650500 and MAXI J1659 had been performed (Tomsick et al., 2004; Homan et al., 2013). We plotted in Figure 7 the X-ray light curve and HID for these sources. The X-ray count rate and hardness ratio are obtained from /XRT online light curve generator (Evans et al., 2007, 2009) and the standard products of .
The duration and the amplitude of the two mini-outbursts in GRS 1739 are similar to that observed in MAXI J1659. But the spectral evolution is quite different. The HIDs of mini-outbursts of MAXI J1659 and XTE J1650 mainly lie on the lower-right of the q-track along with the hard state. The hardness ratio is likely smaller at the lower intensity, which agrees with the anti-correlation between the photon index and the luminosity in the low-luminosity regime (Wu & Gu, 2008; Homan et al., 2013; Plotkin et al., 2013; Cao et al., 2014; Yang et al., 2015). The X-ray spectra of MAXI J1659 and XTE J1650 during the mini-outbursts are all well-fitted with a single power-law. The photon index range from 1.5 to 2.5 for MAXI J1659 (Homan et al., 2013), and from 1.7 to 2.0 for XTE J1650 (Tomsick et al., 2004), which is consistent with the evolution from hard state towards quiescent state (Plotkin et al., 2013). The HIDs of the mini-outbursts of GRS 1739 roughly follows a q-track, which are similar to those in the bright outbursts of BH transients (e.g. Dunn et al., 2010). HIDs together with spectral analysis (see Section 2.3) support that there are X-ray spectral state transitions and hysteresis effect in the mini-outbursts. For the hard state, the hardness ratio of the mini-outbursts is the same as that of major outbursts (the vertical branch of the q-track). For the soft state, on the other hand, the hardness ratios of the mini-outbursts reach lower range than the major outburst, probably because is lower in the mini-outburst is lower (see Figure 5). To conclude, the mini-outbursts in GRS 1739 look quite similar to bright outbursts in terms of X-ray spectral evolution, while other two BH transients are different.
3.4 Unique accretion flow evolution in these two mini-outbursts?
For the two mini-outbursts, the observed lowest 0.5 –10 keV X-ray luminosity is 3.52.2 , and the observed highest luminosity is 0.015 , where the BH mass is 82 and the distance is 7.52.0 kpc. The uncertainties on the luminosities have taken into account the uncertainties in distance and BH mass. Black hole transients in this luminosity range generally stay in the hard state (Dunn et al., 2010; Reynolds & Miller, 2013), with X-ray spectra dominated by a power-law component. Below roughly 0.01 , the photon index increases from to with decreasing X-ray luminosity (e.g. Tomsick et al., 2004; Wu & Gu, 2008; Homan et al., 2013; Kalemci et al., 2013; Plotkin et al., 2013; Cao et al., 2014; Yang et al., 2015). This phenomena is also observed in active galactic nuclei (AGN; e.g. Gu & Cao, 2009; Younes et al., 2011; Yang et al., 2015). The observed X-ray emission are generally believed to be from the Compton scattering process in hot accretion flow or corona (see reviews in Yuan & Narayan, 2014), although different dynamical models are proposed (e.g. Sobolewska et al., 2011; Gardner & Done, 2013; Qiao & Liu, 2013; Cao et al., 2014; Yang et al., 2015).
During the two mini-outbursts of GRS 1739278, the hardest X-ray spectra were detected among the lowest flux levels (; see also Fürst et al., 2016), and the thermal dominated X-ray spectra were detected after the outburst peak. The X-ray spectral evolution during these two mini-outbursts is totally different from other BH transients at such luminosity range, i.e. spectral state transitions are observed. Such state transition behavior usually occurs in the bright outburst with mean peak luminosity (0.6– 10 keV; Reynolds & Miller, 2013), and it is interpreted by the interplay between hot and cold accretion flows (see reviews in Done et al., 2007; Zhang, 2013; Yuan & Narayan, 2014). The X-ray emission has different origin in the two states. Interestingly, the and of the mini-outbursts in both BH transient GRS 1739278 and NS transient Aql X-1 follow the same empirical correlation found in bright X-ray binaries (see Figure 6), which indicates that the state transition in mini-outbursts is triggered by the same mechanism as that in bright outbursts. It is still unclear why the state transitions only occur in the mini-outbursts of GRS 1739278 but not other BH transients. Further investigation, i.e. systematically examining a large sample of mini-outbursts, is in demand to answer this question.
Acknowledgments
We are grateful to the anonymous referee for his/her very pertinent comments. We would like to thank Dr. Fu-Guo Xie for helpful discussions. This work was supported in part by the National Key Research and Development Program of China under grant number 2016YFA0400804, the National Natural Science Foundation of China under grant numbers 11403074 and 11333005, and the Strategic Priority Research Program “The Emergence of Cosmological Structures” under Grant No. XDB09000000. This research has made use of the MAXI data provided by RIKEN, JAXA and the MAXI team, and the Swift data supplied by the UK Swift Science Data Centre at the University of Leicester. This research has made use of data obtained from the High Energy Astrophysics Science Archive Research Center (HEASARC), provided by NASA’s Goddard Space Flight Center.
References
- Arnaud (1996) Arnaud K. A., 1996, in Jacoby G. H., Barnes J., eds, Astronomical Society of the Pacific Conference Series Vol. 101, Astronomical Data Analysis Software and Systems V. p. 17
- Belloni (2010) Belloni T. M., 2010, in Belloni T., ed., Lecture Notes in Physics, Berlin Springer Verlag Vol. 794, The Jet Paradigm. p. 53
- Borozdin & Trudolyubov (2000) Borozdin K. N., Trudolyubov S. P., 2000, ApJ, 533, L131
- Borozdin et al. (1998) Borozdin K. N., Revnivtsev M. G., Trudolyubov S. P., Aleksandrovich N. L., Sunyaev R. A., Skinner G. K., 1998, Astronomy Letters, 24, 435
- Callanan et al. (1995) Callanan P. J., et al., 1995, ApJ, 441, 786
- Cao et al. (2014) Cao X.-F., Wu Q., Dong A.-J., 2014, ApJ, 788, 52
- Chen et al. (1997) Chen W., Shrader C. R., Livio M., 1997, ApJ, 491, 312
- Corral-Santana et al. (2016) Corral-Santana J. M., Casares J., Muñoz-Darias T., Bauer F. E., Martínez-Pais I. G., Russell D. M., 2016, A&A, 587, A61
- Degenaar et al. (2011) Degenaar N., Wijnands R., Altamirano D., Cackett E., Linares M., Homan J., Fridriksson J., 2011, The Astronomer’s Telegram, 3654
- Done et al. (2007) Done C., Gierliński M., Kubota A., 2007, A&ARv, 15, 1
- Dubus et al. (2001) Dubus G., Hameury J.-M., Lasota J.-P., 2001, A&A, 373, 251
- Dunn et al. (2010) Dunn R. J. H., Fender R. P., Körding E. G., Belloni T., Cabanac C., 2010, MNRAS, 403, 61
- Dunn et al. (2011) Dunn R. J. H., Fender R. P., Körding E. G., Belloni T., Merloni A., 2011, MNRAS, 411, 337
- Esin et al. (1997) Esin A. A., McClintock J. E., Narayan R., 1997, ApJ, 489, 865
- Evans et al. (2007) Evans P. A., et al., 2007, A&A, 469, 379
- Evans et al. (2009) Evans P. A., et al., 2009, MNRAS, 397, 1177
- Filippova et al. (2014) Filippova E., et al., 2014, The Astronomer’s Telegram, 5991
- Foight et al. (2016) Foight D. R., Güver T., Özel F., Slane P. O., 2016, ApJ, 826, 66
- Frank et al. (2002) Frank J., King A., Raine D. J., 2002, Accretion Power in Astrophysics: Third Edition. Cambridge University Press
- Fürst et al. (2016) Fürst F., et al., 2016, ApJ, 832, 115
- Gardner & Done (2013) Gardner E., Done C., 2013, MNRAS, 434, 3454
- Gierliński & Done (2004) Gierliński M., Done C., 2004, MNRAS, 347, 885
- Gierliński & Newton (2006) Gierliński M., Newton J., 2006, MNRAS, 370, 837
- Greiner et al. (1996) Greiner J., Dennerl K., Predehl P., 1996, A&A, 314, L21
- Gu & Cao (2009) Gu M., Cao X., 2009, MNRAS, 399, 349
- Hameury et al. (2000) Hameury J.-M., Lasota J.-P., Warner B., 2000, A&A, 353, 244
- Homan & Belloni (2005) Homan J., Belloni T., 2005, Ap&SS, 300, 107
- Homan et al. (2013) Homan J., Fridriksson J. K., Jonker P. G., Russell D. M., Gallo E., Kuulkers E., Rea N., Altamirano D., 2013, ApJ, 775, 9
- Jonker et al. (2012) Jonker P. G., Miller-Jones J. C. A., Homan J., Tomsick J., Fender R. P., Kaaret P., Markoff S., Gallo E., 2012, MNRAS, 423, 3308
- Kalemci et al. (2013) Kalemci E., Dinçer T., Tomsick J. A., Buxton M. M., Bailyn C. D., Chun Y. Y., 2013, ApJ, 779, 95
- Kato et al. (2004) Kato T., Nogami D., Matsumoto K., Baba H., 2004, PASJ, 56, S109
- Kreidberg et al. (2012) Kreidberg L., Bailyn C. D., Farr W. M., Kalogera V., 2012, ApJ, 757, 36
- Krimm et al. (2013) Krimm H. A., et al., 2013, ApJS, 209, 14
- Krimm et al. (2014) Krimm H. A., et al., 2014, The Astronomer’s Telegram, 5986
- Kuulkers (1998) Kuulkers E., 1998, New Astron. Rev., 42, 1
- Kuulkers (2000) Kuulkers E., 2000, New Astron. Rev., 44, 27
- Kuulkers et al. (1996) Kuulkers E., Howell S. B., van Paradijs J., 1996, ApJ, 462, L87
- Lasota (2001) Lasota J.-P., 2001, New Astron. Rev., 45, 449
- Maccarone & Coppi (2003) Maccarone T. J., Coppi P. S., 2003, MNRAS, 338, 189
- Matsuoka et al. (2009) Matsuoka M., et al., 2009, PASJ, 61, 999
- Meyer & Meyer-Hofmeister (2015) Meyer F., Meyer-Hofmeister E., 2015, PASJ, 67, 52
- Miller et al. (2009) Miller J. M., Cackett E. M., Reis R. C., 2009, ApJ, 707, L77
- Miller et al. (2015) Miller J. M., et al., 2015, ApJ, 799, L6
- Miyamoto et al. (1995) Miyamoto S., Kitamoto S., Hayashida K., Egoshi W., 1995, ApJ, 442, L13
- Nishiyama et al. (2008) Nishiyama S., Nagata T., Tamura M., Kandori R., Hatano H., Sato S., Sugitani K., 2008, ApJ, 680, 1174
- Osaki et al. (2001) Osaki Y., Meyer F., Meyer-Hofmeister E., 2001, A&A, 370, 488
- Özel et al. (2010) Özel F., Psaltis D., Narayan R., McClintock J. E., 2010, ApJ, 725, 1918
- Patruno et al. (2009) Patruno A., Watts A., Klein Wolt M., Wijnands R., van der Klis M., 2009, ApJ, 707, 1296
- Patruno et al. (2016) Patruno A., Maitra D., Curran P. A., D’Angelo C., Fridriksson J. K., Russell D. M., Middleton M., Wijnands R., 2016, ApJ, 817, 100
- Paul et al. (1996) Paul J., Bouchet L., Churazov E., Sunyaev R., 1996, IAU Circ., No. 6348, #1 (1996). Edited by Green, D. W. E., 6348
- Plotkin et al. (2013) Plotkin R. M., Gallo E., Jonker P. G., 2013, ApJ, 773, 59
- Qiao & Liu (2013) Qiao E., Liu B. F., 2013, ApJ, 764, 2
- Remillard & McClintock (2006) Remillard R. A., McClintock J. E., 2006, ARA&A, 44, 49
- Reynolds & Miller (2013) Reynolds M. T., Miller J. M., 2013, ApJ, 769, 16
- Russell et al. (2012) Russell D. M., et al., 2012, MNRAS, 419, 1740
- Schultheis et al. (2014) Schultheis M., et al., 2014, A&A, 566, A120
- Shakura & Sunyaev (1973) Shakura N. I., Sunyaev R. A., 1973, A&A, 24, 337
- Shrader et al. (1997) Shrader C. R., Wagner R. M., Charles P. A., Harlaftis E. T., Naylor T., 1997, ApJ, 487, 858
- Sobolewska et al. (2011) Sobolewska M. A., Papadakis I. E., Done C., Malzac J., 2011, MNRAS, 417, 280
- Tanaka & Shibazaki (1996) Tanaka Y., Shibazaki N., 1996, ARA&A, 34, 607
- Tang et al. (2011) Tang J., Yu W.-F., Yan Z., 2011, Research in Astronomy and Astrophysics, 11, 434
- Tetarenko et al. (2016) Tetarenko B. E., Sivakoff G. R., Heinke C. O., Gladstone J. C., 2016, ApJS, 222, 15
- Tomsick et al. (2004) Tomsick J. A., Kalemci E., Kaaret P., 2004, ApJ, 601, 439
- Vargas et al. (1997) Vargas M., et al., 1997, ApJ, 476, L23
- Wijnands et al. (2001) Wijnands R., Méndez M., Miller J. M., Homan J., 2001, MNRAS, 328, 451
- Wu & Gu (2008) Wu Q., Gu M., 2008, ApJ, 682, 212
- Yang et al. (2015) Yang Q.-X., Xie F.-G., Yuan F., Zdziarski A. A., Gierliński M., Ho L. C., Yu Z., 2015, MNRAS, 447, 1692
- Younes et al. (2011) Younes G., Porquet D., Sabra B., Reeves J. N., 2011, A&A, 530, A149
- Yu & Dolence (2007) Yu W., Dolence J., 2007, ApJ, 667, 1043
- Yu & Yan (2009) Yu W., Yan Z., 2009, ApJ, 701, 1940
- Yu et al. (2004) Yu W., van der Klis M., Fender R., 2004, ApJ, 611, L121
- Yu et al. (2007) Yu W., Lamb F. K., Fender R., van der Klis M., 2007, ApJ, 663, 1309
- Yuan & Narayan (2014) Yuan F., Narayan R., 2014, ARA&A, 52, 529
- Zhang (2013) Zhang S.-N., 2013, Frontiers of Physics, 8, 630