Beyond the “faster is slower” effect
Abstract
The “faster is slower” effect raises when crowded people push each other to escape through an exit during an emergency situation. As individuals push harder, a statistical slowing down in the evacuation time can be achieved. The slowing down is caused by the presence of small groups of pedestrians (say, a small human cluster) that temporary blocks the way out when trying to leave the room. The pressure on the pedestrians belonging to this blocking cluster raises for increasing anxiety levels and/or larger number of individuals trying to leave the room through the same door. Our investigation shows, however, that very high pressures alters the dynamics in the blocking cluster, and thus, changes the statistics of the time delays along the escaping process. It can be acknowledged a reduction in the long lasting delays, while the overall evacuation performance improves. We present results on this novel phenomenon taking place beyond the “faster is slower” regime.
pacs:
45.70.Vn, 89.65.LmI Introduction
The “faster is slower” (FIS) effect is the major phenomenon taking place when
pedestrians get involved in a dangerous situation and try to escape through an
emergency door. It states that the faster they try to reach the exit, the
slower they move due to clogging near the door. This effect has been
observed in the context of the “social force model” (SFM) Helbing et al. (2000).
But research on other physical systems, such as grains flowing out a 2D hopper
or sheep entering a barn, are also known to exhibit a “faster is slower”
behavior Pastor et al. (2015).
Research on the clogging delays (in the context of the SFM) has shown
that a small group of pedestrians close to the door is responsible
for blocking the way to the rest of the crowd. This blocking
clusters appear as an arch-like metastable structure
around the exit. The tangential friction between pedestrians belonging to this
blocking structure was shown to play a relevant role with respect to the
whole evacuation delays Parisi and Dorso (2005, 2007). However, either the amount of
blocking structures or its time life can vary according to the
door width, the presence of obstacles or fallen individuals
Frank and Dorso (2011); Cornes et al. (2017). Further studies on blocking structures appearing in
granular media research can be found in
Refs. Janda et al. (2008); Garcimartín et al. (2010); Lozano et al. (2012a, b).
The relevance of the blocking structures on the time evacuation
performance has alerted researchers that the analysis of “reduced”
systems rather than the whole crowd is still a meaningful approach to the FIS
effect. In this context, the authors of Ref. Suzuno et al. (2013) introduced a
simplified breakup model for a small arch-like blocking structure (in a SFM
setting). They examined theoretically the breakup of the arch due to a single
moving particle, and observed a FIS-like behavior. Thus, they concluded that
the essentials of the FIS phenomenon could be described with a system of only a
few degrees of freedom.
To our knowledge, neither the theoretical approach nor the computational
simulations have been pushed to extreme scenarios. That is, no special
attention has been paid to those situations where the pedestrians experience
very high anxiety levels (see Section IV) while the crowd
becomes increasingly large.
In the current investigation we explore the pedestrians anxiety levels from a
relaxed situation to desired velocities that may cause dangerous pressures. A
dangerous pressure of 1600 Nm-1 may be associated to at least three
pedestrians pushing with a desired velocity close to 20 m/s (see
Refs. Helbing et al. (2000); Stokes (1976)).
Our work is organized as follows: a brief review of the basic SFM can be found
in Section II. Section III details the simulation
procedures used to studying the room evacuation of a crowd under panic. The
corresponding results are presented in Section IV. Finally, the
conclusions are summarized in Section V.
II Background
II.1 The Social Force Model
Our research was carried out in the context of the “social force model” (SFM)
proposed by Helbing and co-workers Helbing et al. (2000). This model states that human
motion is caused by the desire of people to reach a certain destination, as
well as other environmental factors. The pedestrians behavioral pattern in a
crowded environment can be modeled by three kind of forces: the “desire
force”, the “social force” and the “granular force”.
The “desire force” represents the pedestrian’s own desire to reach a specific target position at a desired velocity . But, in order to reach the desired target, he (she) needs to accelerate (decelerate) from his (her) current velocity . This acceleration (or deceleration) represents a “desire force” since it is motivated by his (her) own willingness. The corresponding expression for this forces is
| (1) |
where is the mass of the pedestrian .
corresponds to the unit vector pointing to the target position and is a
constant related to the relaxation time needed to reach his (her) desired
velocity. Its value is determined experimentally. For simplicity, we assume that
remains constant during an evacuation process and is the same for all
individuals, but changes according to the current position of the
pedestrian. Detailed values for and can be found in
Refs. Helbing et al. (2000); Frank and Dorso (2011).
The “social force” represents the psychological tendency of two pedestrians, say and , to stay away from each other by a repulsive interaction force
| (2) |
where means any pedestrian-pedestrian pair, or pedestrian-wall
pair. and are fixed values, is the distance between the
center of mass of the pedestrians and and the distance
is the sum of the pedestrians radius. means the unit vector in
the direction.
Any two pedestrians touch each other if their distance is smaller than . In this case, an additional force is included in the model, called the “granular force”. This force is considered be a linear function of the relative (tangential) velocities of the contacting individuals. Its mathematical expression reads
| (3) |
where is a fixed parameter. The function
is zero when its argument is negative (that is,
) and equals unity for any other case (Heaviside function).
represents the difference between
the tangential velocities of the sliding bodies (or between the individual and
the walls).
The above forces actuate on the pedestrians dynamics by changing his (her) current velocity. The equation of motion for pedestrian reads
| (4) |
where the subscript represents all the other pedestrians
(excluding ) and the walls.
II.2 Clustering structures
The time delays during an evacuation process are related to clogged people, as explained in Refs. Parisi and Dorso (2005, 2007). Groups of pedestrians can be defined as the set of individuals that for any member of the group (say, ) there exist at least another member belonging to the same group () in contact with the former. That is, the distance between them () is less than the sum of their radius (). This kind of structure is called a human cluster and it can be mathematically defined as
| (5) |
where corresponds to any set of individuals.
During an evacuation process, different human clusters may appear inside the
room. But, some of them are able to block the way out. We are
interested in the minimum set of human clusters that connects both sides of the
exit. Thus, we will call blocking clusters or blocking
structures to those human structures that block the exit. Two blocking clusters
are different if they differs at least in one pedestrian. That is, if they
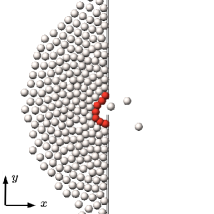
differ in the number of members or in pedestrians themselves. Fig. 1
shows (in highlighted color) a blocking structure near the door.
We define the blocking time as the total time during which the
evacuation process is stopped due to any blocking cluster. That is, the sum of
the “life time” of each blocking cluster (blocking delays).
III Numerical simulations
Most of the simulation processes were performed on a 20 m 20 m room with
225 pedestrians inside. The occupancy density was close to
0.6 individuals/m2 as suggested by healthy indoor environmental regulations
Mysen et al. (2005). The room had a single exit on one side, as shown in
Fig. 1. The door was placed in the middle of the side wall to
avoid corner effects.
A few simulation processes were performed on 30 m 30 m and 40 m
40 m rooms with 529 and 961 pedestrians inside, respectively. The door
was also placed in the middle of the side wall.
The pedestrians were initially placed in a regular square arrangement
along the room with random velocities, resembling a Gaussian distribution
with null mean value. The desired velocity was the same for all the
individuals. At each time-step, however, the desired direction
was updated, in order to point to the exit.
Two different boundary conditions were examined. The first one included a
re-entering mechanism for the outgoing pedestrians. That is, those individuals
who were able to leave the room were moved back inside the room and placed at
the very back of the bulk with velocity m/s, in order to cause a
minimal bulk perturbation. This mechanism was carried out in order to keep
the crowd size unchanged.
The second boundary condition was the open one. That is, the individuals
who left the room were not allowed to enter again. This condition approaches to
real situations, and thus, it is useful for comparison purposes.
The simulating process lasted for approximately 2000 s whenever the re-entering
mechanism was implemented. If no re-entering was allowed, each evacuation
process lasted until 70% of individuals had left the room. If this condition
could not be fulfilled, the process was stopped after 1000 s. Whenever the
re-entering mechanism was not allowed, at least 30 evacuation processes were
run for each desired velocity .
The explored anxiety levels ranged from relaxed situations (m/s) to
extremely stressing ones (m/s). This upper limit may hardly be
reached in real life situations. However, extremely stressing situations may
produce similar pushing pressures as those in a larger crowd with moderate
anxiety levels (see Ref. Sticco et al. (2017) for details). Thus, this wide range of
desired velocities provided us a full picture of the blocking effects due to
high pressures.
The simulations were supported by Lammps molecular dynamics simulator
with parallel computing capabilities Plimpton (1995). The time integration
algorithm followed the velocity Verlet scheme with a time step of s.
All the necessary parameters were set to the same values as in previous works
(see Refs. Frank and Dorso (2011, 2015); Sticco et al. (2017)).
We implemented special modules in C++ for upgrading the Lammps
capabilities to attain the “social force model” simulations. We also checked
over the Lammps output with previous computations (see
Refs. Frank and Dorso (2011, 2015)).
Data recording was done at time intervals of , that is, at intervals
as short as 10% of the pedestrian’s relaxation time (see Section
II.1). The recorded magnitudes were the pedestrian’s positions and
velocities for each evacuation process. We also recorded the corresponding
social force and granular force actuating on each individual.
IV Results
IV.1 Evacuation time versus the desired velocity
As a first step we measured the mean evacuation time for a wide range of
desired velocities , many of them beyond the interval analyzed by Helbing
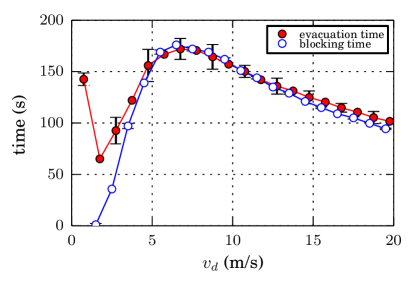
and co-workers (see Ref. Helbing et al. (2000)). This is shown in Fig. 2
(filled symbols and red line). The faster is slower regime can be
observed for desired velocities between 2 m/s and 8 m/s (approximately).
However, the evacuation time improves beyond this interval, meaning that the
greater the pedestrian’s anxiety level, the better with respect to
the overall time saving. This phenomenon was reported for both boundary
conditions mentioned in Section III.
Therefore, we actually attain a faster is faster regime for desired
velocities larger than 8 m/s, instead of the expected faster is
slower regime. This is a novel behavior that has not been reported before (to
our knowledge) in the literature. This effect holds even if we include the
elastic force introduced by Helbing et al. in Ref. Helbing et al. (2000) (not shown
in Fig. 2).
The overall time performance has been reported to be related to the
clogging delays, understood as the period of time between two outgoing
pedestrians (see Refs. Parisi and Dorso (2005, 2007); Frank and Dorso (2011) for details). But, since
most of these time intervals correspond to the presence of blocking
structures near the door, we examined closely the delays due to blockings
for increasing anxiety levels (i.e. desired velocities ).
Fig. 2 exhibits (in hollow symbols and blue line) the computed
blocking time for a wide range of desired velocities. That is, the
cumulative “life time” of all the blocking clusters occurring
during an evacuation process. Notice that the blocking delays become
non-vanishing for m/s. This threshold corresponds to those situations
where the granular forces become relevant, according to
Refs. Parisi and Dorso (2005, 2007). It is, indeed, the lower threshold for the
faster is slower effect.
No complete matching between the mean evacuation time and the blocking time can
be observed along the interval . This
means that the blocking time does not fulfill the evacuation time, but other
time waists are supposed to be relevant. We traced back all the time delays
experienced by the pedestrian, and noticed that the time lapse between the
breakup of the blocking structure and the leaving time of the pedestrians
(belonging to this blocking structure) was actually a relevant magnitude. This
transit time explained the difference between the evacuation time and
the blocking time.
According to Fig. 2, the transit time does not play a role for
desired velocities larger than m/s. The evacuation time appears to be
highly correlated to the blocking delays above this value. Thus, the noticeable
enhancement in the evacuation performance taking place between m/s and
m/s (i.e. the “faster is faster” effect) is somehow related
to the enhancement in the blocking time. In other words, the delays associated
to the blocking clusters appear to explain the entire faster is
faster effect.
We next measured the evacuation time for three different crowd sizes. We chose
a relatively small crowd (225 pedestrians), a moderate one (529 pedestrians)
and a large one (961 pedestrians). The corresponding room sizes were
2020 m, 3030 m and 4040 m, respectively. The results are
shown in Fig. 3.
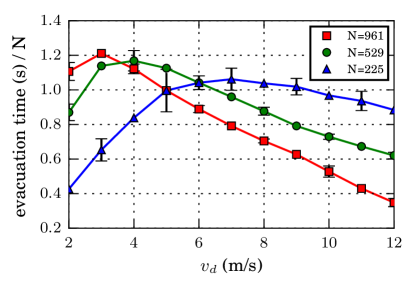
The three situations exhibited in Fig. 3 achieve a faster
is faster phenomenon, since the slope of each evacuation curve changes sign
above a certain desired velocity. As the number of individuals in the crowd
becomes larger, the interval attaining a negative slope increases. That
is, only a moderate anxiety level is required to achieve the faster
is faster phenomenon if the crowd is large enough.
Notice that the larger crowd (i.e. 961 individuals) attains the
steepest negative slope. Thus, as more people push to get out (for any fixed
desired velocity ), the faster they will evacuate.
For a better insight of the “faster is faster” phenomenon, we binned the
blocking delays into four time intervals or categories. This allowed a
quantitative examination of the changes in the delays when moving from the
“faster is slower” regime to the “faster is faster” regime.
Fig. 4 shows the mean number of blocking delays (for each
time interval) as a function of .
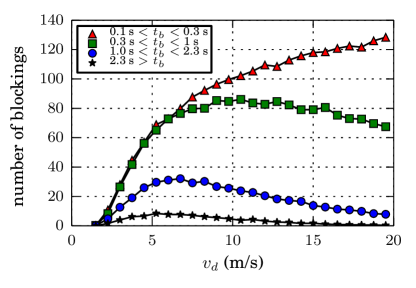
The four blocking time intervals represented in Fig. 4
increase for increasing desired velocities until m/s. This is
in agreement with the “faster is slower” regime, since the faster the
pedestrians try to evacuate, the more time they spend stuck in the blocking
structure.
Beyond 8 m/s, the number of blockings corresponding to those time intervals
greater than 0.3 s reduces (as increases). Thus, the individuals spend
less time stuck in the blocking structure for increasing anxiety levels.
It is true that the delays between 0.1 s and 0.3 s increase for high
anxiety levels. But a quick inspection of Fig. 4 shows that
this increase (represented in red triangular symbols) is not enough to balance
the decrease in the time intervals greater than 0.3 s. Consequently, the
overall evacuation time follows the same behavior as the long lasting delays
(say, the faster is faster behavior).
The above research may be summarized as follows. The scenario for high
anxiety levels (say, m/s) corresponds to a “nearly always”
blocking scenario. However, two different blocking instances can be noticed. The
“faster is slower” corresponds to the first instance. The “faster is faster”
is the second instance appearing after either high values of or increasing
number of pedestrians. Many long lasting blockings seem to break down into
shorter blockings, or even disappear (see Fig. 4).
Our results, so far, suggest that the breakup process of the blocking structures
needs to be revisited. We hypothesize that a connection between this breakup
process and the pedestrian’s pushing efforts should exist. The next two
Sections will focus on this issue.
IV.2 Blocking cluster breakup
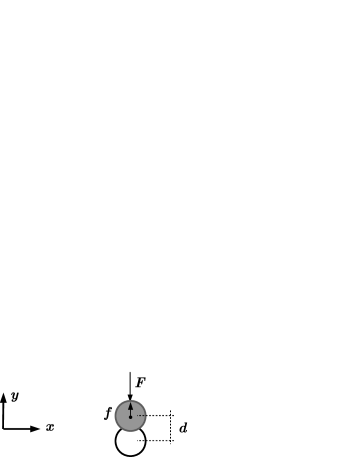
We now examine the position of the breakups in the blocking cluster. We define
the breakup position as the one on the -axis (according to
Fig. 1) where any pedestrian gets released from the blocking
structure. Fig. 5 exhibits a histogram of the breakup position for a
fixed anxiety level (m/s).
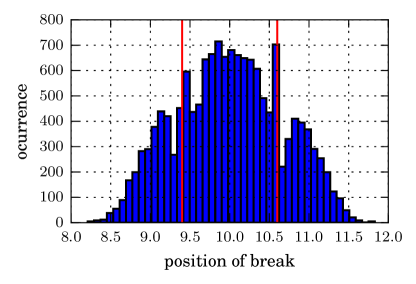
The mean value of the distribution in Fig. 5 is close to m,
that is, the mid-position of the door. This means that the breakups are
likely to occur in front of the exit. The same result holds for other
desired velocities in the investigated range (not shown). Therefore, this
region is of special interest with respect to the breakup process.
From our current simulations and previous work (see Ref. Sticco et al. (2017)), we
realized that the mid-position corresponds to the crowd area of highest
pressure (for an exit width of 1.2 m). This is in agreement with the maximum
amount of breakups, since higher pushing efforts may help forward the blocking
pedestrians.
IV.3 Stationary blocking model
For a better understanding of the relation between the crowd pushing forces
and the breakup process, we decided to focus on the behavior of a single
pedestrian who tries to get released from the blocking structure.
We mimicked a small piece of the blocking structure (i.e. red
individuals in Fig. 1) as two individuals standing still,
but separated a distance smaller than the pedestrian’s diameter. A third
pedestrian was set in between the former, mimicking the pedestrian who tries to
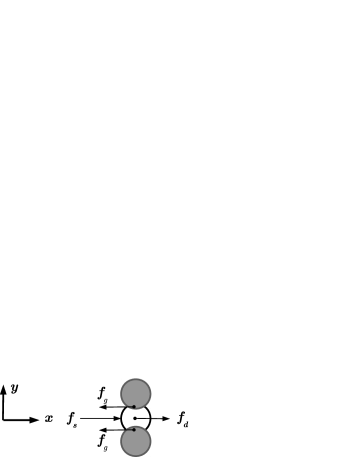
get released from the blocking structure. Fig. 8a represents this set
of three pedestrians. Notice that Fig. 8a may represent any piece of
the blocking structure, but according to Section IV.2, it will usually
correspond to the middle piece of the blocking structure.
The middle pedestrian in Fig. 8a is being pushed from behind by the
rest of the crowd. The crowd pushing force points in the
-direction. Two granular forces appear in the opposite direction as
a consequence of pedestrian’s advancement. More details can be found in
Appendix A.
The still pedestrians on both sides experience the repulsion due to the
mid-pedestrian, as shown in Fig. 8b. This repulsion points in the
-direction. We are assuming, however, that the pedestrians on the sides do
not move during the breakup process. Thus, the force should be balanced by
the crowd (in the -direction). This corresponds to the balancing force
in Fig. 8b. More details can be found in
Appendix A.
Notice that our mimicking model assumes that the crowd pushes the mid-pedestrian
along the -direction, while also pushes the still pedestrians along the
-direction. Both forces ( and ) are similar in nature.
Actually, for the current geometry, and are approximately
equal.
The crowd pushing force increases for increasing anxiety levels. For a slowly moving crowd, this force varies linearly with , according to Eq. (1). We can therefore set its value as
| (6) |
for any fixed coefficient . The value of depends
linearly on the number of individuals in the crowd.
We assume a completely blocked situation at the beginning of the simulation.
The center of mass of the three pedestrians were initially aligned and the
velocity of the individual in the middle was set to zero.
We computed the blocking time on this simple model. This was defined as the
period of time required for the moving pedestrian to release from the
other two (still ones). This time is supposed to mimic the blocking time of the
blocking structure, since the three pedestrians represent a small piece of this
structure. Fig. 6 shows the blocking time as a function
of the desired velocity .
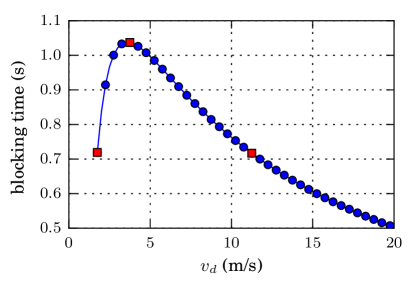
A comparison between Fig. 2 and Fig. 6 shows
the same qualitative behavior for the blocking time, although the scale along
the axis is somehow different. The blocking time slope changes sign at
7 m/s in Fig. 2, while Fig. 6 shows a
similar change at 3.75 m/s. This discrepancy can be explained because of the
chosen value of .
The chosen value for in Fig. 6 was 2000 (see
caption). This value corresponds to the expected pushing force for a crowd of
225 pedestrians (and m/s). However, as the pedestrians evacuate from
the room, the crowd pushing force diminishes. The effective force along the
whole process is actually smaller, and so is the value. Thus, according
to Eq. (16), the “effective” maximum blocking time is expected to
lie at a larger value than 3.75 m/s.
The above reasoning is also in agreement with the evacuation time shown in
Fig. 3 for an increasing number of pedestrians. The maximum
evacuation time takes place at lower anxiety levels (i.e.
values) as the crowd size becomes larger. Therefore, the pushing force downscales the faster is faster threshold, as expected from our
simple model.
So far, the mimicking model for a small piece of the blocking structure
exhibits a faster is slower instance for low crowd’s pushing forces,
and a faster is faster instance for large pushing forces. The
associated equations for both instances are summarized in
Appendix A. This formalism, however, stands for a simple
stationary situation. We will release this hypothesis in Section
IV.4.
IV.4 Non-stationary blocking model
We were able to establish a connection between the breakup process and the
crowd pushing forces in Section IV.3. Now, we will examine the
force balance on the moving pedestrian along the -axis (see
Fig. 8a). As already mentioned, our attention is placed on initially
aligned pedestrians with null velocity.
Fig. 7 shows the force balance on the moving
pedestrian (of the mimicking model) during the simulated breakup process. The
balance is expressed as the ratio between the positive forces and the
negative forces. The former corresponds to the sum of all the forces
that push the moving pedestrian towards the exit (i.e. the own desired
force, and the social force from all the neighbors). The latter corresponds to
the force in the opposite direction to the movement (i.e the granular
force). According to Section II.1 and Fig. 8
| (7) |
where and correspond to the pushing forces
from the crowd. Both are
social forces in nature. Notice, however, that only the contribution on the
-axis is relevant in the mimicking model (see Fig. 8).
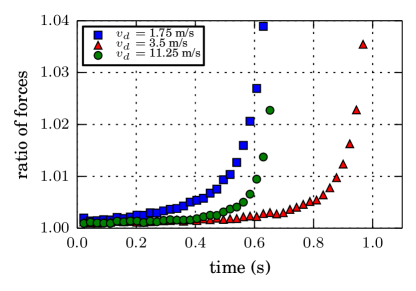
Fig. 7 presents three different situations,
corresponding to those desired velocities highlighted in red color in
Fig. 6. The three situations stand for any faster
is slower instance, the maximum blocking time instance and any faster
is faster instance, respectively. But care was taken in choosing similar
blocking times for the first and the third situation, in order to achieve a fair
comparison.
The three situations shown in Fig. 7 exhibit a ratio
close to unity during the first stage of the process. This means that all the
forces actuating on the moving pedestrian are approximately balanced. The
formalism presented in Appendix A is approximately valid during
this stage of the process.
Notice that this quasi-stationary stage lasts until the very end
of the breakup process (say, 1% above unity). However, a striking
positive slope can be seen during the last stage of each process. The
slopes are quite similar on each process (although shifted in time), and thus,
this last stage seems not to be relevant in the overall blocking time. We can
envisage the last stage as an expelling process before the blocking structure
breaks into two pieces.
An important conclusion can be derived from the inspection of
Fig. 7: although the breakup process is actually
non-stationary, the balance constrain (ratio) is quite accurate
for the early breakup process.
IV.5 Remarks
From our point of view, the balance constrain (that is, ratio1) is
actually the main reason for the faster is faster phenomenon to take
place.
Recall that the positive forces correspond to the sum of the pushing forces of the crowd ( and ) and the moving pedestrian’s own desire (). The latter, however, is not relevant with respect to the former because most of the pushing effort is done by the crowd (for example, is approximately 10% of for 225 individuals). Thus, the positive forces are roughly , according to Section IV.3 and Appendix A.3. The balance constrain becomes approximately
| (8) |
Eq. (8) is meaningful since it expresses the fact that the
negative force balances the pushing force, in order to
keep the pedestrian moving forward (at an almost constant velocity).
However, the granular force is currently .
The factor corresponds to the compression between the
pedestrian and his (her) neighbor in the blocking structure (see
Eq. (14) for details). Thus
| (9) |
Notice that Eq. (9) resembles the behavior of
Fig. 6. The slope of is positive for low
anxiety levels (i.e. values), but changes sign as the anxiety
level becomes increasingly large. Since the blocking time varies as ,
we may conclude that Eq. (9) mimics the faster is
slower and the faster is faster instances.
The logarithm in Eq. (9) is the key feature for the slope
change. Recall from Eq. (14) that stands for the
compression in the blocking structure. But, although compression increases for
increasing pushing forces of the crowd, it seems not enough to diminish the
pedestrian velocity in order to hold the faster is slower phenomenon
at high anxiety levels. Consequently, the blocking time decreases, achieving a
faster is faster instance.
In Section A.4 a more detailed formalism is exhibited on this
issue.
V Conclusions
Our investigation focused on the evacuation of extremely anxious
pedestrians through a single emergency door, in the context of the “social
force model”. No previous research has been done, to our knowledge, for
anxiety levels so high that may cause dangerous pressures (even in relatively
small crowds).
Unexpectedly, we found an improvement in the overall evacuation time for
desired velocities above m/s (and a crowd size of 225 individuals).
That is, the faster is slower effect came to an end at this anxiety
level, while a novel faster is faster phenomenon raised (at least)
until a desired velocity of m/s. This unforeseen phenomenon was also
achieved for increasingly large crowds and lower desired velocities.
A detailed examination of the pedestrian’s blocking clusters showed that the
faster is faster instance is related to shorter “life times” of
the blocking structures near the exit. The long lasting structures
taking place at the faster is slower instance now breakup into short
lasting ones. The breakup is most likely to occur straight in front of the
exit.
We mimicked the breakup process of a small piece of the blocking structure
through a minimalistic model. The most simple model that we could image was a
moving pedestrian between two still individuals. Although its simplicity, it
was found to be useful for understanding the connection between the
crowd’s pushing forces and the blocking breakup process.
The mimicking model for the blocking structure showed that a balance between the
crowd’s pushing forces and the friction with respect to the neighboring
individuals held along the breakup. Only at the very end of the process, the
pedestrian was expelled out of the blocking structure.
We concluded from the force balance condition that friction was the
key feature for the faster is faster instance to take place. As the
crowd pushing force increases, the compression between individuals in the
blocking structure seems not enough to provide a slowing down in the moving
pedestrian. Thus, the faster is slower instance switches to a
faster is faster instance. The latter can be envisaged as brake
failure mechanism.
We want to stress the fact that, although we investigated extremely high
anxiety situations, faster is faster instance may be present at
lower desired velocities if the crowd size is large enough. We were able to
acknowledge the faster is faster phenomenon for desired
velocities as low as m/s when the crowd included 1000 individuals
approximately.
Acknowledgements.
This work was supported by the National Scientific and Technical Research Council (spanish: Consejo Nacional de Investigaciones Científicas y Técnicas - CONICET, Argentina) grant number PIP 2015-2017 GI, founding D4247(12-22-2016). C.O. Dorso is full researcher of the CONICET. G.A. Frank is assistant researcher of the CONICET. I.M. Sticco and F.E. Cornes have degree in Physics.Appendix A A simple blocking model
A.1 The dynamic
This Appendix examines in detail a very simple model for the time delays in the blocking cluster. We consider a single moving pedestrian stuck in the blocking cluster, as shown in Fig. 8. The moving pedestrian tries to get released from two neighboring individuals that are supposed to remain still during the process. The three pedestrians belong to the same blocking structure, according to the definition given in Section II.2. The equation of motion for the pedestrian in the middle of Fig. 8a reads
| (10) |
where represents the force due to other pedestrians pushing
from behind, represents the moving pedestrian own desire, and
represents the corresponding tangential friction due to contact between the
neighboring pedestrians. and are the mass and velocity of the moving
pedestrian (see caption in Fig. 8), respectively. The
expressions for and are as follows
| (11) |
The granular force expressed in (11) depends only on the
velocity since the other pedestrians are supposed to remain still. The
magnitude is the difference between the pedestrian’s diameter and
the inter-pedestrian distance . It represents the compression between two
contacting individuals. The other parameters correspond to usual literature
values (see Refs. Parisi and Dorso (2005, 2007)).
The movement equation (10) expresses the dynamic for the passing through pedestrian. The characteristic time needed for the pedestrian to reach the stationary state is
| (12) |
and therefore we expect the pedestrian movement to become stationary
after this time. It can be easily checked that drops to less than 0.1 s
for compression distances as small as 1 mm. This means that the moving
pedestrian’s velocity will be close to the stationary velocity if the passing
through process scales to .
The stationary velocity can be obtained from Eq. (10) and the condition . Thus,
| (13) |
This is (approximately) the velocity that the moving pedestrian will
hold most of the time while trying to get released from the other individuals.
Thus, the time delay while passing across the still pedestrians
will scale as .
Notice from Eqs. (12) and (13) that decreases for
increasing compression values. Also, an increase in the values of or
will cause the corresponding increase in . The resulting value
for is a balance between the distance and the forces or
. The distance , however, resembles the compression between members
of the same blocking cluster, while the force corresponds to individuals
out of the blocking cluster.
A.2 The force balance
Fig. 8b shows a schematic diagram for the forces applied to one of the still individuals. The force in Fig. 8b represents the repulsive feeling actuating on the still individual due to the moving pedestrian. The force is the required counter force necessary to keep the individual still. That is, balances the repulsive feeling for a specific compression distance (and fix values of and ). According to Section II.1, the relationship between the compression distance and (or ) is as follows
| (14) |
for the known values and .
A.3 The crowd context
The above relations for a single moving pedestrian sliding between two still
individuals should be put in the context of an evacuation process. These three
pedestrian may belong to a “blocking structure”, as defined in Section
II.2. The blocking structure may be surrounded by a large number of
pedestrians that do not belong to this structure, but continuously pushes the
structure towards the exit. Therefore, the forces and are
similar in nature and somehow represent the pressure actuating on the blocking
structure from the surrounding crowd.
The pressure from the crowd depends on the anxiety level of the pedestrians. It
has been shown that, at equilibrium, the crowd pressure grows linearly with the
desired velocity and the number of individuals pushing from behind
(see Ref. Sticco et al. (2017)). It seems reasonable, as a first approach, that
and varies as for any fixed coefficient .
The forces and may be replaced by in
Eq. (13) for the evacuation process scenario, as explained in
Section IV.3. Thus, the stationary velocity only depends
on the desired velocity of the pedestrians (and the total number of
individuals). Fig. 9 shows the behavior of the time delay
() for a wide range of desired velocities .
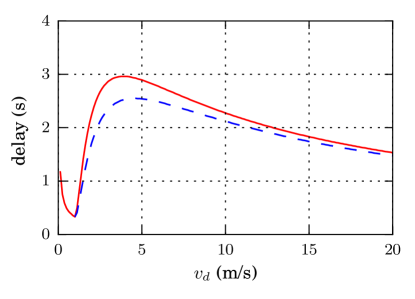
The continuous line in Fig. 9 exhibits a local minimum and a maximum
at m/s and m/s, respectively. The behavioral pattern for
m/s corresponds to non-contacting situations (that is, ).
The characteristic time for this regime is , and thus, the time delay
decreases for increasing values of , according to Eq. (13).
The regime for m/s corresponds to those situations where the moving
pedestrian gets in contact with the two still individuals. Since the
compression distance becomes positive, there is a reduction in the
characteristic time , according to Eq. (12). This reduction
actually changes the value of the stationary velocity , as expressed
in (13). It is not immediate whether the reduction increases or
decreases the velocity . A closer inspection of the
behavioral pattern is required.
The computation of the slope for with respect to gives the following expression
| (15) |
This expression shows a change of sign in the slope of for increasing values of . It can be checked over that the expression enclosed in brackets is negative for small compressions, but as decreases (due to increments), it becomes positive. The vanishing condition for (15) is
| (16) |
The last term on the right becomes neglectable with respect to for the
current literature values. Thus, the maximum time delay () takes
place close to . The corresponding compression distance for
this desired velocity is .
A.4 Remarks
The above computations show two relevant values: the one where a
minimum time delay takes place and the one where the maximum time delay
happens. The former corresponds to , or equivalently, .
The latter corresponds to or (approximately).
The forces and are similar in nature for the evacuation scenario. Therefore, can be replaced by in the Eq. (14) for the stationary passing through process shown in Fig. 8. The stationary balance for Eq. (10) then reads
| (17) |
Accordingly, the time delay reads
| (18) |
Notice from this expression that small increments of produce
increasing values of the time delay if . But, further
compression increments (that is, increments beyond ) reduce the time
delay, since the exponential function grows increasingly fast.
The above observations give a better understanding for the local maximum
exhibited in Fig. 9. The positive slope range for
corresponds to small values of (that is, small values for
the exponential function in (18)), while the negative slope range
(beyond the local maximum) corresponds to high values.
Although Fig. 9 is in correspondence with Eq. (15), the
local maximum does not actually take place at m/s but at
m/s. This is right since Fig. 9 represents a complete
simulation of the moving pedestrian instead of the stationary model for the
pedestrian at the crossing point between the still individuals, as expressed in
Eq. (10) and shown in Fig. 8.
Fig. 9 also shows in dashed line the time delay for individuals with
non-neglectable elastic compressions (see caption for details). The local
maximum also appears but for lower time delay values.
References
- Helbing et al. (2000) D. Helbing, I. Farkas, and T. Vicsek, Nature 407, 487 (2000).
- Pastor et al. (2015) J. M. Pastor, A. Garcimartín, P. A. Gago, J. P. Peralta, C. Martín-Gómez, L. M. Ferrer, D. Maza, D. R. Parisi, L. A. Pugnaloni, and I. Zuriguel, Phys. Rev. E 92, 062817 (2015).
- Parisi and Dorso (2005) D. Parisi and C. O. Dorso, Physica A 354, 606 (2005).
- Parisi and Dorso (2007) D. Parisi and C. O. Dorso, Physica A 385, 343 (2007).
- Frank and Dorso (2011) G. Frank and C. O. Dorso, Physica A 390, 2135 (2011).
- Cornes et al. (2017) F. Cornes, G. Frank, and C. Dorso, Physica A: Statistical Mechanics and its Applications 484, 282 (2017).
- Janda et al. (2008) A. Janda, I. Zuriguel, A. Garcimartín, L. A. Pugnaloni, and D. Maza, EPL (Europhysics Letters) 84, 44002 (2008).
- Garcimartín et al. (2010) A. Garcimartín, I. Zuriguel, L. A. Pugnaloni, and A. Janda, Phys. Rev. E 82, 031306 (2010).
- Lozano et al. (2012a) C. Lozano, G. Lumay, I. Zuriguel, R. C. Hidalgo, and A. Garcimartín, Phys. Rev. Lett. 109, 068001 (2012a).
- Lozano et al. (2012b) C. Lozano, A. Janda, A. Garcimartín, D. Maza, and I. Zuriguel, Phys. Rev. E 86, 031306 (2012b).
- Suzuno et al. (2013) K. Suzuno, A. Tomoeda, and D. Ueyama, Phys. Rev. E 88, 052813 (2013).
- Stokes (1976) J. Stokes, NASA-MSFC 2.5, 5 (1976).
- Mysen et al. (2005) M. Mysen, S. Berntsen, P. Nafstad, and P. G. Schild, Energy and Buildings 37, 1234 (2005).
- Sticco et al. (2017) I. Sticco, G. Frank, S. Cerrotta, and C. Dorso, Physica A: Statistical Mechanics and its Applications 474, 172 (2017).
- Plimpton (1995) S. Plimpton, Journal of Computational Physics 117, 1 (1995).
- Frank and Dorso (2015) G. Frank and C. O. Dorso, International Journal of Modern Physics C 26, 1 (2015).