Detection of faint broad emission lines in type 2 AGN: III. On the relation of type 2 AGN
Abstract
Type 2 active galactic nuclei (AGN) represent the majority of the AGN population. However, due to the difficulties in measuring their black hole (BH) masses, it is still unknown whether they follow the same BH mass-host galaxy scaling relations valid for quiescent galaxies and type 1 AGN. Here we present the locus of type 2 AGN having virial BH mass estimates in the plane. Our analysis shows that the BH masses of type 2 AGN are dex smaller than type 1 AGN at km s-1, regardless of the (early/late) AGN host galaxy morphology. Equivalently, type 2 AGN host galaxies have stellar velocity dispersions dex higher than type 1 AGN hosts at M⊙.
keywords:
galaxies: active — galaxies: nuclei — Xrays: galaxies — infrared: galaxies — quasars: emission lines — quasars: supermassive black hole1 Introduction
Supermassive black holes (SMBHs, M⊙) are believed to be ubiquitous, sitting at the centres of the spheroid of almost every galaxy. Co-evolutionary models that link the growth of SMBHs and of their host galaxies are supported by the observation of tight scaling relations between the black hole (BH) mass and the host bulge properties, e.g. bulge stellar velocity dispersion (Ferrarese & Merritt, 2000; Gebhardt et al., 2000; Marconi & Hunt, 2003; Häring & Rix, 2004; Gültekin et al., 2009; Graham & Scott, 2013; McConnell & Ma, 2013; Kormendy & Ho, 2013; Savorgnan & Graham, 2015); bulge luminosity and mass (Dressler, 1989; Magorrian et al., 1998; Kormendy & Richstone, 1995; Sani et al., 2011). All these relations are based on local samples of galaxies with dynamically measured BH masses. It is still debated whether or not these scaling relations should depend on the morphology of the galaxy (e.g. barred/unbarred Graham 2008, early/late McConnell & Ma 2013, classical/pseudo-bulges Kormendy & Ho 2013). Furthermore, the galaxy samples used for calibration could suffer from a selection effect due to the resolution of the BH gravitational sphere of influence, in favour of the more massive BHs (Shankar et al., 2016, 2017).
Active galactic nuclei (AGN) are thought to follow the same scaling relations observed in quiescent galaxies with dynamically measured . In particular, reverberation mapped (RM, Blandford & McKee, 1982; Peterson, 1993) type 1 AGN (AGN1, where broad, FWHM km s-1, optical emission lines are visible in their spectra) seem to reproduce the scaling relation once the BH masses are scaled for the virial factor (Onken et al., 2004; Woo et al., 2010; Graham et al., 2011; Park et al., 2012; Grier et al., 2013; Ho & Kim, 2014), , where is the virial mass calculated from RM campaigns. Also low-mass BHs (Baldassare et al., 2016) and narrow line Seyfert 1 galaxies (Woo et al., 2015, but see Rakshit et al. 2017) have relations consistent with that found in quiescent galaxies. However, recent works have found that AGN1 hosts reside significantly below the (Ho & Kim, 2014) and (Reines & Volonteri, 2015) relations of quiescent galaxies. Furthermore, there is evidence that the BH-host scaling relations become less tight as soon as a broader range of BH masses (e.g. M⊙, see the megamaser sample of Greene et al., 2016) and different galaxy morphologies (i.e. disks and spirals, Kormendy et al., 2011) are probed.
Although type 2 AGN (AGN2)111By saying AGN2 we refer to those X-ray selected AGN where there is no (Seyfert 2) or weak (intermediate 1.8 - 1.9) evidence of BLR, or even no lines at all (X-ray Bright Optically Normal Galaxies, XBONG; Comastri et al., 2002) in their optical spectra. represent the majority of the AGN population (La Franca et al., 2005), it is still unsettled whether they do follow the same scaling relations defined by quiescent galaxies. This is because are difficult to measure in type 2 AGN which lack optical broad emission lines. These virialized lines are used in single epoch virial estimators (McLure & Jarvis, 2002; Vestergaard & Peterson, 2006) to directly measure BH masses. According to the unified AGN model (Antonucci, 1993), orientation is responsible for the appearance of broad emission lines coming from the broad line region (BLR) and hence for the AGN1/AGN2 classification, due to the presence of a dusty structure along the line of sight (e.g. the torus, but see e.g. Mezcua et al., 2016). In this scenario, AGN1 and AGN2 are expected to follow the same scaling relations, and therefore BH masses of AGN2 are usually estimated with (indirect) proxies, such as , and . These indirect estimates are often also used to evaluate the AGN BH mass function (BHMF; e.g. Heckman et al., 2004).
In order to directly measure the BH masses of AGN2, we have calibrated virial relations based on the hard X-ray luminosity and on the width of the most relevant near-infrared (NIR; 0.8-2.5 m) and optical emission lines (La Franca et al., 2015; La Franca et al., 2016; Ricci et al., 2017).
We have then carried out a systematic search to detect faint virialized broad line components in the NIR spectra of hard X-ray selected obscured and intermediate class AGN. We have observed the NIR spectra of 41 AGN2 at redshift , randomly drawn from the Swift/BAT 70-month catalogue (Baumgartner et al., 2013). Data reduction, spectral analysis and line fitting parameters have been published in the first paper of the series (Onori et al., 2017a, Paper I). Broad virialized components in the NIR emission lines (i.e. Pa and He 10830 Å) have been measured in 13 out of 41 (30%) of the selected AGN2. This starting sample has been extended with four AGN2 included in the Swift/BAT 70-month catalogue whose FWHM NIR lines, or spectra, were already published. These 17 AGN2 have been used in a companion paper (Onori et al., 2017b, Paper II) to derive the first direct virial in AGN2. The AGN2 virial have been computed using the virial estimators calibrated in Ricci et al. (2017) which are based on the broad NIR FWHM and on the hard X-ray 14-195 keV luminosity. We found that when comparing AGN1 and AGN2 of the same X-ray luminosity, erg s-1, the average FWHM of the BLR in AGN2 is 0.25 dex smaller than measured in the control sample of RM AGN1. As a consequence, AGN2 have 0.5 dex smaller and higher Eddington ratios than RM AGN1 with the same intrinsic X-ray luminosity. These findings do not support a ”pure” orientation-based unified model, possibly indicating that AGN2 could be associated with an earlier evolutionary stage or may comprise different physical configurations or mechanisms for BH growth.
In this paper, we present for the first time the local plane for AGN2 with virial BH masses in order to understand whether AGN2 share the same properties of AGN1.
Throughout the paper we assume a flat CDM cosmology with cosmological parameters = 0.7, = 0.3 and = 70 km s-1 Mpc-1. Unless otherwise stated, all the quoted uncertainties are at 68% (1) confidence level.
| Galaxy | activity | ref | ref | morphological | |||
|---|---|---|---|---|---|---|---|
| type | [M⊙] | [km s-1] | type | ||||
| (1) | (2) | (3) | (4) | (5) | (6) | (7) | (8) |
| 2MASX J07595347+2323241 | 0.0292 | 2 | 7.78 0.09 | This work | 230 21 | L17 | Late |
| 2MASX J18305065+0928414 | 0.0190 | 2 | 7.04 0.09 | Paper II | 196 19 | This work | Late† |
| ESO 234-G050 | 0.0088 | 2 | 6.00 0.10 | Paper II | 69 1 | This work | Early |
| MCG -05-23-016 | 0.0850 | 2 | 7.22 0.06 | Paper II | 172 20 | HL | Early |
| Mrk 348 | 0.0150 | 2/FSRQ | 7.23 0.08 | Paper II | 141 29 | HL | Early |
| NGC 1052 | 0.0050 | 2 | 6.63 0.09 | Paper II | 209 4 | HL | Early |
| NGC 1275 | 0.0176 | 2 | 7.46 0.06 | Paper II | 243 13 | HL | Early |
| NGC 1365 | 0.0055 | 1.8 | 6.65 0.09 | Paper II | 143 19 | HL | Late |
| NGC 2992 | 0.0077 | 2 | 6.72 0.08 | Paper II | 160 17 | HL | Late |
| NGC 4395 | 0.0013 | 1.9 | 5.14 0.07 | Paper II | 27 5 | HL | Late |
| NGC 5506 | 0.0062 | 1.9 | 6.86 0.09 | This work | 174 19 | HL | Late |
| NGC 6221 | 0.0050 | 2 | 6.46 0.06 | Paper II | 64 2 | This work | Late |
| NGC 7465 | 0.0065 | 2 | 6.54 0.10 | Paper II | 95 4 | HL | Early |
2 Data
2.1 Sample selection
Stellar velocity dispersion measurements are available on HyperLeda222http://leda.univ-lyon1.fr/ for 8 out of the 17 AGN2 with NIR broad lines presented in Paper II. Using the optical long slit spectra published in Paper I we have measured for three additional AGN2. We fitted with Gaussian profiles the Ca triplet 8500.36, 8544.44, 8664.52 Å absorption lines extracted with a 1′′ aperture, corresponding to 397, 192, and 92 pc for 2MASX J18305065+0928414, ESO 234-G050, and NGC 6221, respectively. The HyperLeda database (Paturel et al., 2003) presents measurements which have been homogenized to a common aperture kpc. In order to convert our measurements to the common radius we corrected for the aperture effects using the relation of Cappellari et al. (2006).
We added to this sample the sources NGC 5506 and 2MASX J07595347+2323241 that have broad Pa lines measured by Lamperti et al. (2017). For NGC 5506 a measurement is available on HyperLeda. For 2MASX J07595347+2323241, Lamperti et al. (2017) fitted the CO band-heads in the H-band (1.570 - 1.720 m) from a long slit spectrum (aperture 0.8′′, corresponding to 480 pc). As done previously, was corrected for aperture effects. Table 1 lists the general properties of the final sample of 13 AGN2 with measured and virial BH masses, which have all been calculated with solution a3 of Table 4 of Ricci et al. (2017) assuming an average virial factor . This virial factor has been derived by Grier et al. (2013) by requiring that RM AGN1 reproduce the relation found in quiescent galaxies by Woo et al. (2013). In all the following analyses, we excluded the most deviating late-type AGN2, NGC 4395 which is one of the least massive active BH known. It is a Sd bulge-less galaxy whose stellar velocity dispersion seems to be rotation-dominated also in the inner-part of the host galaxy (den Brok et al., 2015).
As control sample of AGN1 we adopted the RM sample of 43 AGN1 presented in Ho & Kim (2014), who list 90% of the RM sample along with available bulge morphology, classified as elliptical, classical, or pseudo-bulges. Reliable measurements of central stellar velocity dispersion are available for a total of 31 sources. We considered also one additional RM AGN1, Fairall 9, classified as a classical bulge by Ho & Kim (2014), whose stellar velocity dispersion is available on HyperLeda. The final control sample of RM AGN1 lists 32 sources. The BH masses adopted for RM AGN1 are , where are the updated virial masses also used in the calibrating sample by Ricci et al. (2017) and .
2.2 Stellar velocity dispersion measurements
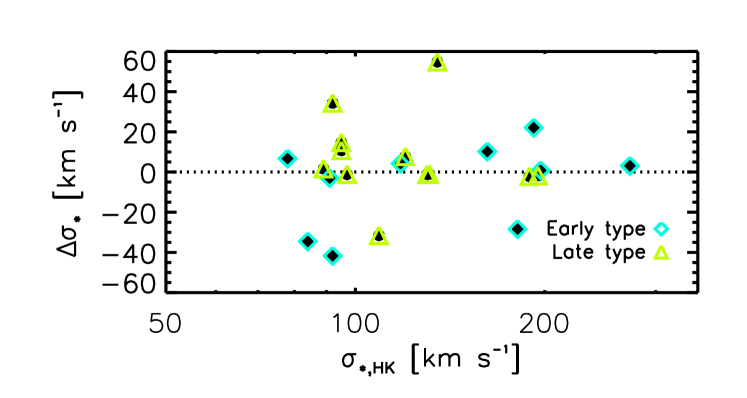
As described in the previous section, the AGN2 stellar velocity dispersions were retrieved from HyperLeda and are extracted at 0.595 kpc, while the stellar velocity dispersions of the RM AGN1 sample are calculated at the effective radius . In order to evaluate whether there are systematic offsets among the two databases, we compare the HyperLeda stellar velocity dispersion and the stellar velocity dispersion measurements collected by Ho & Kim (2014), , for the sample of 22 RM AGN1 that have both. Figure 1 shows the offset between the two measurements as a function of . The dotted line in Figure 1 marks the zero offset. The majority of the sources shows negligible offsets km s-1, and the average is consistent with zero ( km s-1).
We divided RM AGN1 in early and late-type galaxies, as shown in Figure 1 (cyan diamonds are early-type and green triangles are late-type galaxies). Indeed it is known that in late-type galaxies with a rotating stellar disk, the line-of-sight velocity dispersion could be broadened due to the disk rotation (Bennert et al., 2011; Har et al., 2012; Kang et al., 2013). However, as shown in Figure 1, this seems not to be the case for RM AGN1 because the most deviating measurements km s-1 are equally late- and early-type AGN1. The average offset in both early-type ( km s-1) and late-type ( km s-1) are again almost consistent with zero.
We also checked whether in our sample of AGN2 the HyperLeda values have been extracted at significantly larger than . Indeed the disk rotational broadening in late-type galaxies should be higher outside the spheroid. Oohama et al. (2009) reported that the average in SDSS late-type galaxies (Sa, Sb, Sc) is kpc, hence the retrieved from HyperLeda (0.595 kpc) should not contain substantial rotational velocity contamination since the extraction is located well inside this average value.
3 Results
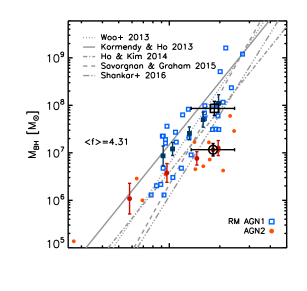
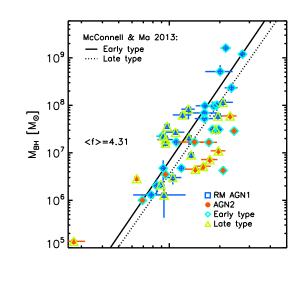
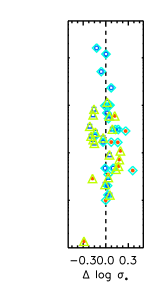
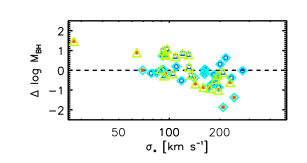
Figure 2 shows the plane for local samples of RM AGN1 (blue open squares) and AGN2 (red filled circles), together with the average BH masses of RM AGN1 (dark blue filled squares) and AGN2 (dark red filled circles) computed in logarithmic bins of stellar velocity dispersion. Average are plotted at the average of the AGN within each velocity dispersion bin. Given the relatively small size of the samples, qualitative trends are better seen if the data are shown in not independent, 0.6 dex wide logarithmic bin. The black open square (circle) in Figure 2 shows the resulting average value of the RM AGN1 (AGN2) sample in the km s-1 stellar velocity bin where most of the two populations overlap and has been plotted at the position of the average . The average BH masses in this bin are: for AGN2 and for RM AGN1. Hence at fixed km s-1, BH masses of AGN2 are dex smaller than in RM AGN1, even though the same virial -factor has been adopted in their derivation. Equivalently, in the overlapping BH mass bin M⊙, AGN2 show higher stellar velocity dispersions: km s-1 for AGN2 and km s-1 for RM AGN1. This means that at fixed M⊙, the stellar velocity dispersion in AGN2 hosts is 0.2 dex higher than RM AGN1. The bottom and right panels of Figure 2 report the residuals in BH masses and stellar velocity dispersions . The BH masses residuals are computed as the logarithmic difference between the virially measured and that expected from the scaling relation of Woo et al. (2013). For comparison, the residual of the relation of Kormendy & Ho (2013, solid grey line) is also reported. As the relation of Woo et al. (2013) is the reference for the calibration of the -factor 4.31 that we are using, the average residual in BH mass () and stellar velocity dispersions () in the RM AGN1 are, as expected, consistent with zero. On the contrary, the average residual for AGN2 is or equivalently .
If RM AGN1 are compared to the relation from Kormendy & Ho (2013), the resulting average residuals are and . These differences roughly correspond to changing the average -factor from 4.31 to 6.2, which is the value needed for RM AGN1 (calibrated by Ho & Kim 2014) to reproduce the relation found in quiescent galaxies by Kormendy & Ho (2013). The same analysis applied to AGN2 confirms that AGN2 show smaller BH masses at fixed , having average (and ). Thus our analysis suggests that AGN2 have smaller BH masses than AGN1 at fixed or equivalently that the AGN2 host galaxies have higher bulge stellar velocity dispersions at fixed .
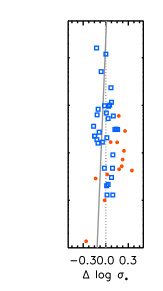
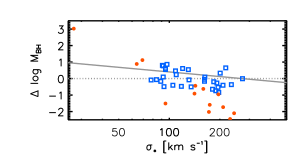
We have investigated whether these differences can be attributed to the host galaxy morphologies. The central panel of Figure 3 shows the distribution of AGN2 (red) and RM AGN1 (blue) in the plane, where the host galaxies are divided into early- (cyan diamonds) and late-type (green triangles). AGN2 hosts are divided into 6 early-type and 6 late-type, while among the RM AGN1 17 are early-type and 15 are late-type galaxies. The scaling relations derived by McConnell & Ma (2013) separately for early-type (solid black line) and late-type (dotted black line) quiescent galaxies are also shown for comparison. While the RM AGN1 are distributed around each of the two scaling relations obtained from quiescent galaxies, the AGN2 lie below them, independently of the AGN host morphology. The BH masses (stellar velocities) residuals are computed as the logarithmic difference between the virially measured () and the values expected for the same morphological class using the correlations by McConnell & Ma (2013). Residuals are reported in the bottom and right panels of Figure 3. The average of early-type (late-type) RM AGN1 is (), while for early-type (late-type) AGN2 is (). This analysis confirms that AGN2 have lower BH masses than expected, regardless of the host galaxy morphology. For the late-type sample of RM AGN1 the is not consistent with zero. However, these residuals are dependent on the choice of the scaling relation used for comparison. The relation for late-type galaxies from McConnell & Ma (2013), which is rather steep (slope of ), systematically under-predicts the BH masses at low stellar velocity dispersion ( km s-1), where most of the late-type RM AGN1 are located.
4 Discussion
According to our analysis, AGN2 have smaller BH masses than RM AGN1 at fixed bulge stellar velocity dispersion or, alternatively, larger velocity dispersions at fixed BH masses. This result nicely complements our previous findings in Paper II, where we showed that AGN2 have smaller BH masses than RM AGN1 at fixed intrinsic hard X-ray luminosity. The AGN2 BH masses have been derived using the virial estimator calibrated by Ricci et al. (2017), that is based on the measurement of the NIR broad FWHM and on the hard X-ray 14-195 keV luminosity. These quantities are most suitable for estimating the virial BH masses of low-luminosity AGN1 and in AGN2 because both the NIR and X-ray bands are less dependent on obscuration or reddening than the optical.
In Paper I we analysed possible biases on the detection of NIR broad emission lines in our AGN2 sample. No connection was found between the NIR broad line detectability and NIR flux, X-ray flux and luminosity, EW, FWHM, S/N, galaxy orientation and as measured in the X-rays. No BLR was found for the most (heavily, cm-2) X-ray obscured sources. In Paper II we further tested possible biases on the subsample of AGN2 that showed NIR virialized broad lines. Our previous analysis suggests that the NIR FWHMs are not probing only the outer (slower rotating) part of the BLR as we do not find any evidence of correlation between the FWHM and obscuration () or extinction (). Therefore the subsample of AGN2 with NIR broad lines has no clear difference with the AGN2 for which we did not find NIR broad lines, and thus our sample of AGN2 with virial could be considered as a representative sample of Compton thin X-ray selected type 2 AGN. There could be several reasons why we did not detect NIR broad lines in the whole sample of AGN2: i) they could be “true” Seyfert 2, i.e. truly lack a BLR (Tran, 2001; Elitzur & Ho, 2009); ii) as the AGN emission is variable, it could be that we observed the source in a low state; iii) in clumpy torus models, the type 1-2 classification is probabilistic and depends on whether there or not there is a clump along the line of sight, and so stochastic variations in the dust distribution in any given source could be a reason for non-detection; iv) in particular for the more obscured sources it could be that the NIR did not allow us to completely penetrate the strong obscuration of the central engine. Regardless of the possible biases of the NIR detectability, it seems unlikely that the missed NIR BLR are hosted in AGN2 having significantly different than the measured ones. A possible observational strategy to supersede or test these hypotheses is moving to longer wavelengths that would be even less affected by dust absorption. Also, the detection of broad lines would benefit of IFU observations with high spatial resolution. Alternatively, our NIR campaign could be complemented by spectropolarimetric observations. However, spectropolarimetry requires high S/N to detect the low linear polarization signal typically observed in AGN (1-5%; Antonucci & Miller, 1985). While spectropolarimetry relies on the presence of a scattering region with sufficient covering factor and optical depth to allow scattered light to be observed and provide a “periscope” view of the inner part of the AGN, infrared spectroscopy offers a direct view of the BLR, as soon as it penetrates the dust.
In this letter we discussed how the difference in BH masses can not be ascribed to biases in the measurement of the bulge stellar velocity dispersion due to rotation in the host galaxy. As a matter of fact, both early and late-type AGN2 host galaxies lie below the scaling relations defined by RM AGN1 and quiescent galaxies. Our analysis is rather conservative as we assumed that both RM AGN1 and AGN2 share the same average virial factor, . In order to have the same BH masses at fixed km s-1, the AGN2 should have a virial factor 7 times higher than the RM AGN1. However, as also discussed in Paper II, according to the AGN unified model, AGN2 are viewed at larger inclinations (more edge-on) than AGN1, and there are indications that the -factor decreases with increasing inclination (Risaliti et al., 2011; Pancoast et al., 2014; Bisogni et al., 2017). This would imply that an even smaller -factor would probably be more appropriate for AGN2. This argument is also supported by the recent finding of Du et al. (2017) who performed a spectropolarimetric study of six Seyfert 2 having dynamically measured , and found a -factor consistent with that of pseudo-bulges.
At face value, our sample of AGN2 do not follow the scaling relation determined for RM AGN1 (Woo et al., 2013), as they seem to follow a shallower relation with . Indeed this can be also seen in the bottom panel of Figure 2, where the residuals from the scaling relation have a dependence on . The AGN2 lie below all the scaling relations presented in Figure 2, which have been calibrated on quiescent galaxies (Woo et al., 2013; Kormendy & Ho, 2013; Ho & Kim, 2014; Savorgnan & Graham, 2015). In particular, the scaling relations of Kormendy & Ho (2013) is valid for elliptical and classical bulges, whereas the relation of Ho & Kim (2014) is calibrated on pseudo-bulges. However, the determination of a different relation for AGN2 is beyond the scope of this letter.
Recently, Shankar et al. (2016, triple-dot-dashed line in Figure 2) discussed how the presence of selection effects in favour of the more massive BHs could be important in determining the underlying relation. In this framework our AGN2 dataset, where faint broad virialized emission lines have been detected, suggests that the whole AGN population could indeed follow a scaling relation with a lower normalization and a broader spread than previously measured. As more dynamically measured are collected also for low-massive BHs, M⊙, the full distribution of BH masses at fixed galaxy properties is now starting to be explored. Indeed our results on the AGN2 are also in agreement with the relation measured in megamaser disks galaxies (Greene et al., 2016). As discussed in Reines & Volonteri (2015), there is the possibility that if BH seeds are massive (e.g. M⊙) the low-mass end of the relation between BHs and galaxies flattens toward an asymptotic value, creating a characteristic “plume” of less grown BHs (see also Barausse et al., 2017).
The observed difference in BH masses in type 1 and 2 AGN sharing the same luminosity (Paper II) and velocity dispersion does not comply with the standard AGN unified model where the type 1 and 2 classification is only the product of line-of-sight orientation. Also the modified AGN unification scenario in which the torus inner radius (and then the opening angle) increases with the AGN luminosity (Lawrence, 1991) is not able to reproduce our observations, as we see a difference in BH masses at fixed intrinsic AGN luminosity and host galaxy properties. Evolutionary models (Hopkins et al., 2005) that predict AGN2 as the preceding buried accreting phase of an AGN1 are instead favoured by our results. However, given our current understanding of the growth of BHs in low- and moderate-luminosity AGN (and in particular the importance of stochastic accretion and variability, e.g. Hickox et al., 2014; Schawinski et al., 2015), this explanation could probably be incomplete. If the BH growth in type 1 and 2 AGN is driven mainly by galaxy mergers, it will result in different bulge properties than if the evolution is mainly driven by internal secular processes. This issue will be further discussed in a forthcoming paper (Ricci et al. in prep).
As the BH-host galaxy scaling relations are the fundamental ingredients to derive the BHMF and its evolution, it is mandatory to better quantify the observed BH mass differences in type 1 and 2 AGN. As discussed in the introduction, the scaling relations could be different according to the bulge host morphology. This translates into different -factors and potentially different . It is thus important to analyse the AGN host bulge morphology to better understand which are the main drivers of the observed differences between type 1 and 2 AGN.
Acknowledgments
Part of this work was supported by PRIN/MIUR 2010NHBSBE and PRIN/INAF 2014_3. We thank the referee for constructive comments which improved the quality of our paper. We thank Cesare Perola for useful discussions. RS acknowledges support from the ERC Grant Agreement n. 306476. RM acknowledges ERC Advanced Grant 695671 ”QUENCH” and support by the Science and Technology Facilities Council (STFC). This paper is based on observations made with ESO telescopes at the Paranal Observatory and the Large Binocular Telescope (LBT) at Mt. Graham, Arizona. This research has made use of the HyperLeda database and of the NASA/IPAC Extragalactic Database (NED), which is operated by the Jet Propulsion Laboratory, California Institute of Technology, under contract with the National Aeronautics and Space Administration.
References
- Antonucci (1993) Antonucci R., 1993, ARA&A, 31, 473
- Antonucci & Miller (1985) Antonucci R. R. J., Miller J. S., 1985, ApJ, 297, 621
- Baldassare et al. (2016) Baldassare V. F., et al., 2016, ApJ, 829, 57
- Barausse et al. (2017) Barausse E., Shankar F., Bernardi M., Dubois Y., Sheth R. K., 2017, MNRAS, 468, 4782
- Baumgartner et al. (2013) Baumgartner W. H., Tueller J., Markwardt C. B., Skinner G. K., Barthelmy S., Mushotzky R. F., Evans P. A., Gehrels N., 2013, ApJS, 207, 19
- Bennert et al. (2011) Bennert V. N., Auger M. W., Treu T., Woo J.-H., Malkan M. A., 2011, ApJ, 726, 59
- Bisogni et al. (2017) Bisogni S., Marconi A., Risaliti G., 2017, MNRAS, 464, 385
- Blandford & McKee (1982) Blandford R. D., McKee C. F., 1982, ApJ, 255, 419
- Cappellari et al. (2006) Cappellari M., et al., 2006, MNRAS, 366, 1126
- Comastri et al. (2002) Comastri A., et al., 2002, ApJ, 571, 771
- Dressler (1989) Dressler A., 1989, in Osterbrock D. E., Miller J. S., eds, IAU Symposium Vol. 134, Active Galactic Nuclei. p. 217
- Du et al. (2017) Du P., Wang J.-M., Zhang Z.-X., 2017, ApJ, 840, L6
- Elitzur & Ho (2009) Elitzur M., Ho L. C., 2009, ApJ, 701, L91
- Ferrarese & Merritt (2000) Ferrarese L., Merritt D., 2000, ApJ, 539, L9
- Gebhardt et al. (2000) Gebhardt K., et al., 2000, ApJ, 543, L5
- Graham (2008) Graham A. W., 2008, ApJ, 680, 143
- Graham & Scott (2013) Graham A. W., Scott N., 2013, ApJ, 764, 151
- Graham et al. (2011) Graham A. W., Onken C. A., Athanassoula E., Combes F., 2011, MNRAS, 412, 2211
- Greene et al. (2016) Greene J. E., et al., 2016, ApJ, 826, L32
- Grier et al. (2013) Grier C. J., et al., 2013, ApJ, 773, 90
- Gültekin et al. (2009) Gültekin K., et al., 2009, ApJ, 698, 198
- Har et al. (2012) Har C. E., Bennert V. N., Auger M. W., Treu T., Woo J.-H., Malkan M. A., 2012, ApJS, 201, 29
- Häring & Rix (2004) Häring N., Rix H.-W., 2004, ApJ, 604, L89
- Heckman et al. (2004) Heckman T. M., Kauffmann G., Brinchmann J., Charlot S., Tremonti C., White S. D. M., 2004, ApJ, 613, 109
- Hickox et al. (2014) Hickox R. C., Mullaney J. R., Alexander D. M., Chen C.-T. J., Civano F. M., Goulding A. D., Hainline K. N., 2014, ApJ, 782, 9
- Ho & Kim (2014) Ho L. C., Kim M., 2014, ApJ, 789, 17
- Hopkins et al. (2005) Hopkins P. F., Hernquist L., Martini P., Cox T. J., Robertson B., Di Matteo T., Springel V., 2005, ApJ, 625, L71
- Kang et al. (2013) Kang W.-R., Woo J.-H., Schulze A., Riechers D. A., Kim S. C., Park D., Smolcic V., 2013, ApJ, 767, 26
- Kormendy & Ho (2013) Kormendy J., Ho L. C., 2013, ARA&A, 51, 511
- Kormendy & Richstone (1995) Kormendy J., Richstone D., 1995, ARA&A, 33, 581
- Kormendy et al. (2011) Kormendy J., Bender R., Cornell M. E., 2011, Nature, 469, 374
- La Franca et al. (2005) La Franca F., et al., 2005, ApJ, 635, 864
- La Franca et al. (2015) La Franca F., et al., 2015, MNRAS, 449, 1526
- La Franca et al. (2016) La Franca F., Onori F., Ricci F., Bianchi S., Marconi A., Sani E., Vignali C., 2016, Frontiers in Astronomy and Space Sciences, 3, 12
- Lamperti et al. (2017) Lamperti I., et al., 2017, MNRAS, 467, 540
- Lawrence (1991) Lawrence A., 1991, MNRAS, 252, 586
- Magorrian et al. (1998) Magorrian J., et al., 1998, AJ, 115, 2285
- Marconi & Hunt (2003) Marconi A., Hunt L. K., 2003, ApJ, 589, L21
- McConnell & Ma (2013) McConnell N. J., Ma C.-P., 2013, ApJ, 764, 184
- McLure & Jarvis (2002) McLure R. J., Jarvis M. J., 2002, MNRAS, 337, 109
- Mezcua et al. (2016) Mezcua M., Prieto M. A., Fernández-Ontiveros J. A., Tristram K. R. W., 2016, MNRAS, 457, L94
- Onken et al. (2004) Onken C. A., Ferrarese L., Merritt D., Peterson B. M., Pogge R. W., Vestergaard M., Wandel A., 2004, ApJ, 615, 645
- Onori et al. (2017a) Onori F., et al., 2017a, MNRAS, 464, 1783
- Onori et al. (2017b) Onori F., et al., 2017b, MNRAS, 468, L97
- Oohama et al. (2009) Oohama N., Okamura S., Fukugita M., Yasuda N., Nakamura O., 2009, ApJ, 705, 245
- Pancoast et al. (2014) Pancoast A., Brewer B. J., Treu T., Park D., Barth A. J., Bentz M. C., Woo J.-H., 2014, MNRAS, 445, 3073
- Park et al. (2012) Park D., Kelly B. C., Woo J.-H., Treu T., 2012, ApJS, 203, 6
- Paturel et al. (2003) Paturel G., Petit C., Prugniel P., Theureau G., Rousseau J., Brouty M., Dubois P., Cambrésy L., 2003, A&A, 412, 45
- Peterson (1993) Peterson B. M., 1993, PASP, 105, 247
- Rakshit et al. (2017) Rakshit S., Stalin C. S., Chand H., Zhang X.-G., 2017, ApJS, 229, 39
- Reines & Volonteri (2015) Reines A. E., Volonteri M., 2015, ApJ, 813, 82
- Ricci et al. (2017) Ricci F., La Franca F., Onori F., Bianchi S., 2017, A&A, 598, A51
- Risaliti et al. (2011) Risaliti G., Salvati M., Marconi A., 2011, MNRAS, 411, 2223
- Sani et al. (2011) Sani E., Marconi A., Hunt L. K., Risaliti G., 2011, MNRAS, 413, 1479
- Savorgnan & Graham (2015) Savorgnan G. A. D., Graham A. W., 2015, MNRAS, 446, 2330
- Schawinski et al. (2015) Schawinski K., Koss M., Berney S., Sartori L. F., 2015, MNRAS, 451, 2517
- Shankar et al. (2016) Shankar F., et al., 2016, MNRAS, 460, 3119
- Shankar et al. (2017) Shankar F., Bernardi M., Sheth R. K., 2017, MNRAS, 466, 4029
- Tran (2001) Tran H. D., 2001, ApJ, 554, L19
- Vestergaard & Peterson (2006) Vestergaard M., Peterson B. M., 2006, ApJ, 641, 689
- Woo et al. (2010) Woo J.-H., et al., 2010, ApJ, 716, 269
- Woo et al. (2013) Woo J.-H., Schulze A., Park D., Kang W.-R., Kim S. C., Riechers D. A., 2013, ApJ, 772, 49
- Woo et al. (2015) Woo J.-H., Yoon Y., Park S., Park D., Kim S. C., 2015, ApJ, 801, 38
- den Brok et al. (2015) den Brok M., et al., 2015, ApJ, 809, 101