Multiwavelength characterisation of an ACT-selected, lensed dusty star-forming galaxy at = 2.64
Abstract
We present C i (2–1) and multi-transition 12CO observations of a dusty star-forming galaxy, ACT J2029+0120, which we spectroscopically confirm to lie at = 2.64. We detect CO(3–2), CO(5–4), CO(7–6), CO(8–7), and C i (2–1) at high significance, tentatively detect HCO+(4–3), and place strong upper limits on the integrated strength of dense gas tracers (HCN(4–3) and CS(7–6)). Multi-transition CO observations and dense gas tracers can provide valuable constraints on the molecular gas content and excitation conditions in high-redshift galaxies. We therefore use this unique data set to construct a CO spectral line energy distribution (SLED) of the source, which is most consistent with that of a ULIRG/Seyfert or QSO host object in the taxonomy of the Herschel Comprehensive ULIRG Emission Survey. We employ RADEX models to fit the peak of the CO SLED, inferring a temperature of T117 K and cm-3, most consistent with a ULIRG/QSO object and the presence of high density tracers. We also find that the velocity width of the C i line is potentially larger than seen in all CO transitions for this object, and that the ratio is also larger than seen in other lensed and unlensed submillimeter galaxies and QSO hosts; if confirmed, this anomaly could be an effect of differential lensing of a shocked molecular outflow.
Subject headings:
galaxies: evolution — galaxies: high-redshift — ISM: jets and outflows — radio lines: galaxies1. Introduction
A longstanding problem in galaxy evolution is tracking the build-up of stellar mass over cosmic time (Madau & Dickinson 2014, and references therein). Gaining a complete census of the star formation history of the universe relies on a large suite of complementary observations, which can probe different regimes in star formation, including both unobscured (traced by ultraviolet light and nebular narrow emission lines, such as H) and obscured (traced by dust continuum emission) star formation. The discovery and follow-up of 850 m-bright submillimeter galaxies (SMGs; Smail et al. 1997; Barger et al. 1998; Hughes et al. 1998) with flux densities from a few to 10 mJy by the Submillimetre Common User Bolometric Array (SCUBA) opened a new window in mapping the buildup of stellar mass in the universe. The past decade has seen significant progress in deep, blank-field surveys at millimeter and submillimeter wavelengths over small patches of the sky. While rare, SMGs account for a non-negligible fraction of the cosmic star formation rate at > 1 (Blain et al., 2002; Magnelli et al., 2011; Murphy et al., 2011; Casey et al., 2012a, b; Magnelli et al., 2013; Casey et al., 2014).
Until recently, the properties of SMGs were difficult to constrain, due to the lack of ultraviolet or optical counterparts with which their redshifts could be measured. These starbursting galaxies are hypothesized to be the high-redshift progenitors of massive elliptical galaxies, but display little to no emission at shorter wavelengths. Early work aiming to localize SMGs using radio counterparts (Chapman et al., 2005) had limited success, for a possibly biased sample. More recently, the onset of high sensitivity, large bandwidth millimeter and submillimeter receivers has revolutionized the field of detecting and studying a variety of dusty star-forming galaxy (DSFG) populations (Casey et al. 2014, and references therein), allowing for the determination of the redshifts for a substantial number of objects using bright molecular and atomic fine structure lines (e.g.,Weiß et al. 2009; Vieira et al. 2013; Weiß et al. 2013; Strandet et al. 2016). Despite this new discovery space opening for the study of SMGs, many questions remain about the state of their large reservoirs of molecular gas, including the characterisation of their kinematics (Hodge et al., 2012), excitations (Walter et al., 2011), and star formation efficiencies.
In this paper, we present new observations of a lensed DSFG detected by the Atacama Cosmology Telescope (ACT; Swetz et al. 2011), ACT J2029+0120 (hereafter ACT J2029), using the Institut de Radioastronomie Millimétrique (IRAM) 30 m telescope on Pico de Veleta. We use these new data to establish the galaxy’s redshift, characterize the excitation conditions and other properties of its molecular gas, and confirm its status as a lensed system. In Section §2 we describe our earlier observations of the source, which were insufficient to determine its redshift, and the new observations taken at the IRAM 30 m. In Section §3 we present the parameters derived from these new observations, and in Section §4 we discuss the implications of our observations for ACT J2029’s intrinsic properties. The cosmological parameters , , and are assumed throughout. All magnitudes are in the AB system (Oke & Gunn, 1983).
2. Observations
2.1. Atacama Cosmology Telescope
ACT J2029 was initially detected as a point source in ACT three-band observations of an equatorial field overlapping the Stripe 82 region of deep Sloan Digital Sky Survey (SDSS) coverage (Gralla et al., in prep). Without deboosting corrections, its measured flux densities at 148, 218, and 277 GHz are , , and , respectively, with a nominal 218 GHz position of =20:29:55.7 =+01:20:54.5 (J2000; positional uncertainty).
2.2. Large Millimeter Telescope
The source was further observed on 2013 May 30 with the Redshift Search Receiver (RSR; Erickson et al. 2007) on the Large Millimeter Telescope (LMT), with the aim of constraining its redshift (PI: Wilson). The total on-source integration time was 27,000 s, with a system temperature and an elevation at which the LMT’s elevation gain changes slowly. The data were calibrated following the standard procedures described by Zavala et al. (2015). A single emission line was detected at a frequency of , with an apparent flux of and a velocity FWHM (corrected for instrumental resolution) of . Given a pointing offset of from the location of the peak CO emission (see Section §2.3 below) and together with the effective width of the RSR beam at 95 GHz (interpolating between 75 and 110 GHz: Zavala et al. 2015), we corrected the apparent flux to (including a 10% uncertainty in the flux scale). The absence of any other lines in the RSR’s 73–111 GHz bandwidth ruled out the CO(5–4) transition as the detected emission line, or any higher- transition. However, CO(4–3) at , CO(3–2) at , CO(2–1) at , and CO(1–0) at remained as possible identifications.
2.3. CARMA
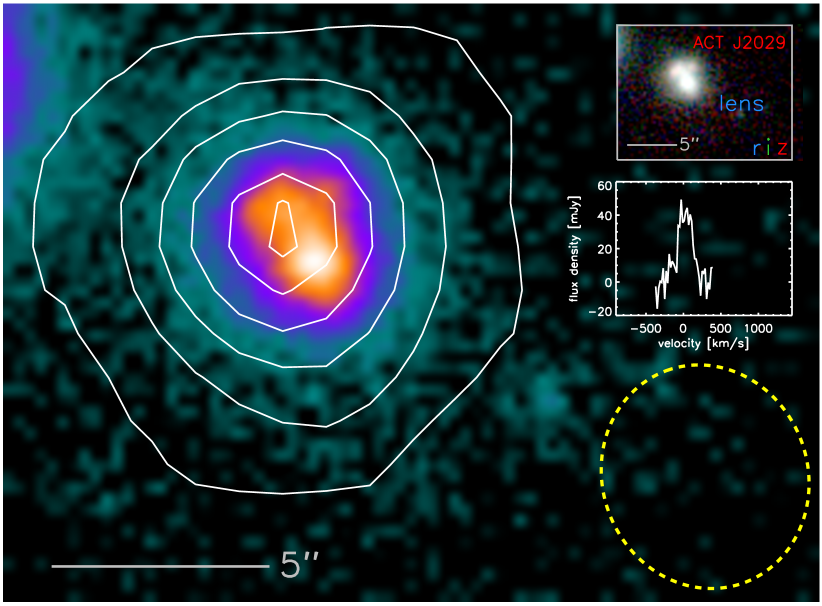
ACT J2029 was re-observed with the Combined Array for Research in Millimeter-wave Astronomy (CARMA) in its compact D configuration at 95 GHz (proposal c1204; PI Baker). The observations were taken on 2014 January 20 with a total of 4.8 hrs on source. The data were calibrated with observations of J2134018 (gain), J2015+372 (bandpass), and MWC349 (flux, with a reference flux density of 1.18 Jy) following the procedures described in Appendix A of Su et al. (2015), for a synthesized beam of at a position angle . An integrated line spectrum was derived by taking the integrated intensity (moment0) map and summing over all pixels known to contain flux, as described in Section 3 of Alatalo et al. (2013). The bandwidth over which we measured the line flux is 250 MHz ( 780 km s-1). Upon creating the cube, we measure a 1 root mean square noise of 4.48 mJy beam-1 in 20 km s-1 channels. Integrating over all channels with line emission (spanning in velocity), we obtained a spatially unresolved detection of line emission at an RA and DEC of =20:29:55.495 =+01:20:58.944 (J2000). This is shown in Figure 1. We also attempted to detect 95 GHz continuum by integrating over 7.25 GHz of line-free channels, resulting in a 3 upper limit of 0.64 mJy beam-1.
2.4. Southern African Large Telescope
The CARMA position of ACT J2029 revealed an apparent optical counterpart for the DSFG at =20:29:55.479 =+01:20:58.610, 2MASX J20295548+0120580, for which optical spectroscopy at the Southern African Large Telescope (SALT; Buckley, Swart, & Meiring, 2006) was obtained. Longslit observations were carried out using the Robert Stobie Spectrograph (RSS, Burgh et al., 2003; Kobulnicky et al., 2003) under program 2014-1-RU_RSA-002 (PI: Hughes) on 2014 June 24. The PG0900 grating was used with two different grating angles (14∘ and 14.375∘) in order to cover the gaps between the camera’s CCD chips. The total exposure time was 1200 s, divided into two 300 s exposures at each grating setting to aid in removing cosmic rays. The wavelength coverage was 3800 Å-6900 Å and the delivered spectral resolution was 950 at the central wavelength given the 1.5′′ wide slit used. Stellar images on the acquisition frame were 2.2′′ (FHWM) in size.
The data were reduced using the SALT science pipeline (Crawford et al., 2010), and subsequent processing was carried out using IRAF111 IRAF is distributed by the National Optical Astronomy Observatory, which is operated by the Association of Universities for Research in Astronomy (AURA) under cooperative agreement with the National Science Foundation. tasks. Cosmic rays were removed using L.A.Cosmic (van Dokkum, 2001). The 2D Argon arc-lamp images were used to determine the wavelength calibration as well as the transformation necessary to rectify (i.e., straighten out) the wavelength solution along the imaging direction. The accuracy of the wavelength solution on the arc images was better than 0.5 Å. The wavelength solutions of the extracted galaxy spectra were verified to be better than 20 km s-1 by checking the wavelengths of the prominent night sky lines at 5577 Å and 6300 Å.
The IRAF task rvsao was used to obtain the redshift of the galaxy by cross-correlation with several SDSS galaxy spectral templates. Spectra from each grating setting were run through the task separately. Each case returned a strong signal (R-value 6) for an elliptical galaxy template with consistent redshift values. Redshifts were verified by visual inspection of the spectra using absorption features from Ca II H and K, the G-band, and Mg I 5172.7. No emission lines were present. Combining the results from the two grating settings yielded a spectroscopic redshift of for 2MASX J20295548+0120580.
ACT J2029 and 2MASX J20295548+0120580 were also observed with the Near-Infrared Camera/Fabry–Pérot Spectrometer (NICFPS) instrument on the ARC 3.5 m telescope at the Apache Point Observatory (Vincent et al., 2003) with a -band ( m) detection limit of mag. The data were reduced as described in Section 2.3 of Menanteau et al. (2013). We use this photometry in our SED-fitting of the system, presented in Section §4.2.
2.5. Pan-STARRS
In order to constrain the nature of the lensed system, we also make use of images from the Panoramic Survey Telescope and Rapid Response System (Pan-STARRS) Data Release 1 (DR1; Chambers et al. 2016), which became public on 2016 December 19. The filters reach 5 depths of 23.3, 23.2, 23.1, 22.3, 21.3 mag, respectively. An -band image of the system is shown in Figure 1, with a color image located in the upper right inset. Our CARMA data are also overlaid on the -band image. A Sérsic profile fit to the image reveals slight excess emission to the northeast and southwest of the elliptical galaxy (see Appendix A), suggestive of a background lensed galaxy. The color inset image in Figure 1 appears to support this suggestion.
2.6. IRAM 30m
The IRAM 30m observations of ACT J2029 were carried out as part of the 2015 IRAM Summer School, over the nights of 2015 September 13 and 15 using the Eight MIxer Receiver (EMIR, Carter et al., 2012) mounted on the telescope. EMIR has four different bands, E090, E150, E230, and E330, spanning the 3, 2, 1, and 0.9 mm windows respectively. Each band provides GHz of instantaneous, dual-polarization bandwidth.
The data were recorded using the Wideband Line Multiple Autocorrelator (WILMA), which provides a spectral resolution of 2 MHz, corresponding to velocity resolutions of , 3, and 2 km s-1 for the E090, E150, and E230 bands, respectively. Dual-frequency EMIR setups were used throughout the observations. We employed E090/E150 (3/2 mm) and E090/E230 (3/1 mm) configurations to search for CO transitions. In these configurations, each receiver has a bandwidth of 4 GHz. The 3 mm receiver was used as a reference and tuned to the previously detected 95 GHz CO transition, while the 2 mm receiver was tuned to 142.5 GHz and 158 GHz, and the 1 mm receiver to 221 GHz and 253 GHz. Additional lines of high-density gas tracers CS(7–6), HCN(4–3), and HCO+(4–3) were targeted with the Fast Fourier Transform Spectrometer (FTS). The FTS backend has a spectral resolution of 195 kHz, corresponding to km s-1 for the E090 band. E090/E230 (3/1 mm) EMIR configurations were repeated with a slightly shifted 3 mm tuning at 97 GHz to better center on the dense gas tracers, and 1 mm frequency tunings at 97 GHz and 221/253 GHz, respectively.
The observations were carried out in wobbler switching mode, with a switching frequency of 1.5 Hz. Pointing was checked frequently and was found to be stable within 3”. The calibration was done every 12 minutes using standard hot/cold-load absorber measurements. The data reduction was performed using the GILDAS software’s class package. Scans with distorted baselines were excluded from the dataset (22%), while scans showing platforming (i.e., steep baseline jumps arising in the backend electronics) were corrected for this effect and included. Linear baselines were subtracted from the individual spectra, except for the C i /CO(7–6) spectrum, for which we fit a first, third and fourth order polynomial (see Section §3.2 for reasons).
3. Results
3.1. The redshift of ACT J2029
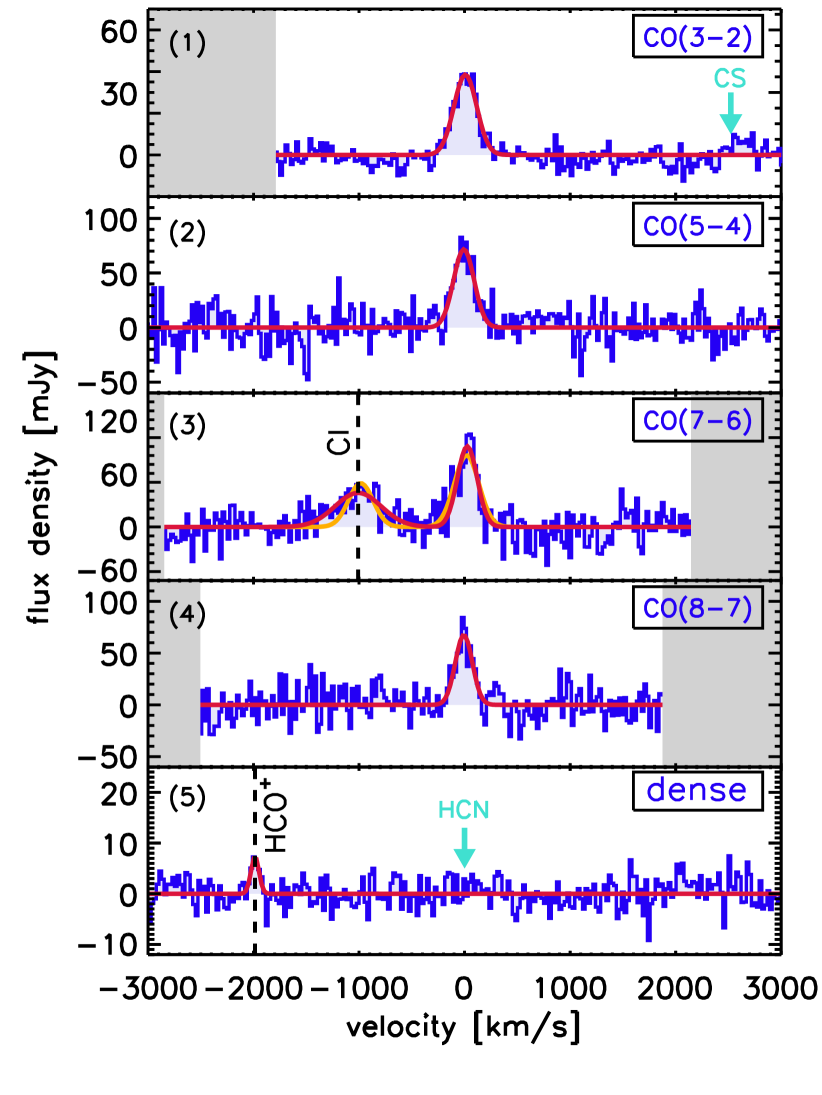
For our IRAM 30m observations we adopted an observing strategy similar to that developed by Weiß et al. (2009) to determine the redshift of the object. The 3/2 mm setup was tuned to 95/142 GHz to confirm and improve the line shape of the 95 GHz feature and to test for redshifts = 1.43 and = 3.85, resulting in a non-detection at 142 GHz. Subsequently, the 2 mm band was tuned to 158 GHz, where a second line was detected at 158.3 GHz. This uniquely identifies the 95.0 and 158.3 GHz line features as CO(3–2) and CO(5–4) at a redshift = 2.64. CO(7–6) and CO(8–7) lines at 221.6 and 253.2 GHz were also detected using the 3/1 mm (95/221 GHz) and 3/1 mm (95/253 GHz) setups, respectively. A redshift of = 2.640020.00006 was derived by combining the centroids of all the CO lines using a variance-weighted average. All four CO line profiles are very similar and well described by single Gaussian components, as shown in Figure 2. Their line parameters are presented in Table 1. The uncertainties associated with the integrated intensities are derived from the uncertainties in the free parameters of the Gaussian fits.
3.2. Line properties
C i() was detected in conjunction with CO(7–6) at 222 GHz using the EMIR 3/1 mm (95/221 GHz) setup with the WILMA backend and applying a linear baseline correction. Like the CO line profiles, the C i line profile is well described by a single Gaussian component, but with a FWHM that is more than double the CO line widths.
In an attempt to constrain the robustness of the potentially larger FWHM, we employed a Monte Carlo approach to randomly select only 50% and 75% of the scans, subtract the baseline with a first order polynomial, and fit single Gaussians to the C i and CO(7–6) lines. This process was repeated five times for each percentile. In all cases, the line width of the C i profile remained extended relative to the CO(7–6). Additionally, we re-fit the profiles from the full data set using velocity bins ranging from 3 to 55 km s-1. We find that the maximum variation from the determined C i line width across all velocity bins is 67.4 km s-1 ( 5%), and from the measured peak flux density is 0.3 mJy (<1%). Finally, we tested subtraction of third and fourth order polynomial baselines before fitting a single Gaussian component to the C i profile. This was repeated for four random sets of 75% of the data, as well as for the full data set; all ten fits returned a C i width larger than that of the CO lines. Therefore, the line width and flux determinations appear robust, suggesting real broadening of the C i line compared to the CO lines. Nevertheless, the larger C i FWHM may be due to baseline effects and we caution that independent confirmation of the broadening is required for absolute certainty. The implications of a wider line profile of C i with respect to CO is discussed in Section §4.3. The profile of the C i line is also very well fit by several two-component Gaussian fits, with a blueshifted component offset by 100-400 km from a systemic component. The reduced of every two-component fit varies by less than 0.01 relative to other two-component fits, and is always 0.001 lower compared to the single-Gaussian fit. Therefore, we argue a two-component Gaussian fit is not sufficiently justified to replace a single Gaussian fit.
We also report a tentative detection of the HCO+(4–3) line at 98 GHz in the 3 mm band using the FTS backend, with an integrated S/N ratio of 3.46. The line is well described by a single Gaussian profile, whose parameters are presented in Table 1. The line appears to be blueshifted with respect to the systemic (CO) redshift by more than 100 km s-1, and also has a much narrower width than any of the CO transitions. Using Monte Carlo simulations that account for the peak flux of the HCO+ line and the noise in our spectra, we find that in 10,000 random samples the probabilities of obtaining such a velocity offset and smaller line width with respect to our CO observations are less than 0.1% and 0.01%, respectively. Due to the low S/N ratio, however, it is difficult to draw robust conclusions, so we do not include this line in our analysis. From our observations, we also place strong upper limits on the emission of the HCN(4–3) and CS(7–6) lines, by requiring that line widths be similar to that of the CO emission lines and calculating integrated intensities. Limits on fluxes and luminosities are provided in Table 1.
| Line | [GHz] | FWHM [km/s]**All uncertainties are quoted at the 1 level and all values are uncorrected for lensing. Upper limits are robust to 3. | [mJy]**All uncertainties are quoted at the 1 level and all values are uncorrected for lensing. Upper limits are robust to 3. | I [Jy km/s]**All uncertainties are quoted at the 1 level and all values are uncorrected for lensing. Upper limits are robust to 3. | L′ [x1010 K km s-1 pc2]**All uncertainties are quoted at the 1 level and all values are uncorrected for lensing. Upper limits are robust to 3. | Integration time [s] | EMIR Setup |
|---|---|---|---|---|---|---|---|
| CO(3–2) | 94.997(2) | 270.1 14.8 | 39.7 2.8 | 11.3 0.5 | 41.8 1.9 | 9900 | E090 |
| CO(5–4) | 158.321(5) | 229.3 25.2 | 71.7 10.2 | 17.4 1.5 | 23.1 2.1 | 2820 | E150 |
| CO(7–6) | 221.59(2) | 231.3 27.7 | 87.5 13.1 | 21.4 1.9 | 14.5 1.3 | 7620 | E230 |
| CO(8–7) | 253.25(9) | 190.9 22.7 | 72.8 11.6 | 14.7 1.5 | 7.6 0.8 | 7140 | E230 |
| C i (2–1) | 222.4(7) | 590.5 98.8 | 37.6 7.9bbThe peak flux density derived with the line width fixed to that of the CO(7–6) line is =51.5 5.77 mJy. | 23.5 3.0 | 15.8 2.0 | 7620 | E230 |
| CS(7–6) | 94.198aaExpected redshifted frequency of the line, assuming = 2.64002 0.00006. | – | 24600 | E090 | |||
| HCN(4–3) | 97.392aaExpected redshifted frequency of the line, assuming = 2.64002 0.00006. | – | 24600 | E090 | |||
| HCO+(4–3) | 98.004aaExpected redshifted frequency of the line, assuming = 2.64002 0.00006. | 94.2 25.6 | 7.6 2.8 | 0.7 0.2 | 2.6 0.7 | 24600 | E090 |
As shown by Solomon et al. (1992), line luminosity can be expressed in terms of total line flux as:
| (1) |
where is the velocity integrated flux in Jy km s-1, is the luminosity distance in Mpc, and is the observed central frequency of the line in GHz. The luminosities of all detected lines are derived using Eq. 1 and are listed in Table 1, along with all other line properties.
4. Discussion
The observations described above make it possible to characterize the molecular gas in ACT J2029 in an unusual level of detail — a useful opportunity given continuing uncertainties in exactly how DSFGs contribute to the cosmic histories of star formation and black hole accretion. We therefore proceed below to use the new data to assess the origin of ACT J2029’s molecular excitation, determine whether it is a strongly lensed system, and interpret the anomalous ratios of its CO and C i line widths and fluxes in light of our conclusions on those two points.
4.1. CO SLED indicative of an AGN
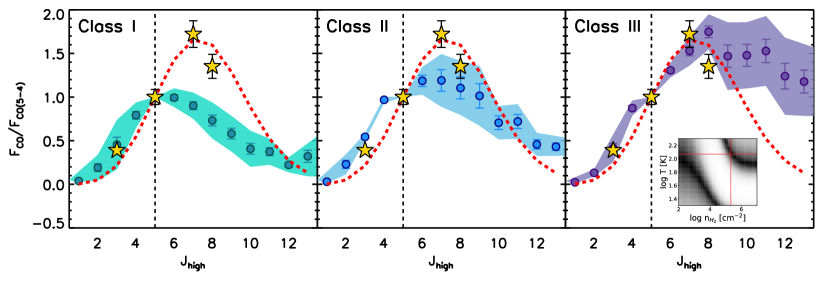
Figure 3 shows the 12CO spectral line energy distribution (SLED) constructed with our observations, which peaks at the =7–6 transition. In the same plot, we compare our detections to the starbursts, ULIRGs, and AGN hosts that were observed as part of the Herschel Comprehensive ULIRG Emission Survey (HerCULES; PI: van der Werf) by Rosenberg et al. (2015), normalized to the CO(5–4) line. It becomes immediately clear that ACT J2029 is most consistent with the Class III objects from Rosenberg et al. (2015), which are mainly AGN hosts, although the observed CO transitions alone cannot definitively rule out a match to the Class II objects. The CO consistency with the Class II and Class III objects suggests that the dense molecular gas in this source is exposed to the harsh radiation field of a central AGN (van der Werf et al., 2010; Rosenberg et al., 2015; Israel et al., 2015).
In order to better characterize ACT J2029, we used the non-local thermal equilibrium code RADEX (van der Tak et al., 2007) to model the emitted CO intensities. A large parameter grid, K, cm-3, and v = 10 cm-2 (km s-1)-1 (assuming v=10 kms-1), was sampled, where is the kinetic temperature, /v the column density per unit velocity gradient of CO, and the molecular gas number density. The best reproduction of the observed CO intensities is given by the parameters K, cm-3, and v = 3 1018 cm-2 (km s-1)-1. This result is also consistent up to =8–7 with the Class II and Class III objects from the Rosenberg et al. (2015) sample, but is inconsistent with the Class I objects: the fit agrees well with our data up to the =8–7 transition, however it drops rapidly at higher-. This is likely due to the use of single-component gas fits in our RADEX models, which are sufficient to trace the lower= transitions but insufficient to accurately trace the higher- transitions. More sophisticated modelling of the higher- transitions would likely require multiple-component gas fits and additional data. The best-fit model is highlighted as a dashed red line in Figure 3. It is important to note, however, that other similar fitting models exist due to degeneracies between and . A probability density plot of the sampled models is shown as an inset plot in Figure 3.
Several CO SLEDs with similar shapes have also been observed in shocked systems such as the central nuclear region of Centaurus A (Israel et al., 2014) and the shocked AGN-driven molecular outflow in NGC 1266 (Alatalo et al., 2011; Pellegrini et al., 2013; Glenn et al., 2015). In both cases, the CO SLED rises and peaks around CO(7–6), then decreases at higher-. Such a pattern is also seen in both AGN hosts and shock hosts, however the transitions we have detected in ACT J2029 do not allow us to differentiate between these possibilities. In each of the first two shock-dominated sources noted above, an AGN is also present, mechanically or radiatively driving an outflow, which in turn produces the shocked line ratios in the CO SLED.
Bothwell et al. (2013b) and Spilker et al. (2014) derive average DSFG CO SLEDs that look broadly similar to the SLED for ACT J2029; however, they have slightly shallower slopes (below their peak ) and less pronounced “knees.” In contrast, the CO SLED of Cloverleaf (Bothwell et al., 2013a), a well-known AGN host, has a slope and knee that are in much better agreement with those of ACT J2029. The review by Casey et al. (2014) on high- DSFGs characterizes the prevalence of AGN hosts among SMGs as high, but not universal, with 1/3 of sources showing signs solely of prolific star formation, and 2/3 requiring AGN. Therefore, an additional possibility exists to explain the shape of ACT J2029’s CO SLED and, although no radio or X-ray detections of ACT J2029 exist, the CO SLED is suggestive of the source hosting an AGN. However, a definitive confirmation of the presence of an AGN will require higher resolution, deeper observations to characterize delensed morphology, or detections of X-rays or radio (jet/lobe) emission.
To assess whether ACT J2029 resembles the high- main sequence of star-forming galaxies, we compare its CO SLED to those of other star-forming objects in the literature. Using CO SLEDs from 4 BzK galaxies to obtain an average CO SLED from CO(1–0), CO(2–1), CO(3–2) and CO(5–4) transitions, Daddi et al. (2015) compare a BzK CO SLED to average CO SLEDs for local (U)LIRGs, SMGs and the inner disk of the Milky Way. Their results suggest ACT J2029 has a CO SLED very similar in shape to those of BzKs and SMGs up to the CO(5–4) transition. However, such a comparison extends only to CO(5–-4) whereas the “knee” of our data occurs at CO(7-–6), making it difficult to compare high- transitions where the nature of the excitation is likely to be determined.
4.2. Lensing status and SED fitting
As seen in Section §2, discrepant CO and optical redshifts are highly suggestive of gravitational lensing. With a secure DSFG redshift in hand, we are now in a position to quantify the lensing magnification. Although no lens model is available for our source, Harris et al. (2012) showed for a sample of star-forming galaxies that estimation of the lens magnification is possible using the line width and luminosity of the CO(1–0) transition (see also Bothwell et al. 2013a, Goto & Toft 2015; cf. Aravena et al. 2016, Sharon et al. 2016). Assuming a CO(3–2)/CO(1–0) luminosity ratio of 0.90.4 (Sharon et al., 2016) and a CO(1–0)/CO(3–2) line width ratio of 1.150.06 (Ivison et al., 2011) for ACT J2029, we estimate a lens magnification =2511 using Equation 1 of Harris et al. (2012). Although a lens model is clearly needed to fully confirm any magnification and there is substantial uncertainty in our derived value, it becomes immediately clear that ACT J2029 is likely lensed.222 We note that a CO(1–0) line width larger than that of CO(3–2) (e.g., as seen by Ivison et al. 2011 for a small SMG sample) would lead to a lower magnification estimate.
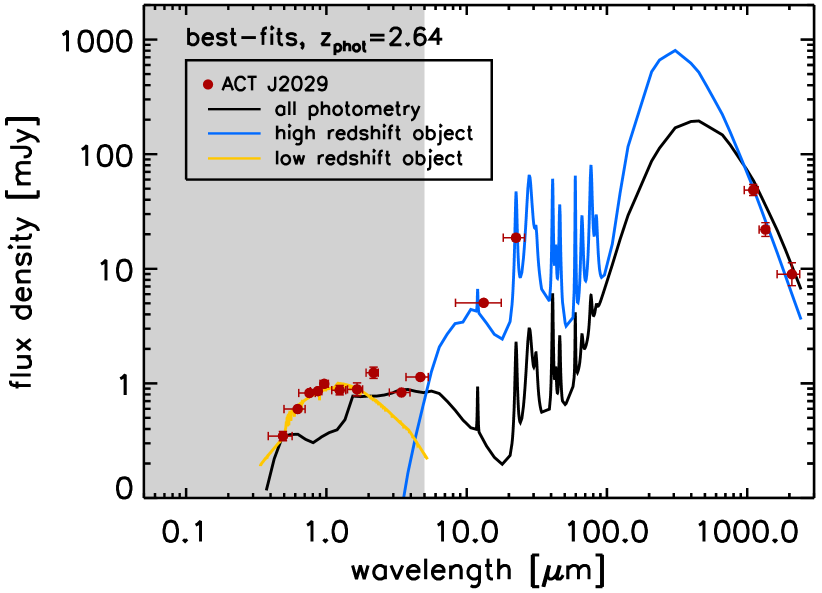
We also make use of Pan-STARRS (Chambers et al., 2016) filters, 2MASS (Skrutskie et al., 2006) J- and H-band, NICFPS Ks-band, all WISE (Wright et al., 2010) bands, and our ACT photometry to fit an SED to ACT J2029, using the Hyperz code developed by Bolzonella et al. (2000). The optical photometry was obtained by using the SExtractor (Bertin & Arnouts, 1996) software in dual-image mode on each of the Pan-STARRS images, whilst the NIR photometry was taken from the 2MASS and WISE All-Sky Data Releases, respectively. We run Hyperz with the standard library templates, which include nebular emission lines (Coleman et al., 1980; Kinney et al., 1996; Fioc & Rocca-Volmerange, 1997; Silva et al., 1998; Chary & Elbaz, 2001; Bruzual & Charlot, 2003; Polletta et al., 2007; Michałowski et al., 2010), a fixed photometric redshift of = 2.64 to match our derived spectroscopic redshift, and a dust column with A [0.0-3.0] mag following either a Calzetti et al. (2000) starburst or a Prevot et al. (1984) Small Magellanic Cloud extinction law. Each template has been fit (by itself) to our data twice, once with the Calzetti et al. (2000) law and once with the Prevot et al. (1984) law. We first use all of our SED constraints and conclude that none of the templates we used can correctly reproduce the photometry of ACT J2029. However, as discussed in the previous section, the most likely hypothesis for our object is that it is lensed by a foreground galaxy at = 0.3242, and therefore the photometry at shorter wavelengths, namely shortward of the WISE W3 band, is contaminated by the foreground galaxy. If we use only WISE W3, W4 and ACT photometric constraints while setting upper limits to all photometry blueward of 1m, we find a better fit with reduced 1.63. We also fit a low-redshift SED using only upper limits on all photometry blueward of 1m and a fixed redshift of = 0.32. The derived SEDs are presented in Figure 4. It becomes obvious that the optical data are well fit by the low-redshift object, while the WISE W3 and W4 bands are elevated and likely contaminated by both objects. We conclude that the elevated WISE points suggest that the NIR fluxes are indeed contaminated by the foreground source, 2MASX J20295548+0120580, making it impossible to derive a robust SED fit from which one can estimate global properties for ACT J2029. Accurate modeling of the contaminating fluxes would likely require higher-resolution photometry to fully characterize the low-redshift foreground galaxy.
4.3. The enhanced C i flux and velocity
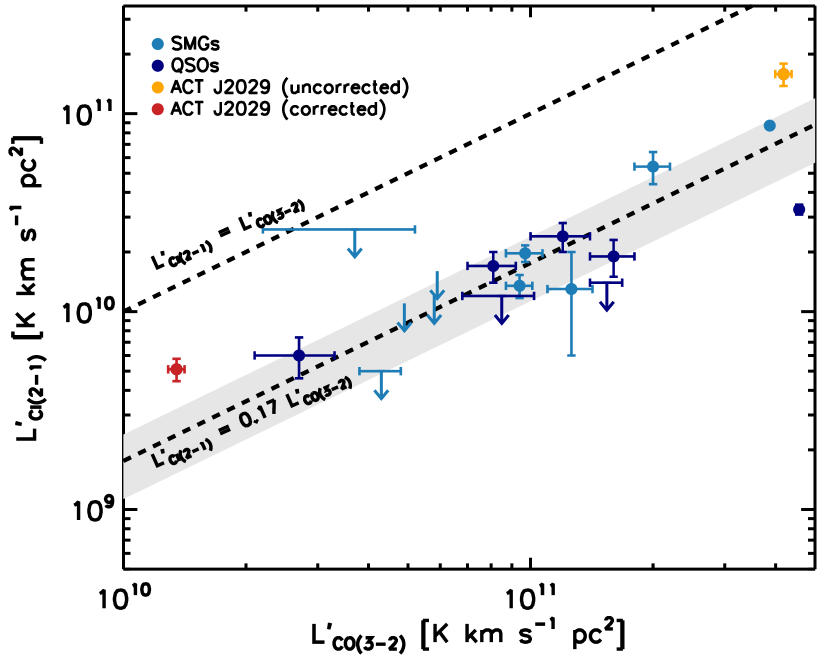
The mean value of the C i (2–1)/CO(3–2) luminosity ratios in Walter et al. (2011) shows that in most SMGs the C i (2–1) line has a luminosity , consistent for both galaxies that host quasars and those that do not. ACT J2029 shows an excess of C i (2–1) emission compared to CO(3–2), with , twice the mean value for other high-redshift sources. This excess is significant at greater than a 2 level and is shown in Figure 5, which we compare to the lensed and unlensed objects presented in Walter et al. (2011).
Most local and high- sources do not show substantial C i flux enhancements (Walter et al., 2011; Alaghband-Zadeh et al., 2013; Israel et al., 2015), but there are some marked exceptions. Pellegrini et al. (2013) show that the local AGN-driven molecular outflow host NGC 1266 displays enhanced C i emission compared to 12CO, as does the nuclear region of Centaurus A (Israel et al., 2014). In both cases, it is argued that the enhanced C i emission is due to the shocked gas chemistry in the nuclear regions where the line emission originates (in both cases, this scenario is supported by the CO SLED). ACT J2029 could be a similar Class III object hosting an AGN in its center, with shocked dense gas contributing to an enhanced C i/CO line ratio.
The difference in the C i and CO linewidths of ACT J2029 is also unusual. In all objects where resolved velocity information is available for both C i and CO, the linewidths of the two lines are consistent (Walter et al. 2011, and references therein). In Section §3.2, we showed that the C i (2–1) line is more than twice as wide as the CO lines, suggesting that the source of the C i and CO emission cannot be identical.
If we combine the large linewidth difference with the enhanced C i , an intriguing possibility suggests itself, namely, that we are observing differential lensing of a compact nuclear region of this source, which hosts an AGN-driven molecular outflow. Lensing preferentially enhances compact regions (Hezaveh et al., 2012), so it is possible that the foreground lens (2MASX J20295548+0120580) has magnified the nuclear region of ACT J2029, including outflowing gas traced by C i and CO. Rawle et al. (2014) used the Submillimeter Array and the Karl G. Jansky Very Large Array to map the molecular lines of HLS0918, a lensed submillimeter galaxy at = 5.2430. In this case, they were able to spatially differentiate multiple velocity components in the molecular gas, including a very broad (VB) component consistent with an outflowing region. Rawle et al. (2014) show that the ratio of C i (2–1)/CO(7–6) in the VB component is larger than those seen in all other regions, suggestive of enhanced C i (although the velocity structures in HLS0918 are complex, such that degeneracies arise when fitting the components in the blended C i and CO(7–6) lines). It is possible that ACT J2029 exhibits a similar CI-enhanced outflow region, while lacking the complex velocity structures that are observed in the Rawle et al. (2014) source.
5. Conclusions
This work presents multi-transition 12CO and C i (2–1) measurements of ACT J2029, a lensed sub-millimeter galaxy found by the ACT survey. Following up on earlier line detections by the LMT and CARMA, we confirm a source redshift of = 2.640. To summarize our work:
-
•
The CO(3–2), CO(5–4), CO(7–6), CO(8–7), and C i (2–1) transitions are detected at high significance, but only upper limits on the emission of the high-density gas tracers CS(7–6) and HCN(4–3) are obtained. Additionally, we also report a tentative detection of the HCO+(4–3) line.
-
•
We confirm a redshift of = 2.64 for ACT J2029, based on IRAM 30m observations of multiple CO lines.
-
•
We construct a CO SLED starting from the four detected CO transitions. Based on a comparison with the star-forming, star-bursting, and AGN-hosts from the HerCULES survey, the CO SLED of ACT J2029 is consistent with a Class II or Class III object, i.e., with a starburst, ULIRG, or powerful AGN host.
-
•
Non-LTE modeling suggests that ACT J2029 is more consistent with a Class III AGN host object, characterized by a K, cm-3, and v = 3 1018 cm-2 (km s-1)-1 modulo non-trivial parameter degeneracies.
-
•
We provide convincing evidence to support the lensing status of ACT J2029 by (i) spectroscopically confirming the redshift of a foreground source inconsistent with that of ACT J2029, and whose position lies less than 0.5” away, and (ii) estimating a magnification factor of 25 for ACT J2029 via the fiducial relation of Harris et al. (2012).
-
•
The velocity width of the C i line appears to be substantially larger than what is seen in all CO transitions, and the ratio appears to be larger than what is typically seen in lensed and un-lensed SMGs and QSO hosts. The latter discrepancy would be in agreement with what has been observed in shocked systems, such as Centaurus A and NGC 1266. If confirmed, the large C i width and enhanced C i emission could be explained by differential lensing, in which a shocked, centrally concentrated outflow (traced by the enhanced C i) has been preferentially magnified compared to the larger scale molecular gas (traced by CO).
References
- Alaghband-Zadeh et al. (2013) Alaghband-Zadeh, S., Chapman, S. C., Swinbank, A. M., et al. 2013, MNRAS, 435, 1493
- Alatalo et al. (2011) Alatalo, K., Blitz, L., Young, L. M., et al. 2011, ApJ, 735, 88
- Alatalo et al. (2013) Alatalo, K., Davis, T. A., Bureau, M., et al. 2013, MNRAS, 432, 1796
- Aravena et al. (2016) Aravena, M., Spilker, J. S., Bethermin, M., et al. 2016, MNRAS, 457, 4406
- Barger et al. (1998) Barger, A. J., Cowie, L. L., Sanders, D. B., et al. 1998, Nature, 394, 248
- Bertin & Arnouts (1996) Bertin, E., & Arnouts, S. 1996, A&AS, 117, 393
- Blain et al. (2002) Blain, A. W., Smail, I., Ivison, R. J., Kneib, J.-P., & Frayer, D. T. 2002, Phys. Rep., 369, 111
- Bolzonella et al. (2000) Bolzonella, M., Miralles, J.-M., & Pelló, R. 2000, A&A, 363, 476
- Bothwell et al. (2013a) Bothwell, M. S., Aguirre, J. E., Chapman, S. C., et al. 2013, ApJ, 779, 67
- Bothwell et al. (2013b) Bothwell, M. S., Smail, I., Chapman, S. C., et al. 2013, MNRAS, 429, 3047
- Brammer et al. (2008) Brammer, G. B., van Dokkum, P. G., & Coppi, P. 2008, ApJ, 686, 1503-1513
- Bruzual & Charlot (2003) Bruzual, G., & Charlot, S. 2003, MNRAS, 344, 1000
- Buckley, Swart, & Meiring (2006) Buckley, D. A. H., Swart, G. P., & Meiring, J. G. 2006, Proc. SPIE, 6267, 62670Z
- Burgh et al. (2003) Burgh, E. B., Nordsieck, K. H., Kobulnicky, H. A., Williams, T. B., O’Donoghue, D., Smith, M. P., & Percival, J. W. 2003, Proc. SPIE, 4841, 1463
- Calzetti et al. (2000) Calzetti, D., Armus, L., Bohlin, R. C., et al. 2000, ApJ, 533, 682
- Carter et al. (2012) Carter, M., Lazareff, B., Maier, D., et al. 2012, A&A, 538, A89
- Casey et al. (2012a) Casey, C. M., Berta, S., Béthermin, M., et al. 2012, ApJ, 761, 139
- Casey et al. (2012b) Casey, C. M., Berta, S., Béthermin, M., et al. 2012, ApJ, 761, 140
- Casey et al. (2014) Casey, C. M., Narayanan, D., & Cooray, A. 2014, Phys. Rep., 541, 45
- Chambers et al. (2016) Chambers, K. C., Magnier, E. A., Metcalfe, N., et al. 2016, arXiv:1612.05560
- Chapman et al. (2005) Chapman, S. C., Blain, A. W., Smail, I., & Ivison, R. J. 2005, ApJ, 622, 772
- Chary & Elbaz (2001) Chary, R., & Elbaz, D. 2001, ApJ, 556, 562
- Coleman et al. (1980) Coleman, G. D., Wu, C.-C., & Weedman, D. W. 1980, ApJS, 43, 393
- Crawford et al. (2010) Crawford, S. M., Still, M., Schellart, P., Balona, L., Buckley, D. A. H., Dugmore, G., Gulbis, A. A. S., Kniazev, A., Kotze, M., Loaring, N., Nordsieck, K. H., Pickering, T. E., Potter, S., Romero Colmenero, E., Vaisanen, P., Williams, T., & Zietsman, E. 2010, Proc. SPIE, 7737, 773725
- Daddi et al. (2015) Daddi, E., Dannerbauer, H., Liu, D., et al. 2015, A&A, 577, A46
- Danielson et al. (2011) Danielson, A. L. R., Swinbank, A. M., Smail, I., et al. 2011, MNRAS, 410, 1687
- Erickson et al. (2007) Erickson, N., Narayanan, G., Goeller, R., & Grosslein, R. 2007, From Z-Machines to ALMA: (Sub)Millimeter Spectroscopy of Galaxies, 375, 71
- Fioc & Rocca-Volmerange (1997) Fioc, M., & Rocca-Volmerange, B. 1997, A&A, 326, 950
- Glenn et al. (2015) Glenn, J., Rangwala, N., Maloney, P. R., & Kamenetzky, J. R. 2015, ApJ, 800, 105
- Goto & Toft (2015) Goto, T., & Toft, S. 2015, A&A, 579, A17
- Harris et al. (2010) Harris, A. I., Baker, A. J., Zonak, S. G., et al. 2010, ApJ, 723, 1139
- Harris et al. (2012) Harris, A. I., Baker, A. J., Frayer, D. T., et al. 2012, ApJ, 752, 152
- Hezaveh et al. (2012) Hezaveh, Y. D., Marrone, D. P., & Holder, G. P. 2012, ApJ, 761, 20
- Hodge et al. (2012) Hodge, J. A., Carilli, C. L., Walter, F., et al. 2012, ApJ, 760, 11
- Hughes et al. (1998) Hughes, D. H., Serjeant, S., Dunlop, J., et al. 1998, Nature, 394, 241
- Israel et al. (2014) Israel, F. P., Güsten, R., Meijerink, R., et al. 2014, A&A, 562, A96
- Israel et al. (2015) Israel, F. P., Rosenberg, M. J. F., & van der Werf, P. 2015, A&A, 578, A95
- Ivison et al. (2011) Ivison, R. J., Papadopoulos, P. P., Smail, I., et al. 2011, MNRAS, 412, 1913
- Kinney et al. (1996) Kinney, A. L., Calzetti, D., Bohlin, R. C., et al. 1996, ApJ, 467, 38
- Kobulnicky et al. (2003) Kobulnicky, H. A., Nordsieck, K. H., Burgh, E. B., Smith, M. P., Percival, J. W., Williams, T. B., & O’Donoghue, D. 2003, Proc. SPIE, 4841, 1634
- Madau & Dickinson (2014) Madau, P., & Dickinson, M. 2014, ARA&A, 52, 415
- Magnelli et al. (2011) Magnelli, B., Elbaz, D., Chary, R. R., et al. 2011, A&A, 528, A35
- Magnelli et al. (2013) Magnelli, B., Popesso, P., Berta, S., et al. 2013, A&A, 553, A132
- Marsden et al. (2014) Marsden, D., Gralla, M., Marriage, T. A., et al. 2014, MNRAS, 439, 1556
- Menanteau et al. (2013) Menanteau, F., Sifón, C., Barrientos, L. F., et al. 2013, ApJ, 765, 67
- Michałowski et al. (2010) Michałowski, M., Hjorth, J., & Watson, D. 2010, A&A, 514, A67
- Murphy et al. (2011) Murphy, E. J., Chary, R.-R., Dickinson, M., et al. 2011, ApJ, 732, 126
- Oke & Gunn (1983) Oke, J. B., & Gunn, J. E. 1983, ApJ, 266, 713
- Pellegrini et al. (2013) Pellegrini, E. W., Smith, J. D., Wolfire, M. G., et al. 2013, ApJ, 779, L19
- Peng et al. (2002) Peng, C. Y., Ho, L. C., Impey, C. D., & Rix, H.-W. 2002, AJ, 124, 266
- Peng et al. (2010) Peng, C. Y., Ho, L. C., Impey, C. D., & Rix, H.-W. 2010, AJ, 139, 2097
- Polletta et al. (2007) Polletta, M., Tajer, M., Maraschi, L., et al. 2007, ApJ, 663, 81
- Prevot et al. (1984) Prevot, M. L., Lequeux, J., Prevot, L., Maurice, E., & Rocca-Volmerange, B. 1984, A&A, 132, 389
- Rawle et al. (2014) Rawle, T. D., Egami, E., Bussmann, R. S., et al. 2014, ApJ, 783, 59
- Rosenberg et al. (2015) Rosenberg, M. J. F., van der Werf, P. P., Aalto, S., et al. 2015, ApJ, 801, 72
- Sharon et al. (2016) Sharon, C. E., Riechers, D. A., Hodge, J., et al. 2016, ApJ, 827, 18
- Silva et al. (1998) Silva, L., Granato, G. L., Bressan, A., & Danese, L. 1998, ApJ, 509, 103
- Skrutskie et al. (2006) Skrutskie, M. F., Cutri, R. M., Stiening, R., et al. 2006, AJ, 131, 1163
- Smail et al. (1997) Smail, I., Ivison, R. J., & Blain, A. W. 1997, ApJ, 490, L5
- Solomon et al. (1992) Solomon, P. M., Downes, D., & Radford, S. J. E. 1992, ApJ, 398, L29
- Spergel et al. (2007) Spergel, D. N., Bean, R., Doré, O., et al. 2007, ApJS, 170, 377
- Spilker et al. (2014) Spilker, J. S., Marrone, D. P., Aguirre, J. E., et al. 2014, ApJ, 785, 149
- Strandet et al. (2016) Strandet, M. L., Weiss, A., Vieira, J. D., et al. 2016, ApJ, 822, 80
- Su et al. (2015) Su, T., Marriage, T. A., Asboth, V., et al. 2015, arXiv:1511.06770
- Swetz et al. (2011) Swetz, D. S., Ade, P. A. R., Amiri, M., et al. 2011, ApJS, 194, 41
- van der Tak et al. (2007) van der Tak F. F. S., Black J. H., Schöier F. L., Jansen D. J., van Dishoeck E. F., 2007, A&A, 468, 627
- van der Werf et al. (2010) van der Werf, P. P., Isaak, K. G., Meijerink, R., et al. 2010, A&A, 518, L42
- van Dokkum (2001) van Dokkum, P. G. 2001, PASP, 113, 1420
- Vieira et al. (2013) Vieira, J. D., Marrone, D. P., Chapman, S. C., et al. 2013, Nature, 495, 344
- Vincent et al. (2003) Vincent, M. B., Morse, J. A., Beland, S., et al. 2003, Proc. SPIE, 4841, 367
- Walter et al. (2011) Walter F., Weiß, A., Downes, D., Decarli, R., & Henkel, C. 2011, ApJ, 730, 18
- Weiß et al. (2009) Weiß A., Ivison, R. J., Downes, D., et al. 2009, ApJ, 705, L45
- Weiß et al. (2013) Weiß, A., De Breuck, C., Marrone, D. P., et al. 2013, ApJ, 767, 88
- Wright et al. (2010) Wright, E. L., Eisenhardt, P. R. M., Mainzer, A. K., et al. 2010, AJ, 140, 1868-1881
- Zavala et al. (2015) Zavala, J. A., Yun, M. S., Aretxaga, I., et al. 2015, MNRAS, 452, 1140
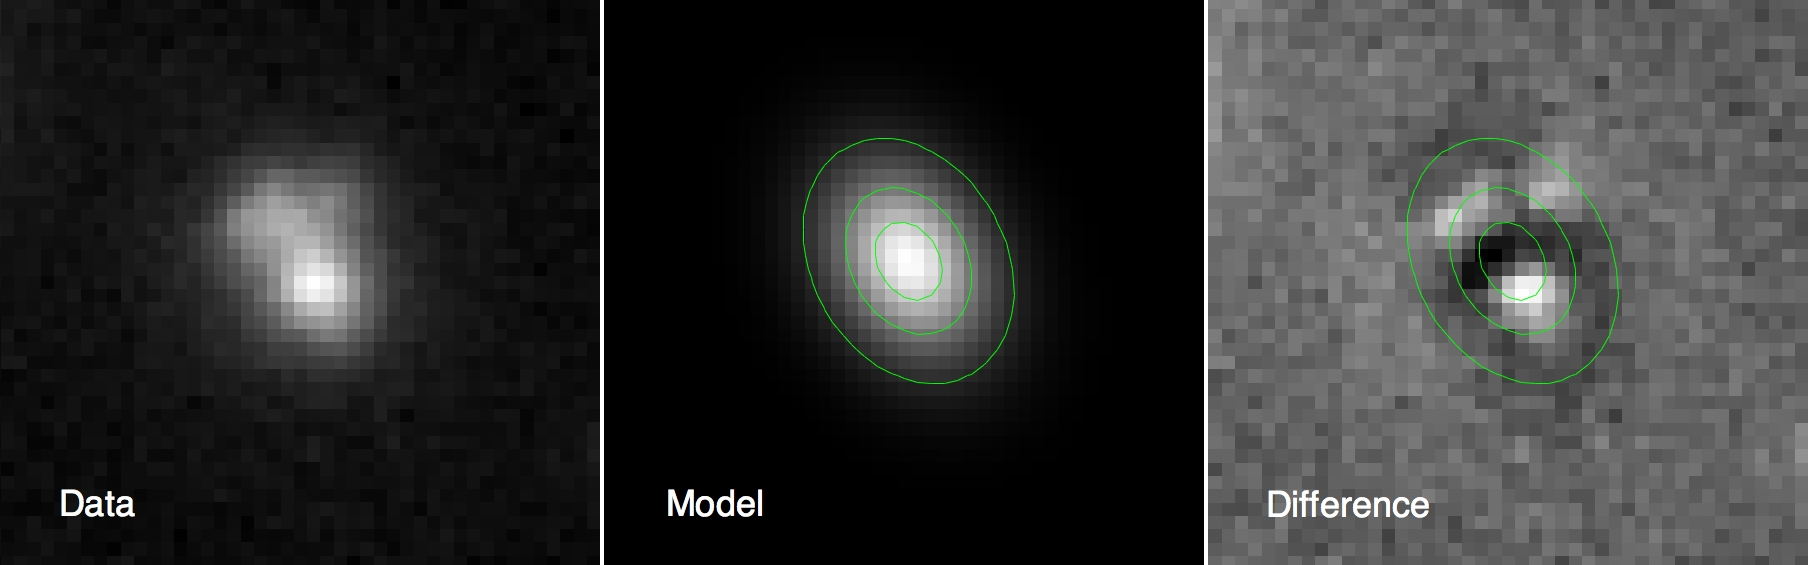
Appendix A NIR sersic fit and potential lens morphology
We used the two-dimensional profile fitting tool Galfit (Peng et al., 2002, 2010) to study the morphology of the lensing galaxy in the Pan-STARRS -band image. A single component, elliptical Sérsic profile provided a reasonable fit to the morphology resulting in an effective radius of , a Sérsic index of , and an axial ratio of at a position angle of . The small value of the Sérsic index indicates a fairly compact galaxy. The interesting feature of the fit is the pattern of residuals that appear in the difference image (data minus model) shown in Figure 6. There is an arc-like excess toward the north/northeast about from the fitted center of the galaxy and another, more compact, excess 0.4′′ southwest of the center. We estimate the summed intensity of these features to be at least one magnitude fainter than the lensing galaxy. These results are suggestive (but not definitive) of NIR emission from the background lensed galaxy. Higher resolution imaging will be needed to confirm this.