Measurement of low energy ionization signals from Compton scattering
in a CCD dark matter detector
Abstract
An important source of background in direct searches for low-mass dark matter particles are the energy deposits by small-angle scattering of environmental rays. We report detailed measurements of low-energy spectra from Compton scattering of rays in the bulk silicon of a charge-coupled device (CCD). Electron recoils produced by rays from 57Co and 241Am radioactive sources are measured between 60 eV and 4 keV. The observed spectra agree qualitatively with theoretical predictions, and characteristic spectral features associated with the atomic structure of the silicon target are accurately measured for the first time. A theoretically-motivated parametrization of the data that describes the Compton spectrum at low energies for any incident -ray flux is derived. The result is directly applicable to background estimations for low-mass dark matter direct-detection experiments based on silicon detectors, in particular for the DAMIC experiment down to its current energy threshold.
I Introduction
Solid-state ionization detectors have been proposed for next-generation direct searches for dark matter Aguilar-Arevalo et al. (2016); Agnese et al. (2017). Thanks to their very low noise and the small band gap of the semiconductor target, these detectors are most sensitive to low-mass (10 GeV/) dark matter particles by their interactions with nuclei Kolb and Turner (1990); *Griest:2000kj; *Zurek:2013wia or electrons Essig et al. (2016); *Hochberg:2016sqx; *Bloch:2016sjj in the target. At the low energies of interest for these searches, which correspond to ionization signals in the range 2–1000 , the dominant background from environmental radiation are the low-energy electron recoils from small-angle Compton scattering of external rays, whose flux is generally orders of magnitude higher than fast neutrons, the other possible external source of background in the bulk of the target in this energy range.
In the presence of an irreducible electron-recoil background from Compton scattering, a potential signal from interactions of dark matter particles can only be identified by its spectrum. Therefore, a complete understanding of the low-energy spectral features of the ionization signals from Compton scattering is required for the success of low-mass dark matter searches.
In this paper, we report the measured spectra from Compton scattering of rays above an energy of 60 eV, corresponding to ionization signals of 15 . The results were obtained by exposing a high-resistivity fully depleted CCD Holland et al. (2003) developed in the R&D efforts of DAMIC Aguilar-Arevalo et al. (2016, 2017) to rays from radioactive sources. The measurements are found to be in fair agreement with the theoretical expectation, and we derive an improved phenomenological parametrization that more accurately describes Compton spectra in the regime of atomic binding, which can be used to predict the background from Compton scattering of rays at low energies.
II Compton scattering
Compton scattering Compton (1923) is an electromagnetic process where an incident photon transfers some of its energy to an electron, and is then deflected from its original direction. For an interaction with a free electron at rest, the energy of a scattered photon () depends on the energy of the incident photon (), the mass of the electron () and the scattering angle () as
with the differential cross section given by the well-known Klein-Nishina formula Klein and Nishina (1929). The maximum energy transferred to the electron occurs when the ray backscatters, i.e., when , giving rise to a spectral feature known as the Compton edge.
The spectrum of energy deposited by a single -ray interaction in a target is a continuum from zero up to the Compton edge. However, the electrons in the target are bound in atomic shells with non-zero momentum, which lead to deviations from the Klein-Nishina formula and give rise to observable distortions in the spectrum, including the well-known softening or “Doppler broadening” of the Compton edge Du Mond (1929).
A straightforward modification of the Klein-Nishina formula for bound electrons is the Relativistic Impulse Approximation (IA) Ribberfors and Berggren (1982), where each electron in an atomic shell is treated as a free electron with a constrained momentum distribution derived from the bound-state wave function. For low energy and momentum transfers, the differential cross section for a photon scattering with an atomic electron with quantum numbers and reduces to
| (1) | ||||
The expression above is only valid for , the target electron’s binding energy. Otherwise, 0, as the minimum energy that the photon can lose in an interaction is that required to free the target electron from the atom. Here, we have introduced , which is 1 for the energies of interest, and grouped the constant terms in front of the expression as , where is the classical electron radius. The functions are the Compton profiles, which encode the momentum distribution of the target electron before the collision, and is the projection of the momentum of the electron on the scattering vector . The integral in Eq. 1 can only be evaluated numerically. Tabulated data for in units of 1/() for different elements (listed by atomic number ) can be found in Ref. Biggs et al. (1975).
Figure 1 shows the computed spectrum for a silicon target exposed to 122 keV rays, where we added over all atomic electrons. A series of steps are observed at low energies, corresponding to the atomic shells of the target, which arise from the condition that 0 for . At threshold, the freed electron has negligible kinetic energy and the energy deposited comes from the refilling of the atomic vacancy by the emission of secondary Auger electrons and fluorescence x rays. An approximate estimate of the slope of the spectrum between the steps can be obtained from the Klein-Nishina formula, whose solution for 1 reduces to .
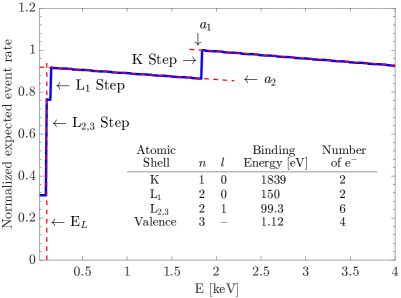
The experimental observation of these spectral features, which are of particular relevance to the understanding of the radioactive backgrounds for low-mass dark matter searches, has never before been reported in the literature.
III Experimental setup
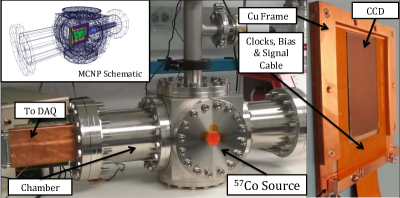
The setup used for this measurement is shown in Fig. 2. We employed an 8 Mpixel CCD (pixel size 1515 m2) with an active area of 18.8 cm2, a thickness of 500 m and a mass of 2.2 g. The response of this device to ionizing radiation has been previously characterized Chavarria et al. (2016). The CCD was installed in a stainless-steel vacuum chamber ( mbar) and cooled to a nominal operating temperature of 130 K. The voltage biases, clocks and video signals required for the CCD operation were serviced by a Kapton flex cable wire bonded to the CCD. The silicon substrate was fully depleted by an external bias, with no regions of partial or incomplete charge collection that may hinder the energy response of the device Aguilar-Arevalo et al. (2016); Holland et al. (2003). The CCD was controlled and read out by commercial CCD electronics (Astronomical Research Cameras, Inc.). The pixel noise achieved with this system was 1.860.02 , equivalent to 7.00.1 eV (on average, 3.8 eV are required to produce a free charge carrier in silicon at 130 K Ryan (1973)).
Compton-scattered electrons produce charge in the bulk of the device by ionization, with the number of charge carriers being proportional to the kinetic energy of the electron. The charge carriers are drifted along the direction of the electric field ( axis) and collected on the pixel array. Because of thermal motion, the ionized charge diffuses transversely with respect to the electric field direction as it is drifted, with a spatial variance () that is proportional to the carrier transit time. Hence, there is a positive correlation between the lateral diffusion () of the collected charge on the pixel array and the depth of the interaction () Aguilar-Arevalo et al. (2016); Karcher et al. (2003); *CeaseDiff.
The CCD images contain a two-dimensional (2D) stacked history (projected on the - plane) of all ionization produced throughout an exposure, where each image pixel value is proportional to the collected number of charge carriers. Data for this analysis were acquired in two modes: i) standard 11 binning, where each pixel was read out individually for maximum spatial resolution, and ii) 44 binning, where by the appropriate clocking of the device the charge collected in groups of 44 pixels was read out in a single measurement. Since readout noise is introduced only once on the larger charge signal given by the sum of the group of pixels, a better signal-to-noise ratio is obtained with 44 binning at the expense of a worsened spatial resolution. For details on the readout modes of DAMIC CCDs see Ref. Aguilar-Arevalo et al. (2016).
Radioactive sources of 241Am and 57Co with properties listed in Table 1 were installed on the front flange of the vessel (Fig. 2). These isotopes were chosen as they provide a few intense -ray lines (60 keV, 122 keV and 136 keV) of relatively low energy for which Compton scattering is the dominant interaction in the silicon target. Lower energy rays are preferred for statistical considerations, as the Compton spectrum is compressed toward lower energies with a larger fraction of interactions close to atomic binding energies. However, if the -ray energy is too low (e.g., 14 keV and 26 keV in Table 1) photoelectric absorption dominates with no observable Compton spectrum. Furthermore, lower-energy rays lead to shorter-range electron recoils, mitigating surface effects by minimizing both the number of electrons that escape the CCD without depositing their full energy and the flux of degraded-energy electrons arising from the surfaces of materials surrounding the device.
| Source | Activity | Half-Life | Intensity | |
|---|---|---|---|---|
| [Ci] | [y] | [keV] | [per 100 decays] | |
| 57Co | 8.7 | 0.745 (1) | 14.4130 (3) | 9.2 (2) |
| 122.0607 (1) | 85.51 (6) | |||
| 136.4736 (3) | 10.7 (2) | |||
| 241Am | 22 | 432.6 (6) | 26.3446 (2) | 2.31 (8) |
| 59.5409 (1) | 35.9 (2) |
IV Data sets
The eight sets of images used for this analysis are summarized in Table 2. For each radioactive source, we acquired data with 11 and 44 binning (Section III), each followed by a background run with the source removed. The 11 data were used to confirm the presence of a dominant bulk signal from Compton scattering relative to surface backgrounds. Thus, the data were acquired at low substrate bias () to increase lateral charge diffusion, and offer maximum spatial resolution for the precise reconstruction of the three-dimensional (3D) location of electron recoils. The 44 data were used to perform spectroscopy at the lowest energies. Hence, the data were acquired with a high so that most of the charge from an interaction was collected in a single 44 pixel group, minimizing the contribution from readout noise in the charge measurement. Finally, the background data were acquired to characterize and monitor the contribution from electronic noise and environmental backgrounds to the source runs.
| Binning | Source | images | Exposure | Event density | |
|---|---|---|---|---|---|
| [V] | [s] | [keV-1] | |||
| 11 | 57Co | 45 | 1898 | 986 | 3.5 |
| None | 45 | 1326 | 986 | 4.3 | |
| 241Am | 45 | 971 | 490 | 4.7 | |
| None | 45 | 1235 | 490 | 2.4 | |
| 44 | 57Co | 127 | 1815 | 39.8 | 2.3 |
| None | 127 | 2060 | 39.8 | 2.6 | |
| 241Am | 127 | 9828 | 39.8 | 2.5 | |
| None | 127 | 10267 | 39.8 | 1.1 |
A simulated data set for every detector-source configuration was produced with MCNPX (Monte Carlo N-Particle eXtended; v.2.7.0) particle transport code X-5 Monte Carlo Team . Full photon and electron transport was enabled using the corrected MCPLIB84 library to properly account for Doppler broadening M. White . The geometry and material specification of the setup was accurately reproduced (inset of Fig. 2). The production of charge carriers and their diffusion as they drift to the CCD pixel array were simulated with a dedicated Monte Carlo code. For each energy deposit, we simulated a 2D Gaussian distribution of charge on the pixel array, with a total number of charge carriers that is proportional to the deposited energy and a standard deviation () that is related to the depth () of the energy deposit by the charge diffusion model presented and validated in Ref. Aguilar-Arevalo et al. (2016). We then introduced the simulated charge distribution on top of images in the background data sets, in order to obtain a realistic representation of the image noise.
V Image processing and event reconstruction
The image processing started with the determination of its pedestal value, corresponding to the dc offset introduced at the time of readout. The pedestal was estimated independently for each column of the image by a Gaussian fit to the distribution of pixel values in the column, and was then subtracted from every pixel. After this first column-based equalization, the same procedure was applied to each row of the image, yielding a final image in which the distribution of the pixel values is centered at zero with standard deviation equal to the pixel noise (). Hot pixels or defects were identified as recurrent patterns over images in the same data set and eliminated (“masked”) from the analysis (typically, 10% of the pixels were removed by this procedure).
Ionization events were identified as clusters of contiguous pixels with values 4 . The energy of the event was estimated as the addition of the pixel values of the cluster. For 11 data, an additional cluster search was implemented for events with energies 10 keV, for which the electron recoil track length is much smaller than the pixel size, and the distribution of charge on the pixel array is well described by the 2D Gaussian distribution arising from charge diffusion. The algorithm is based on a moving window of 1111 pixels. For a given window’s position, the difference in log-likelihood () between two hypotheses — the first of a 2D Gaussian distribution of charge on top of white noise, the second of only white noise — was calculated. If the 2D Gaussian hypothesis was found more likely, the window was moved around to find the local maximum, to properly center the event in the window. Then a fit was performed from which the - position, charge spread and energy () of the candidate ionization event were obtained as the best-fit values of the center (), standard deviation () and integral of the 2D Gaussian, respectively. This clustering procedure has been previously validated in Ref. Chavarria et al. (2016), where it was shown that the requirement efficiently selects ionization events with a negligible contribution from readout noise.
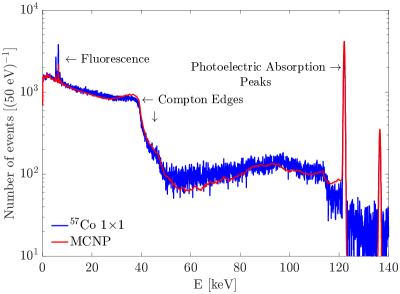
Figure 3 shows the observed electron-recoil spectrum in the 11 data with the 57Co source. Because of the high spatial resolution of the CCD, each event arises from a single -ray interaction. In addition to the spectral continuum from zero up to the Compton edges, other characteristic spectral features are evident, including the monoenergetic peaks from photoelectric absorption of the primary 122 keV and 136 keV rays, and secondary x-ray fluorescence lines from the surrounding materials. The simulated spectrum with MCNP is shown for comparison, presenting generally a fair agreement to the data, with some underestimation of the fluorescence yields.
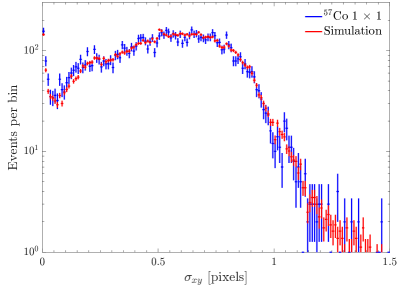
The scattering length in silicon of rays with energies above 50 keV is 1 cm, much larger than the thickness of the CCD, leading to interactions that are distributed uniformly in depth. Figure 4 presents the fitted of selected clusters with energies 1 keV, including those with energies as small as 60 eV. The distribution is compared to the result obtained for simulated events with a uniform distribution in the 0–1 keV energy range and a uniform spatial distribution across the thickness of the device. The parameters of the diffusion model were tuned to events at higher energy, and are in good agreement with those inferred by scaling a previous calibration of 675 m-thick CCDs from SNOLAB Aguilar-Arevalo et al. (2016). The close match between both distributions demonstrates that the recorded spatial distribution of low-energy clusters is consistent with the signal from Compton scattering, with a negligible contamination from surface events.
VI Low-energy spectra
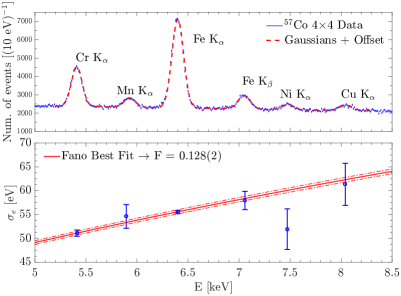
Low-energy spectra below 4 keV were constructed from the 44 data sets. For each data set, the energy scale of the ionization signal was calibrated with in-run fluorescence x rays from the stainless steel chamber (Fig. 5). The linear response of the CCD has been demonstrated for signals as small as 10 Aguilar-Arevalo et al. (2016).
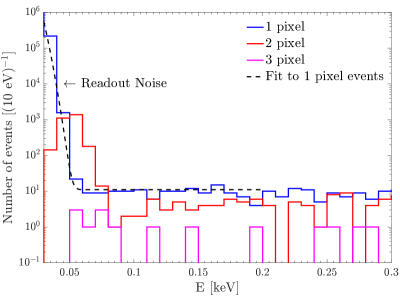
The energy threshold for this analysis was chosen to exclude readout noise. Figure 6 presents the spectrum of selected clusters with different number of pixels in all background data. The dashed line shows the result of a Gaussian fit to the single-pixel white noise, which demonstrates a negligible contribution of readout noise for single-pixel clusters above 60 eV. Readout noise is still important for clusters with a larger number of pixels up to 80 eV, becoming negligible beyond this point. Hence, to construct the final spectra, we consider only single-pixel events in the 60–80 eV range and correct for the 95%–90% efficiency of this selection, as estimated from simulation. For energies 80 eV, we consider all clusters without any correction, as the efficiency of clustering an event at these energies is already 99 % according to simulation.
Spectra were measured for the 57Co, 241Am, and background data sets. To remove the contribution of environmental backgrounds from the source spectra, the corresponding background spectra were scaled to the total exposure of the source spectra and then subtracted. Figures 7 and 8 show the final 57Co and 241Am Compton spectra in the 60 eV–4 keV range, respectively. The data are compared to the predictions from IA and MCNP, scaled to match the right-hand side of the K step in the data. The detector energy resolution was included in the predicted spectra, and was modeled as , where 0.13, the Fano factor Fano (1947); *doi:10.1117/12.948704, was directly estimated from the width of the observed fluorescence lines as shown in the bottom panel of Fig. 5. The constant term of arises from the image pixel noise and was estimated from the analysis of monoenergetic low-energy events in simulated data sets.
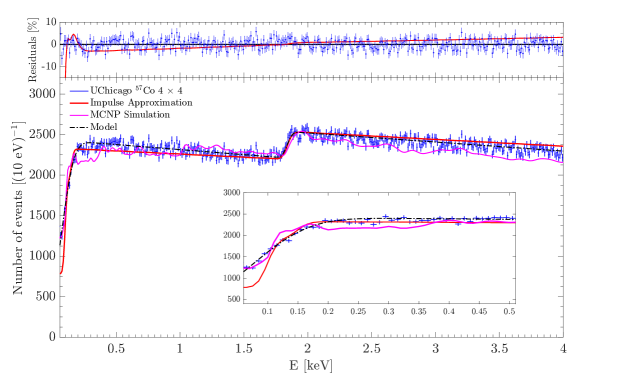
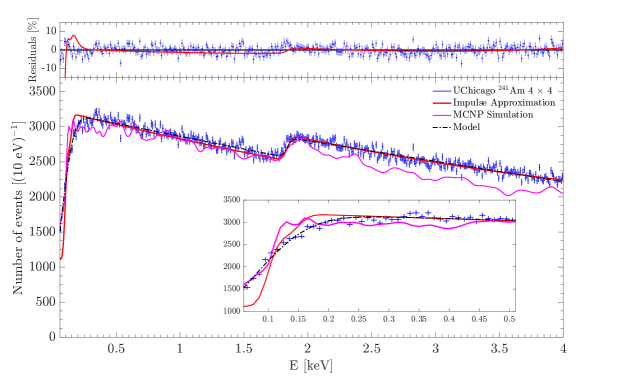
Both IA and MCNP are able to correctly match the gross features of the Compton spectra at low energies, implying a satisfactory implementation of the underlying physics. Overall, IA provides a better match to the data than MCNP, but it fails to accurately reproduce the shape of the L-step feature (insets of Fig. 7 and 8). This is unexpected, as the energy, amplitude and shape of the K step is consistent with the IA prediction. It is unlikely that the apparent decrease in resolution at the L step is due to the response of the detector. Our detailed calculations of the energy resolution, which consider the charge generated by all low-energy electrons Alig et al. (1980) emitted in the Auger cascade D. E. Cullen , suggest that the Fano model should be valid at these energies. This is supported by the calibration of the detector with oxygen fluorescence x rays, which give a resolution of 21 eV at 525 eV. Thus, we interpret the apparent decreased resolution as originating from a softened L step in the electron recoil spectrum, which may occur if the theoretical assumption adopted by IA that each atomic shell may be treated independently does not strictly hold beyond the K shell.
VII Model of Compton spectra at low energies
As is evident from Fig. 7 and 8, and expected from IA (Fig. 1), the Compton spectra at low energies is rather generic, with the position of the steps determined by the atomic shells of the target and the slope of the spectrum between the steps being approximately constant. We have compared the prediction from IA for energies 4 keV to a piecewise function constructed from first-order polynomials bounded by the atomic binding energies. With the appropriate choice of parameters, the function agrees to better than 0.5% with IA for a wide range of -ray energies for which the Compton scattering cross section is significant.
Motivated by this result, we propose to parametrize Compton spectra in the energy range 60 eV–4 keV with an expression of the form
| (2) |
with an additional Gaussian resolution term that applies only for 0.5 keV to smooth the L-step feature. Although the IA predicts two distinct and steps, we include a single step at an effective energy . With the appropriate choice of and , this definition significantly improves the description of the data by the model over the result from IA presented in Section VI.
To simplify the model further, we introduce the following approximation:
which defines the relative amplitude of the spectrum before and after the step as the ratio of the number of target electrons that contribute to the signal below and above . After imposing this constraint, the number of free parameters of the proposed parametrization decreases to six: the amplitude of the K step (), the slopes to the right and left of the K step ( and ), the parameters defining the shape of the L step ( and ), and the overall normalization of the spectrum ().
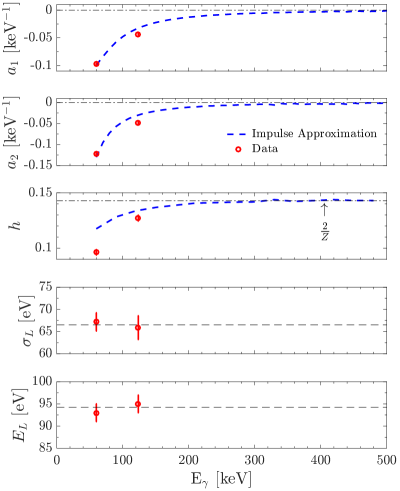
The best fit to the data with our model (including the detector response presented in Section VI) is shown by the dashed black line in Fig. 7 and 8 with the residuals in the top panel, which demonstrate an agreement to better than 5% throughout the full energy range. Figure 9 shows the best-fit values as a function of -ray energy for the five parameters that determine the shape of the spectrum. For , and , we included the prediction by IA. Our observations are consistent with the expectations from IA: i) the magnitude of the slope of the spectrum is inversely proportional to , and ii) the value of asymptotically approaches the fraction of electrons in the K shell, i.e., . The best-fit values of 65 eV and 95 eV are consistent between the 57Co and 241Am data, with no dependence on .
Because of the linear nature of Eq. 2 and the constant values of and , the addition of multiple functions corresponding to incident rays of different energies would also be accurately described by the same function with the appropriate choice of average values for the parameters. Therefore, the proposed parametrization should be a good description for the Compton background at low energies for any energy distribution of the incident -ray flux.
VIII Conclusions
A dominant source of environmental background in direct searches for low-mass dark matter particles are the energy deposits by small-angle Compton scattering of rays. We performed detailed measurements of Compton spectra between 60 eV and 4 keV in silicon, which demonstrate the capability of the CCDs employed in DAMIC to reliably resolve spectral features down to the experiment’s current threshold. We report, for the first time, spectral features associated with the atomic structure of the target, and present a general parametrization to describe the Compton spectrum at low energies for any energy distribution of the incident -ray flux. The model is based on the theoretical prediction of the Impulse Approximation modified for energies 0.5 keV, where the theory fails to describe the data. The inadequacy of the theoretical prediction at the lowest energies stresses the importance of precise experimental studies to characterize the backgrounds for low-mass dark matter searches. Our results are directly applicable to background estimates for the DAMIC experiment, as well as for other direct searches for dark matter that employ silicon detectors Agnese et al. (2017).
Acknowledgements.
This work has been supported by the Kavli Institute for Cosmological Physics at the University of Chicago through Grant No. NSF PHY-1125897 and an endowment from the Kavli Foundation, and by Grant No. NSF PHY-1506208.References
- Aguilar-Arevalo et al. (2016) A. Aguilar-Arevalo et al. (DAMIC Collaboration), Phys. Rev. D94, 082006 (2016), arXiv:1607.07410 [astro-ph.CO] .
- Agnese et al. (2017) R. Agnese et al. (SuperCDMS Collaboration), Phys. Rev. D95, 082002 (2017), arXiv:1610.00006 [physics.ins-det] .
- Kolb and Turner (1990) E. W. Kolb and M. S. Turner, Frontiers in Physics 69, 1 (1990).
- Griest and Kamionkowski (2000) K. Griest and M. Kamionkowski, Phys. Rep. 333, 167 (2000), hep-ph/9506380 .
- Zurek (2014) K. M. Zurek, Phys. Rep. 537, 91 (2014), arXiv:1308.0338 [hep-ph] .
- Essig et al. (2016) R. Essig et al., JHEP 05, 046 (2016), arXiv:1509.01598 [hep-ph] .
- Hochberg et al. (2017) Y. Hochberg, T. Lin, and K. M. Zurek, Phys. Rev. D95, 023013 (2017), arXiv:1608.01994 [hep-ph] .
- Bloch et al. (2016) I. M. Bloch, R. Essig, K. Tobioka, T. Volansky, and T.-T. Yu, (2016), arXiv:1608.02123 [hep-ph] .
- Holland et al. (2003) S. E. Holland, D. E. Groom, N. P. Palaio, R. J. Stover, and M. Wei, IEEE Trans. Electron Devices 50, 225 (2003).
- Aguilar-Arevalo et al. (2017) A. Aguilar-Arevalo et al. (DAMIC Collaboration), Phys. Rev. Lett. 118, 141803 (2017), arXiv:1611.03066 [astro-ph.CO] .
- Compton (1923) A. H. Compton, Phys. Rev. 21, 483 (1923).
- Klein and Nishina (1929) O. Klein and Y. Nishina, Zeitschrift für Physik 52, 853 (1929).
- Du Mond (1929) J. W. M. Du Mond, Phys. Rev. 33, 643 (1929).
- Ribberfors and Berggren (1982) R. Ribberfors and K. F. Berggren, Phys. Rev. A26, 3325 (1982).
- Biggs et al. (1975) F. Biggs, L. Mendelsohn, and J. Mann, Atomic Data and Nuclear Data Tables 16, 201 (1975).
- (16) R. Deslattes et al., “X-ray Transition Energies,” version 1.2 [Online], National Institute of Standards and Technology (2005).
- Chavarria et al. (2016) A. E. Chavarria et al., Phys. Rev. D94, 082007 (2016), arXiv:1608.00957 [astro-ph.IM] .
- Ryan (1973) R. D. Ryan, IEEE Trans. Nucl. Sci. 20, 473 (1973).
- Karcher et al. (2003) A. Karcher et al., in Nuclear Science Symposium Conference Record, 2003 IEEE, Vol. 3 (2003) pp. 1513–1517.
- Cease et al. (2008) H. Cease et al., Exp. Astron. 22, 41 (2008).
- Bé et al. (2004) M. M. Bé et al., Table of Radionuclides, Vol. 1–A = 1 to 150 (Monographie BIPM-5, Sèvres, 2004).
- Bé et al. (2010) M. M. Bé et al., Table of Radionuclides, Vol. 5–A = 22 to 244 (Monographie BIPM-5, Sèvres, 2010).
- (23) X-5 Monte Carlo Team, “MCNPX 2011,” Los Alamos National Laboratory Report No. LA-UR-03-1987, unpublished (2008).
- (24) M. White, “Further Notes on MCPLIB03/04 and New MCPLIB63/84 Compton Broadening Data For All Versions of MCNP5,” Los Alamos National Laboratory Report No. LA-UR-12-00018, unpublished (2012).
- Fano (1947) U. Fano, Phys. Rev. 72, 26 (1947).
- Janesick et al. (1988) J. Janesick et al., Proc. SPIE 0982, 70 (1988).
- Alig et al. (1980) R. C. Alig, S. Bloom, and C. W. Struck, Phys. Rev. B22, 5565 (1980).
- (28) D. E. Cullen, “Program RELAX: A Code Designed to Calculate Atomic Relaxation Spectra of X-Rays and Electrons,” Lawrence Livermore National Laboratory, unpublished (1992).