Dynamic induced softening in frictional granular material
investigated by DEM simulation
Abstract
A granular system composed of frictional glass beads is simulated using the Discrete Element Method. The inter-grain forces are based on the Hertz contact law in the normal direction with frictional tangential force. The damping due to collision is also accounted for. Systems are loaded at various stresses and their quasi-static elastic moduli are characterized. Each system is subjected to an extensive dynamic testing protocol by measuring the resonant response to a broad range of AC drive amplitudes and frequencies via a set of diagnostic strains. The system, linear at small AC drive amplitudes has resonance frequencies that shift downward (i.e., modulus softening) with increased AC drive amplitude. Detailed testing shows that the slipping contact ratio does not contribute significantly to this dynamic modulus softening, but the coordination number is strongly correlated to this reduction. This suggests that the softening arises from the extended structural change via break and remake of contacts during the rearrangement of bead positions driven by the AC amplitude.
pacs:
81.05.Rm, *43.25.-x, 05.45.-a, *43.25.GfI Introduction
Granular materials are comprised of an ensemble of randomly packed solid particles and the mechanical behaviour of the systems is basically determined by the interactions at contacts. These materials are ubiquitous in industry and in geosciences, and are also of fundamental interest to ground motion and earthquake dynamics. Unlike ordinary materials, granular media can exhibit solid-like and fluid-like behaviour and there exists transition between the two states Liu and Nagel (1998). A granular solid shows strong nonlinear elasticity and sound propagation provides a footprint of this feature Goddard (1990); Liu and Nagel (1993); Jia et al. (1999); Makse et al. (2004). The nonlinear dynamic response found in granular media such as resonance frequency softening, slow dynamics and harmonic generation Norris and Johnson (1997); Johnson and Jia (2005); Brunet and Johnson (2008); Jia et al. (2011) is very similar to those discovered in rocks Johnson et al. (1996); Guyer and Johnson (1999); Smith and Ten Cate (2000); Ostrovsky and Johnson (2001); TenCate et al. (2004).
Other nonlinear behavior observed in granular solids include stress-strain hysteresis Ostrovsky and Johnson (2001), fabric anisotropy Johnson et al. (1998); Khidas and Jia (2010) and loading-history-dependent sound velocity Norris and Johnson (1997); Johnson et al. (1998); Khidas and Jia (2010). Such behaviour is closely related to the fragility of the granular solid determined by the very inhomogeneous and anisotropic contact network ; it may react elastically to load changes in one specific direction but infinitesimal loads in another direction will drive rearrangements in the sample Cates et al. (1998).
If the jammed granular solids are treated as homogenous, for example by coarse
graining Goldenberg and Goldhirsch (2005), the effective medium theory (EMT)
Digby (1981); Walton (1987); Makse et al. (1999) may be
applied using an affine approximation to qualitatively connect the global
response, like the bulk and shear elastic moduli and , to the local
geometry. In the case of isotropic compression, the EMT based on the Hertz
contact law predicts the scaling for
and where is the confining
pressure, the packing fraction and the coordination number
(assumed to be
constant)Digby (1981); Walton (1987); Makse et al. (2004). The
scaling of and can be determined by the velocities of compression and
shear waves, via and where
and are respectively the packing and the
particle densities Digby (1981); Makse et al. (2004). It has been
revealed by numerical simulations that at low the bulk modulus still
scales as while the shear modulus scales as near unjamming Wyart et al. (2005); Makse et al. (2004). This
observation can be explained by the breakdown of the effective medium theory
due to the nonaffine motion caused by the rearrangement of the contact network
or particle positions.
Current numerical works on vibrational properties focus on the density of modes as the packing fraction decreases to the jamming point O’Hern et al. (2003); Mouraille et al. (2005); Wyart et al. (2005); Somfai et al. (2005); Vitelli et al. (2010); Xu et al. (2010); Reichhardt et al. (2015). An issue of broad interest is the evolution of material characteristics as a granular packing approaches the unjamming transition by vibration-induced fluidization D’Anna and Grémaud (2001). The combination of acoustic probing and pumping in the nonlinear regime allows us to highlight the material softening near this transition, using sound velocity Jia et al. (2011); Van den Wildenberg et al. (2013) or resonance Johnson and Jia (2005) measurements. Simulations with 2D disk packings using a normal Hertzian contact force and a tangential viscous force have qualitatively reproduced the experimental observation of resonance frequency softening with increasing dynamic amplitude. This behaviour arises from rearrangements of the contact network, resulting in a reduction in the average contact number but without significant rearrangement of particle positions Reichhardt et al. (2015). However, the effect of friction on the elastic softening Jia et al. (2011); Van den Wildenberg et al. (2013) is absent in these frictionless systems.
Here we address this issue by simulating the effects of resonance frequency softening in confined 3D frictional bead packings under an applied dynamic (AC) drive. We drive the confined granular packing at larger and larger amplitudes to explore the nonlinear response of the material that provide clues to the transition from a solid state to a fluid state where the mobility of particles becomes important, nevertheless having a mean-square displacement smaller than the particle size. Note that the granular packing does not flow in our simulations due to the absence of macroscopic shear, but merely approaches the fluid state with significant elastic softening and particle position rearrangement D’Anna and Grémaud (2001); Jia et al. (2011). In the next section, we present the numerical model and the protocol of tests and then we show the simulation results. All these findings will be analysed using the mean-field approach.
II Numerical model and methodology
We apply the Discrete Element Method Cundall and Strack (1979) (LIGGGHTS 3.4 Kloss and Goniva (2011)) to simulate the mechanical behavior of 3D glass bead packings under static and oscillatory loading stress. The Hertz contact law is used to reproduce normal elastic interactions between elastic spheres and an elastofrictional model is implemented to describe the tangential interaction. The collision process is also included for the viscoelastic damping.
II.1 Intergrain forces
The total force acting on a particle is the sum of the contact forces with interacting particles and viscosity damping. Specifically, it is the sum of a normal force based on the Hertz theory, and a tangential force based on an approximation of the Mindlin model Johnson (1985):
| (1) | ||||
where and are the normal overlap and relative tangential displacement between particles and . is truncated to fulfil where is the coefficient of the Coulomb friction, is the normal force at one contact and is the tangential force. Particles over threshold are modelled as slipping against each other. and are the normal and tangential unit vectors of each contact . Finally, is the velocity of particle while . is the viscous damping coefficient for numerical stabilisation.
Provided with the Young’s modulus , shear modulus and loss coefficient of the grains, the tangential and normal elastic constants are:
| (2) | ||||
| (3) |
and the viscoelastic parameters related to collision losses:
| (4) | ||||
| (5) |
The effective radius and mass depend on the respective radii and masses of the two particles: and .
The equation governing rotational velocity is:
| (6) |
with the moment of inertia, the vector from the center of the particle to the contact point, the tangential component of the force exerted on the particle and a torque at each contact:
| (7) |
with the rolling resistance and is the relative angular velocity Goniva et al. (2012).
Energy is basically dissipated via frictional damping in sliding and, in collisonal interactions, via the coefficient , with the restitution coefficient.
II.2 Granular sample preparation
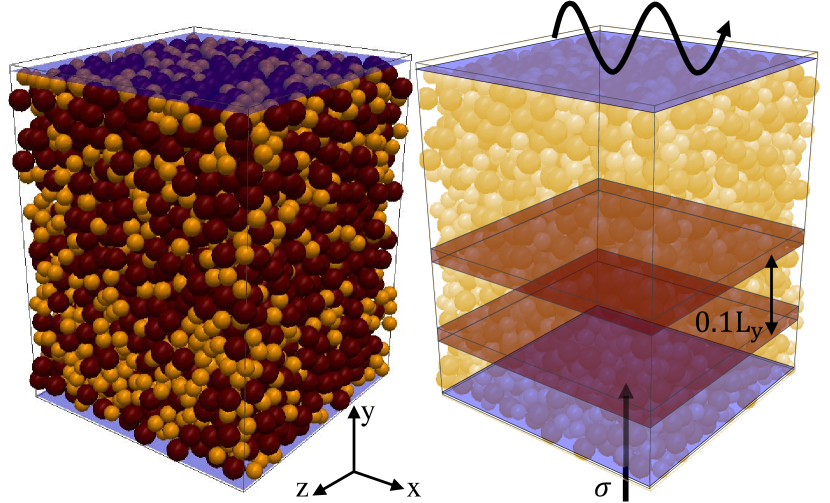
3D samples are created by randomly filling particles of radius or into a box with dimensions (See Fig. 1). Particles have a density . The -axis is vertical (with at the bottom) and periodic boundary conditions are applied in the x- and z-directions. Two walls enclose the system in y-direction. These walls can be moved via a fixed function or servo-controlled, in which case an algorithm will move the wall with a maximal velocity to maintain a constant loading stress.
A variable velocity from to is applied to the bottom of the box to compact the particles while the top wall moves to reach a static loading stress . After a period , the bottom wall moves with a sinusoidal vertical movement with for a period to perturb the system and bring it closer to equilibrium. The amplitude of perturbation with the sample height when perturbation starts. Preliminary simulations showed that this value drives rearrangements and compaction in the samples. Finally the bottom wall is stopped and the packing is allowed to evolve and relax during period , to reach a sample height of with about particles. Granular samples are confined by the loading stress , set at logarithmically spaced values between and . The resulting static strain is estimated as with a limited precision at low values depending on the test protocol.
All simulations are run with (air effect at room temperature) and timestep . Particles have contact force parameters of , (), , and , and their radii are and . of the sample mass is made of particles with radius and with radius .
II.3 Tests under quasistatic compression and shear
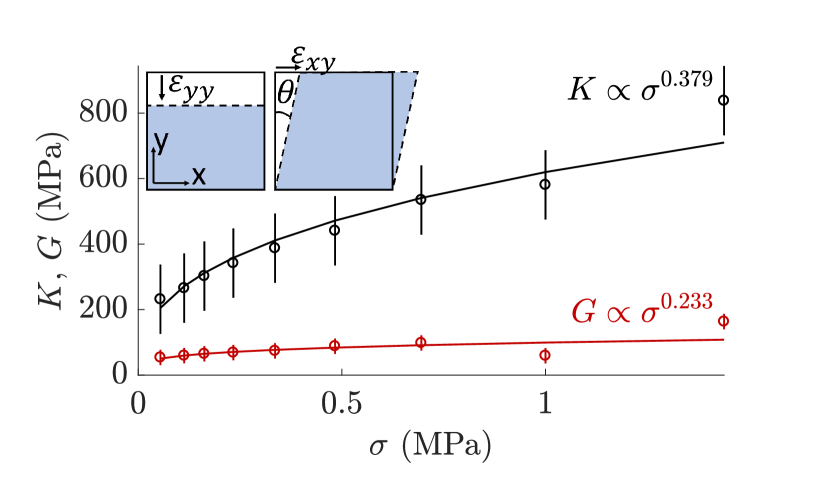
The granular samples are compressed by uniaxial load or sheared at constant volume to determine their bulk and shear moduli, respectively (see figure 2, inset). The driving incremental strains (cycle) are .
During a compression test, the bottom wall remains fixed while the top wall moves downward at constant velocity to make a small cycle around the confining stress . The top wall first moves down at velocity over a period , then up at for , then back down at for . The compressive strain (the deviation of sample height from its initial value ) and compressive stress on the top wall are recorded. The stress for an isotropic packing is given as:
| (8) |
with Young’s Modulus and Poisson ratio of the granular medium.
A shear test is performed by imposing the wall at fixed positions along the y-axis, while the top wall is sheared along the x-axis. The wall moves at velocity in the x-direction for a time , then moves back at for , and finally at for . The shear stress and the strain are recorded during the simulation. Assuming isotropic linear elastic behavior, the stress-strain relation is given as:
| (9) |
Equations (8) and (9) constitute a system of two equations with two unknowns: the Young’s Modulus and Poisson ratio of the granular material. The bulk and shear moduli are given by and . The moduli were determined using the full cycle, with negligible hysteresis observed during the loading-unloading.
Compression and shear tests were both performed at a velocity for . The highest velocity ensuring quasi-static measurements is computed for , with , , . The strain rate implies for our samples.
II.4 Tests under compressional vibration
A probing layer inside the sample with y-coordinate comprised between and has been selected (to avoid the wall effect) to study the dynamic strain of the granular packing to an applied vibration. The system is driven for periods at each drive frequency so that it reaches quasi-steady state and data are averaged over the last periods and recorded. Measurements are made times per period.
Frequency sweeps are performed in the granular packings under different confining stress , maintained by the bottom wall. The applied vibration is introduced by vertically moving the top wall with for periods. The frequency during sweeps is increased from to by steps of . The drive amplitude ranges from to . The dynamic strain is computed as the amplitude divided by the average height of the system : ,varying accordingly from to
For measuring the resonance response of the sample, we investigate the dynamic strain of a local layer away from the nodes of the standing waves. Here, the local strain is computed as follows. First the instantaneous strain is determined as the relative difference between the local layer height and its average over the last periods of the system driven at :
| (10) |
The strain is composed of a slowly-evolving component due to the relaxation of the specimen and a component oscillating at drive frequency. We remove the slowly-evolving component by subtracting a moving-average window with a length equivalent to one period of the system. Finally we fit the amplitude and phase of the sinus on the remaining strain oscillation.
II.5 Slipping contact ratio and coordination number
In addition to the dynamic strain, we also studies the Slipping Contact Ratio of the probe layer which is the ratio between contacts ’slipping’ in regard to each other (algorithmically when the Coulomb threshold is applied to the tangential force) to all contacts in the probing layer. The average corresponding to a frequency is obtained over the last periods of driven at . Similarly, the coordination number is the average number of contacts of particles in the probing layer. is the average of over the last periods. In this work, we investigate the values of , and in the same probing layer as a function of the driving frequency .
III Results and discussion
III.1 Bulk moduli
Fig. 2) shows the bulk and shear moduli obtained by compression and shear tests in granular samples as a function of the confining stress . scales as being close to the Hertz theory prediction with a dependency of Walton (1987) whereas scales as with an exponent lower than those found in other simulations with imposed confining pressure Makse et al. (2004); Agnolin and Roux (2007a); Wyart et al. (2005). As shown below, the value of bulk modulus found here are in good agreement with the compressional sound velocity deduced from our main resonance simulation. We also observe a strong dependence of the elastic on the coordination number and packing fraction of the samples Agnolin and Roux (2007a). In the present samples, the coordination number ranges from to , and the packing fraction from to , in the range expected for an isotropic packing of frictional particles Agnolin and Roux (2007b).
III.2 Resonance, Hertzian scaling and softening
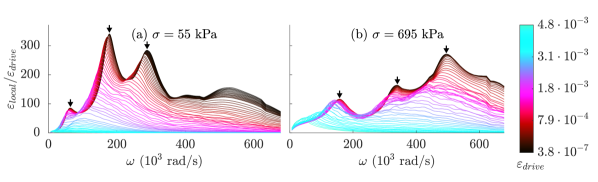
Figure 3 shows two series of frequency sweeps performed for low and high , respectively. Both figures show the results for a series of drive strains from to (the highest value for which a peak could be distinguished for all samples). At low drive strain, the resonance frequency does not decrease, but the system exhibits harmonics (shown with arrows on Fig. 3) as found in the experiments Brunet and Johnson (2008). As the drive strain increases, resonance frequencies decrease and resonant peaks broaden and start to merge with each other.
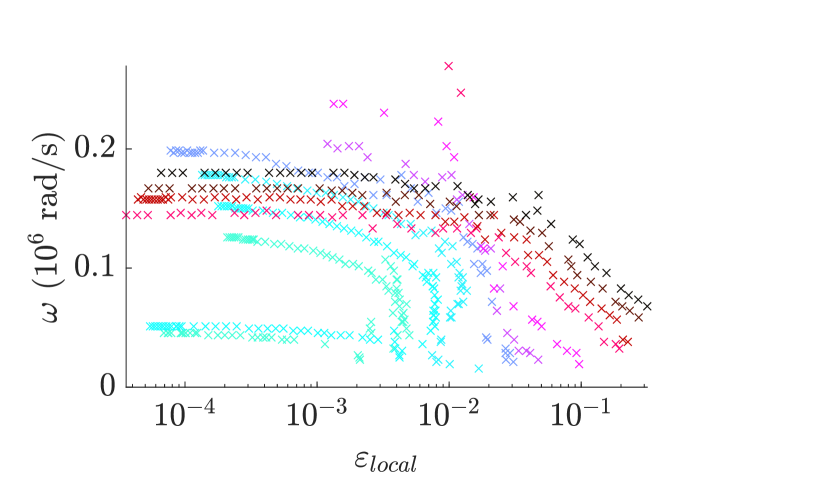
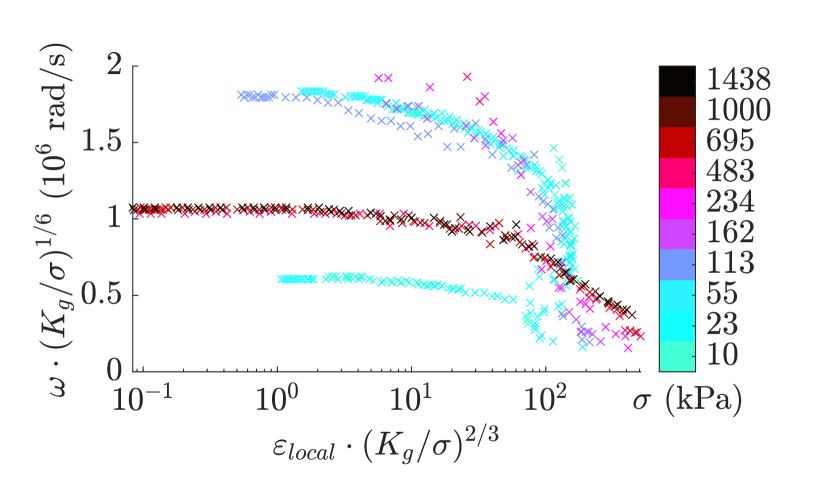
We plot these frequency shifts in Fig. 4. The resonances satisfying are extracted detecting and fitting each peak with a third-order polynomial, and reported in Fig. 4(a). Samples at high loading stress, above show a clear linear regime at low local strain followed by a softening. This thresholding was selected because the two first modes at low loading stress merge as drive strain increases and, at high loading stress and high drive strain, only the first mode remains. The Hertz theory, as implemented in equation (1), predicts a contact force proportional to the overlap between two particles . If our samples were to follow the mean-field approach based on the Hertzian contact, the resonance would scale as Goddard (1990) and the strain as Walton (1987). We apply this scaling and report the data on Fig. 4(b), where we observe that resonances collapse onto primary curves: two for low stresses and one for high stresses.
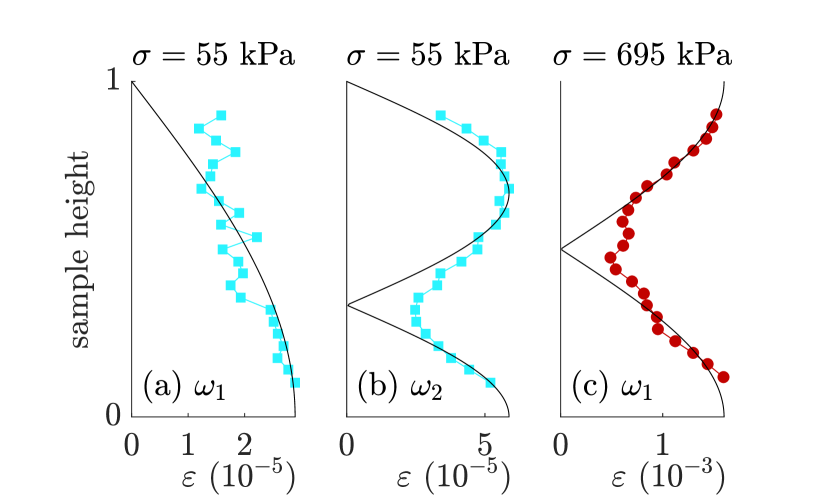
We note that resonant modes at and represent different boundary conditions. Fig. 5(a,b) shows the local strain vertical profile in a sample at vibrated at its first and second modes and . The data shows an approximately free boundary condition at the top wall with very small strain or stress, and a clamped-like boundary at the bottom wall with finite strain or stress. The first modes of such a system are and (black line on (a) and (b)). In contrast, the high loading stress samples shows clamped-like boundary conditions at both ends where the dynamic strain or stress is very small compared to the static strain or confining stress. The first mode, , and data are reported on Fig. 5(c). Data in all three cases follow the predicted modes. The deviation on the boundary and at the antinode are presumably due to the inherent fluctuation in the granular material. Fig. 4(b) thus shows a Hertzian scaling of the resonance for two different boundary conditions. At low loading stress, two modes are observed which soften at higher local strain, and merge together. Data for high loading stress supports higher local strains and shows a clear linear regime at low local strain. Moreover, from Figs. 4a and 5c, we measure a resonant frequency with a wavelength which gives a longitudinal sound speed . The bulk modulus can then be deduced by , which is consistent with the value derived from the static compressional test (Fig. 2).
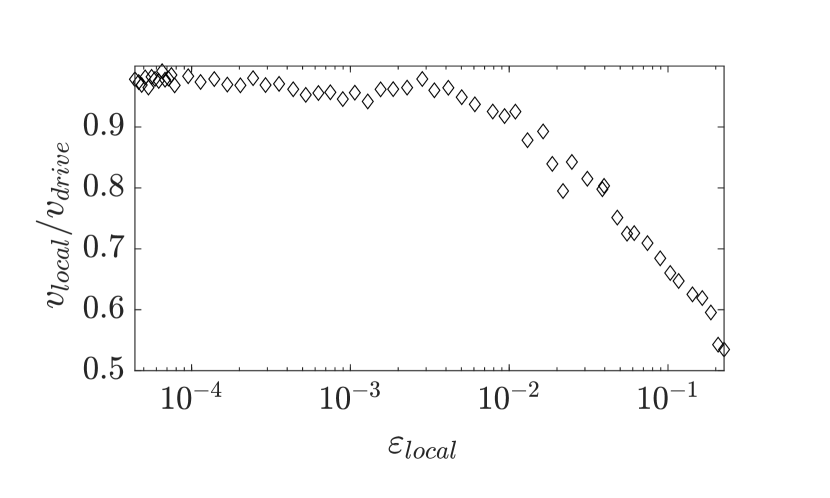
We also investigate the transmission of the kinetic energy into the granular system from the driving force, by comparing the average particle velocity in the probing layer and the driving wall velocity . The particle velocity is obtained from the relation , with returned by simulations and the packing mass for . The maximal driving velocity of the wall is the product of the resonant frequency and the displacement amplitude: . Fig. 6 shows that at low strain (linear regime) the ratio of the particle velocity to the driving is almost constant and equal to , but at higher strain it decreases to about . Furthermore we observe a striking similarity between this ratio and the resonance frequency decrease with increasing dynamic strain (Fig. 4(b) and Fig. 9(a)). This behaviour can be qualitatively understood in terms of the coefficient of amplitude transmission which depends on the acoustic impedance and accordingly the sound velocity of the granular sample Van den Wildenberg et al. (2013): the lower the sound velocity (due to elastic softening), the lower the transmission coefficient.
III.3 Changes of coordination number and slipping contact ratio upon applied vibration
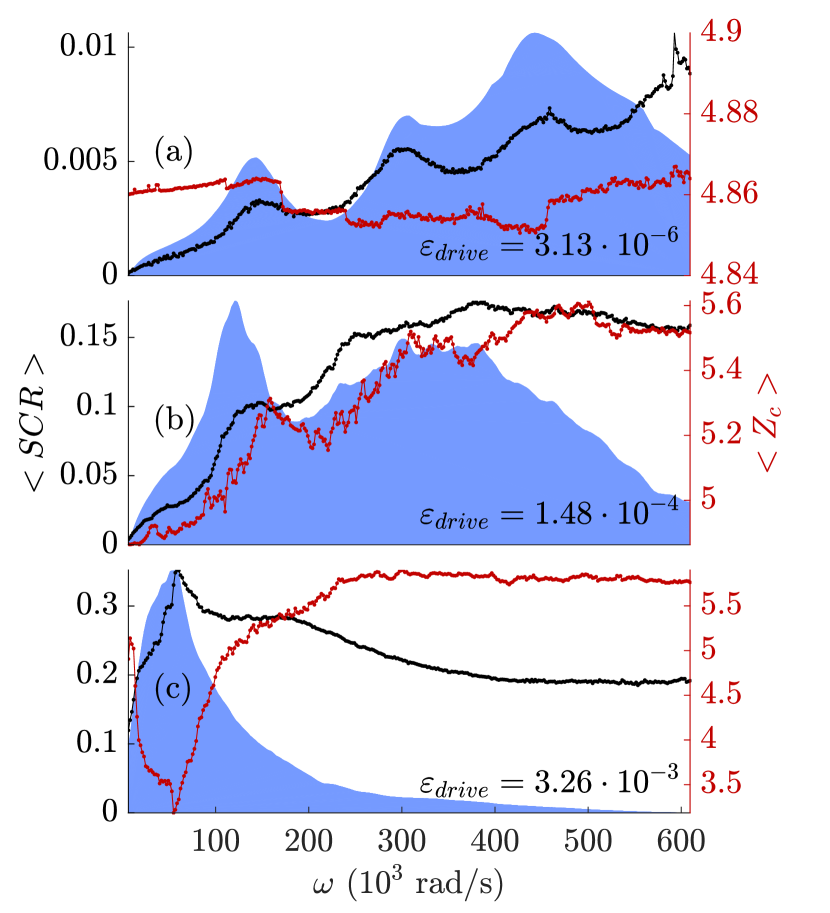
To understand the responses of granular samples to the applied vibration, we investigate simultaneously the structural changes of the contact networks. More specifically, we study the coordination number and slipping contact ratio on the grain scale in our samples. Fig. 7 shows three frequency sweeps performed on a sample at . The blue outline represents a scaled profile of the frequency sweep. In black is reported the percentage of slipping contacts (left axis) and in red the average coordination number (right axis). In the linear regime (a), the coordination number remains constant at , with variations due to small movements in the sample. The slipping contact ratio peaks at resonance, and progressively increases from to over the frequency sweep, showing a progressive mobilisation of contacts. At higher drive strain (b), the coordination number peaks around the first resonant mode and spans the range to over the frequency sweep. The slipping contact ratio peaks at the first resonant mode. At higher drive strain (c), the coordination number decreases at resonance frequency. The slipping contact ratio shows a moderate peak at resonance, than decreases after reaching of mobilised contacts. Results in (b) and (c) show lasting changes in the grain arrangement (coordination number), and dynamic changes in the sample (slipping contact ratio).
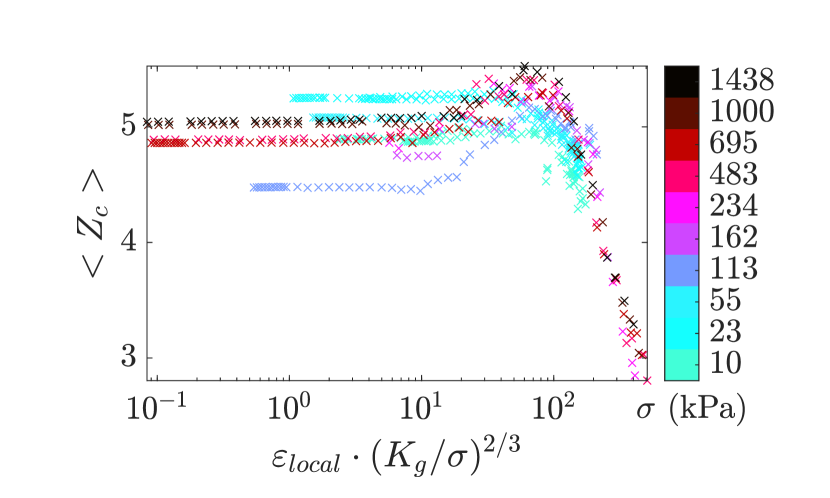
Fig. 8 reports the average coordination number at resonance for different loading stresses and local strains. In all cases, the average is constant at low strain and decreases at high strain. High loading stresses reach higher local strain values and we therefore use the sample at to study the behavior of the system. Variations in initial coordination number (value at low strain) are due to randomness in the packing generation.
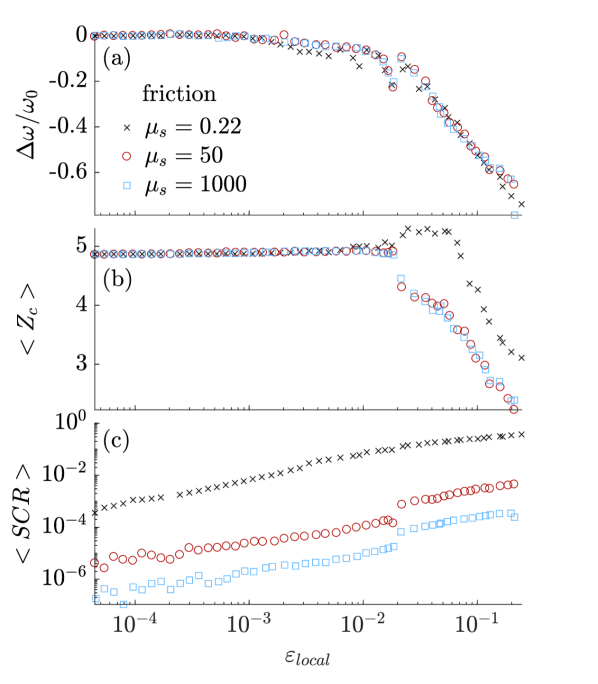
In order to test the effect of slipping contacts on the softening, the resonant frequencies of the sample at are reported for different values of the friction in Fig. 9(a). The linear and nonlinear regime are identical whether contacts can slip () and almost not ( and ). Fig. 9(b) shows the coordination number for the three friction coefficients. The linear regime spans the same range of strain, and all three systems show a decrease of coordination number in the nonlinear regime. In the case of high friction, curves in Fig. 9 (a) and (b) have a similar shape. Fig. 9 (c) reports the slipping contact ratio as a function of local strain . For a specific friction coefficient , the slipping contact ratio increases with local strain. It is scaled down by three orders of magnitude between and , but without any clear correlation with the frequency softening. The tangential component of the interaction force has no or limited impact on the material softening, in contrast with the previous experimental observations where the microslip between the solid beads leads to the softening of contact stiffness and consequently the effective material softening (Jia et al. (2011)).
IV Concluding remarks
We form granular systems, subject to a normal Hertzian force and a tangential elasto-frictional force, in mechanical equilibrium at a sequence of confining stresses , where is the effective bulk modulus of granular samples (Fig. 2) and . We subject these systems to dynamic testing using AC drive with amplitude at frequency . The output of this dynamic testing at is the resonance frequency and the local AC strain as a function of or . We find to good approximation that the scaled resonance frequency is a universal function of the scaled strain, with the scaling appropriate to a Hertz contact system, , despite of important nonaffine motion of the particles with mean-square displacement being smaller than the particle size.
At low drive amplitudes, , the dynamic response is linear and the effective elastic constant deduced from the resonance frequency is independent of . At high drive strain being close the static strain by the (high) confining stress, there are large departures from linearity. There the resonance frequency decreases as drive amplitude increases. These departures are taken to represent a reduction in dynamic modulus, termed ’softening’. The softening is a manifestation of the path toward unjamming transition; one infers that at slightly larger drive levels, the material will fluidize. The Hertz scaling extends into the AC amplitude domain in which we observe this softening. Throughout our exploration over (,)-space (to be detailed elsewhere), we monitor a number of quantities that could shed light on the microscopic properties of the system, e.g., the average coordination number , the slipping contact ration and the average particle velocity .
It is natural to ask if the slipping contact plays a role on the observed elastic softening. We repeated a number of calculations, primarily at , with the friction coefficient that controls ’slipping’ set to values that include almost no slipping, and examined the slipping contact ratio. Even when the number of slipping contacts is reduced by several orders of magnitude we find no significant change in the nonlinear elastic response. The motion afforded by slipping contacts is not the responsible mechanism that contributes to the softening, as found in the experimental observations at strain amplitude of due to the nonlinear tangential Mindlin contact Johnson and Jia (2005); Jia et al. (2011). Such contact softening mechanism is absent in the present numerical model, but our finding suggests another mechanism of softening likely related to the decrease of the coordination number due to the rearrangement of the particle position, driven by the applied AC amplitude in a manner similar to effective temperature characterized by non-affine motion of the particles D’Anna and Grémaud (2001). The results are different from those found in 2D simulations where the particle positions are little changed under AC drive Reichhardt et al. (2015). The modulus reduction would be proportional to the amplitude of particle rearrangements which in turn is proportional to the amplitude of the AC drive. The modulus reduction is associated with increased fragility ultimately leading to fluidization, a phase transition not explored here.
In summary we have applied DEM to study the behavior of a particle ensemble, driven progressively harder under resonance conditions. We have done this at several applied loads. We find a material softening manifested by the resonance frequency decrease with AC amplitude. The coordination number is the most telling characteristic measured, showing the softening arises from the breaking and remake of contacts that are brought into existence and given mobility of the particles by the AC drive amplitude. This approach could be valuably applied to the transition from the solid to the fluid states, which is approached in these simulations.
Acknowledgements
Paul Johnson and Robert Guyer gratefully acknowledge the US Department of Energy Office of Basic Energy Science and support from EMPA.
References
- Liu and Nagel (1998) A. J. Liu and S. R. Nagel, Nature 396, 21 (1998).
- Goddard (1990) J. Goddard, Proc. R. Soc. London 430, 105 (1990).
- Liu and Nagel (1993) C.-h. Liu and S. R. Nagel, Phys. Rev. B 48, 15646 (1993).
- Jia et al. (1999) X. Jia, C. Caroli, and B. Velicky, Phys. Rev. Lett. 82, 1863 (1999).
- Makse et al. (2004) H. A. Makse, N. Gland, D. L. Johnson, and L. Schwartz, Phys. Rev. E 70, 061302 (2004).
- Norris and Johnson (1997) A. Norris and D. Johnson, J. Appl. Mech.-T. ASME 64, 39 (1997).
- Johnson and Jia (2005) P. A. Johnson and X. Jia, Nature 437, 871 (2005).
- Brunet and Johnson (2008) X. Brunet, T. Jia and P. Johnson, Geophys. Res. Lett. 35, L19308 (2008).
- Jia et al. (2011) X. Jia, T. Brunet, and J. Laurent, Phys. Rev. E 84, 020301 (2011).
- Johnson et al. (1996) P. A. Johnson, B. Zinszner, and P. N. Rasolofosaon, J. Geophys. Res. 101, 11 (1996).
- Guyer and Johnson (1999) R. A. Guyer and P. A. Johnson, Phys. Today 52, 30 (1999).
- Smith and Ten Cate (2000) E. Smith and J. A. Ten Cate, Geophys. Res. Lett. 27, 1985 (2000).
- Ostrovsky and Johnson (2001) L. Ostrovsky and P. Johnson, Riv. Nuovo Cimento 24, 1 (2001).
- TenCate et al. (2004) J. A. TenCate, D. Pasqualini, S. Habib, K. Heitmann, D. Higdon, and P. A. Johnson, Phys. Rev. Lett. 93, 065501 (2004).
- Johnson et al. (1998) D. Johnson, L. Schwartz, D. Elata, J. Berryman, B. Hornby, and A. Norris, J. Appl. Mech. 65, 380 (1998).
- Khidas and Jia (2010) Y. Khidas and X. Jia, Phys. Rev. E 81, 021303 (2010).
- Cates et al. (1998) M.E. Cates, J.P. Wittmer, J.P. Bouchaud, and P. Claudin, Phys. Rev. Lett. 81, 1841 (1998).
- Goldenberg and Goldhirsch (2005) C. Goldenberg and I. Goldhirsch, Nature 435, 188 (2005).
- Digby (1981) P. Digby, J. Appl. Mech. 48, 803 (1981).
- Walton (1987) K. Walton, J. Mech. Phys. Solids 35, 213 (1987).
- Makse et al. (1999) H. A. Makse, N. Gland, D. L. Johnson, and L. M. Schwartz, Phys. Rev. Lett. 83, 5070 (1999).
- O’Hern et al. (2003) C. S. O’Hern, L. E. Silbert, A. J. Liu, and S. R. Nagel, Phys. Rev. E. 68, 011306 (2003).
- Mouraille et al. (2005) O. Mouraille, W. Mulder, and S. Luding, J. Stat. Mech. , P07023 (2005).
- Wyart et al. (2005) M. Wyart, L. E. Silbert, S. R. Nagel, and T. A. Witten, Phys. Rev. E 72, 051306 (2005).
- Somfai et al. (2005) E. Somfai, J.-N. Roux, J. H. Snoeijer, M. van Hecke, and W. van Saarloos, Phys. Rev. E 72, 021301 (2005).
- Vitelli et al. (2010) V. Vitelli, N. Xu, M. Wyart, A. J. Liu, and S. R. Nagel, Phys. Rev. E 81, 021301 (2010).
- Xu et al. (2010) N. Xu, V. Vitelli, A. Liu, and S. Nagel, Europhys. Lett. 90, 56001 (2010).
- Reichhardt et al. (2015) C.J. Olson Reichhardt, L. Lopatina, X. Jia, and P.A. Johnson, Phys. Rev. E 92, 022203 (2015).
- D’Anna and Grémaud (2001) G. D’Anna and G. Grémaud, Nature 413, 407 (2001).
- Van den Wildenberg et al. (2013) S. Van den Wildenberg, M. van Hecke, and X. Jia, Europhys. Lett. 101, 14004 (2013).
- Cundall and Strack (1979) P. A. Cundall and O. D. Strack, geotechnique 29, 47 (1979).
- Kloss and Goniva (2011) C. Kloss and C. Goniva, Supplemental Proceedings: Materials Fabrication, Properties, Characterization, and Modeling, Volume 2 , 781 (2011).
- Johnson (1985) K.L. Johnson, Contact mechanics , 84 (1985).
- Goniva et al. (2012) C. Goniva, C. Kloss, N. G. Deen, J. A. Kuipers, and S. Pirker, Particuology 10, 582 (2012).
- Agnolin and Roux (2007a) I. Agnolin and J.-N. Roux, Phys. Rev. E 76, 061304 (2007a).
- Agnolin and Roux (2007b) I. Agnolin and J.-N. Roux, Phys. Rev. E 76, 061302 (2007b).