Radio Observations of the Region around the Pulsar Wind Nebula HESS J1303631 with ATCA
Radio observations of the region surrounding PSR J13016305 at GHz and GHz were conducted with ATCA on September 5th, 2013. They were dedicated to the search of the radio counterpart of the evolved pulsar wind nebula HESS J1303631, detected in X-rays and GeV-TeV -rays. The collected data do not reveal any significant extended emission associated with PSR J13016305. In addition, archival GHz and GHz data do not show any evidence for a radio counterpart of HESS J1303631. Archival GHz observations reveal a detection of an extended structure centred at an angular distance of from the pulsar. This extended structure might be a Supernova remnant (SNR) and a potential birth place of PSR J13016305. The implications of the lack of radio counterpart of HESS J1303631 on the understanding of the nature of the PWN are discussed.
Key Words.:
pulsars: individual: PSR J13016305; stars: winds, outflows; radio continuum: stars; radiation mechanisms: non-thermal1 Introduction
HESS J1303631 is one of the most prominent examples of the so-called very high energy (VHE; GeV) -ray “dark” sources, those which were detected in the VHE band but do not have counterparts at other energy bands. It was discovered in 2005 (Aharonian et al., 2005) but the nature of the source was unclear until 2012, when a detailed study of the energy-dependent morphology provided evidence of the association with the pulsar PSR J13016305 (H.E.S.S. Collaboration et al., 2012). With the increase of the energy threshold a very extended emission region (∘∘ at the TeV band) of VHE -rays “shrinks” towards the position of the pulsar at TeV. While at lower energies the peak position of the extended emission region is significantly offset from the position of the pulsar, at energies above 10 TeV the pulsar is coincident with the peak of the -ray emission region (H.E.S.S. Collaboration et al., 2012). Such an energy-dependent morphology is expected for ancient pulsar wind nebulae (PWNe; H.E.S.S. Collaboration et al., 2012, and references therein). Young electrons located close to the pulsar are not cooled yet and, thus, very energetic. These energetic electrons generate the VHE emission around the pulsar via inverse Compton (IC) scattering on the cosmic microwave background photons (CMB). Older, cooled down, lower energy electrons might be spread farther away from the pulsar for several reasons (e.g. proper motion of the pulsar which causes that older particles are left behind and/or particle diffusion) but they can still produce -rays via IC scattering, however at lower energies than the young electrons.
The association of HESS J1303631 with the pulsar is further supported by the detection of its X-ray counterpart with XMM-Newton (H.E.S.S. Collaboration et al., 2012). The size of the X-ray PWN is much smaller than the size of the VHE source, extending from the pulsar position towards the centre of the VHE -ray emission region. The much smaller size of the X-ray emitting region can be explained by an effective synchrotron cooling of older electrons to energies too low to generate synchrotron emission in the X-ray energy range and/or due to the decreasing magnetic field strength in the PWN with time (see e.g. de Jager et al., 2009; Vorster et al., 2013b). The tail-like extension of the X-ray source might be an indication of the proper motion direction of the pulsar triggering speculations about its possible birth-place (H.E.S.S. Collaboration et al., 2012).
An analysis of archival data from the Parkes-MIT-NRAO (PMN) survey at 4.85 GHz (Condon et al., 1993) revealed also a hint of radio emission at the pulsar position with size comparable to the X-ray emission region (H.E.S.S. Collaboration et al., 2012). Data analysis showed a feature with a peak flux density of mJy/beam which is at the detection limit of the survey and was considered as an upper limit. This hint of a radio counterpart of HESS J1303631 triggered new dedicated observations with the Australian Telescope Compact Array (ATCA), which were conducted in September 2013. Results of these observations are presented in this paper.
Recently, the counterpart of HESS J1303631 was finally detected at GeV energies with Fermi-LAT (Acero et al., 2013). The morphology of the source is consistent with a Gaussian of width . The source is contaminated by the emission of the nearby Supernova remnant (SNR) Kes 17 (G), but it is clearly seen above GeV. The emission region of the GeV counterpart of HESS J1303631 is as expected larger than the TeV source, but the morphology of the emission region is very similar and features an extension in the same direction as the TeV source. It should be noted, however, that the size of the GeV source might be slightly overestimated due to the contamination from Kes 17. Kes 17 is the closest known SNR to the pulsar PSR J13016305 located at the angular distance of (Wu et al., 2011; Gelfand et al., 2013). Assuming a distance to the pulsar of kpc (H.E.S.S. Collaboration et al., 2012), this corresponds to the projected distance between the pulsar and the SNR of 71 pc. This large distance makes the association of the SNR with the pulsar very unlikely as it would require an unrealistically high pulsar velocity of km/s for the characteristic age of the pulsar of 11 kyr (Manchester et al., 2005).
2 Observations
The ATCA observations of the region surrounding PSR J13016305 were conducted on September 5th, 2013. Observations were performed using the CABB receiver with the A configuration of the array (minimum and maximum baselines of 153 m and 3000 m, respectively) at and GHz frequencies and centred at , (J2000.0), at the angular distance of about from the pulsar position. The array configuration was chosen in order to match the resolution of the XMM-Newton observations of , while at the same time remain sensitive to structures comparable to the size of the X-ray PWN of . However, the maximum angular scales to which the observations are sensitive are slightly smaller than the size of the X-ray PWN, namely at 5.5 GHz and at 7.5 GHz, respectively.
The observations were carried out in two modes: CFB 1M (no zooms) - a bandwidth of 2 GHz with 2048 1-MHz channels in each intermediate frequency (IF) band and pulsar binning - the same but with the addition of pulsar binning according to the provided ephemerids. The on-source scan time was 656.5 min. Pulsar binning mode was used in observations in order to be able to correctly subtract the pulsar contribution to the total emission in order to determine the intrinsic emission from HESS J1303631. However, since no significant emission corresponding to HESSJ1303-631 was detected (see Section 3), the subtraction of the data taken in pulsar binning mode was not performed and thus these data were not used in this study. Primary (flux density) and secondary (phase) calibrators were J and J respectively. The flux density of J is Jy at GHz and Jy at GHz. The phase calibrator was observed every min. The observation recorded all four linear polarization modes. Details of the collected data are listed in Table 1.
In this paper we also considered archival ATCA data obtained during observations of HESS J1303631 centred at , (the position of the peak VHE -ray emission), and performed in the GHz and GHz bands. The archival data used in the analysis, taken as part of the Reinfrank et al. project C1557, are presented in Table 1. Only the archival data taken with all 6 antennas and with observational time longer than 100 min were used in the analysis. The source J was used as a primary calibrator with flux densities of Jy at GHz and Jy at GHz. The sources J and J were used for phase calibration. The maximum angular scale to which observations are sensitive is at GHz and at GHz.
| Date | Right Ascention | Declination | Time | Array | Frequencies | Bandwidth | Primary | Secondary |
|---|---|---|---|---|---|---|---|---|
| [min] | [MHz] | [MHz] | calibrator | calibrator | ||||
| 2013-Sep-05 | 656.5 | 1.5A | 5500, 7500 | 2048 | ||||
| 2006-Oct-25 | 433.8 | EW352 | 1384, 2368 | 128 | ||||
| 2007-Mar-13 | 618.1 | 750D | 1384, 2368 | 128 | ||||
| 2007-Apr-24 | 651.8 | 1.5C | 1384, 2368 | 128 |
3 Data Analysis and Results
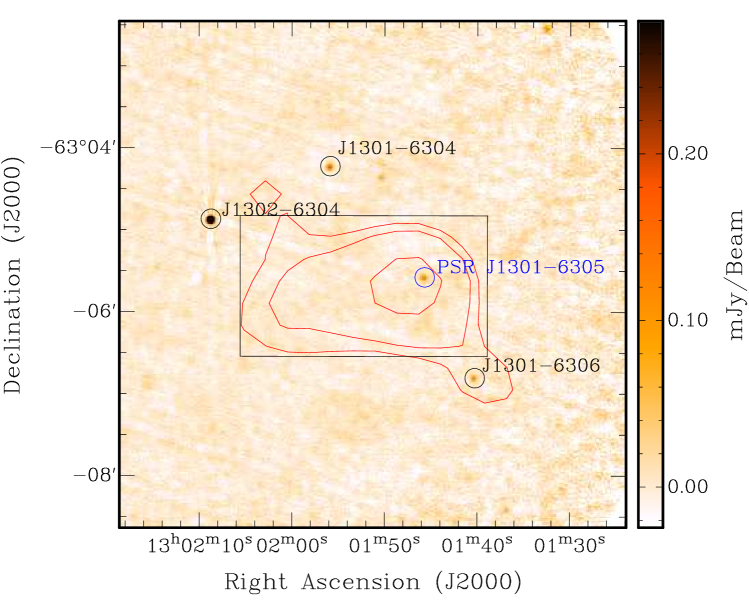
The data reduction and image analysis was performed using the miriad (Sault et al., 1995) and karma (Gooch, 1995) packages. The resulting clean primary beam corrected (restricted to the area of primary beam response above , which corresponds to the radial distance of ) image (Stokes I) at GHz is shown in Fig. 1. The pulsar PSR J13016305 is detected at the position , . No significant extended emission coincident with the pulsar position was detected. The fitted image root mean square (RMS) noise is calculated using the imsad task at the level of mJy/beam. The synthesised beam is an ellipse with the major and minor axes of and respectively and the positional angle of .
There is no extended emission coincident with the pulsar position detected at GHz as well. The fitted image RMS noise, calculated using the imsad task, is at the level of mJy/beam. The major and minor axes of the beam are and , respectively, and the positional angle is .
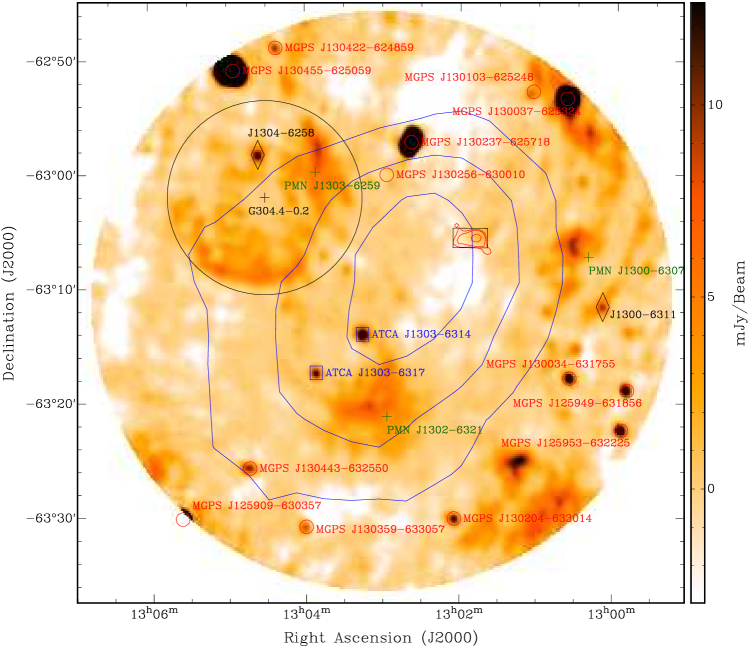
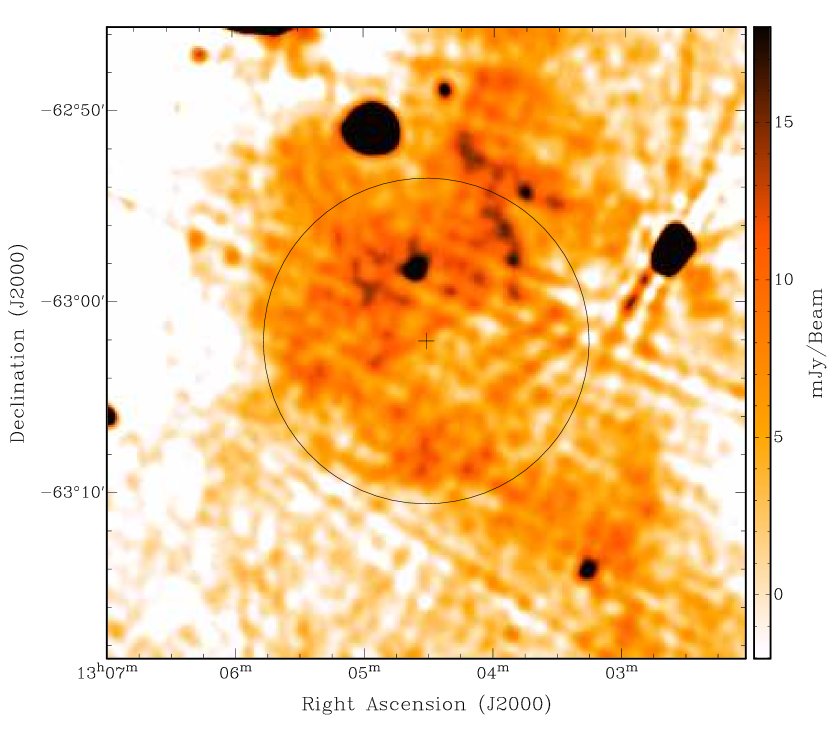
The analysis of the archival data at GHz and GHz which combine all the observations listed in Table 1 also does not reveal any significant emission coincident with the pulsar. The observations at GHz, however, reveal a detection of a shell-like structure to the east of the pulsar position which might potentially be an SNR (see discussion in Section 4.1). Figure 2 shows the cleaned and primary beam corrected (restricted to the area of primary beam response above , which corresponds to the radial distance of ) image at GHz. The SNR candidate G304.40.2 is positioned within the black circle. The centre of the structure is at , . The fitted image RMS noise is estimated to be mJy/beam. The major and minor axes of the beam are and , respectively, and the positional angle is . The brightest parts of the SNR candidate reach the significance of . It is difficult to draw any conclusions about a possible emission from the SNR candidate at GHz, as these observations are less sensitive to large scale structures, and only a fraction of the SNR candidate is located within the primary beam and the image is distorted by artefacts produced by the strong source MGPS J.
| Identifier | Right Ascention | Declination | X-ray counterpartsa | ||||
|---|---|---|---|---|---|---|---|
| [Jy] | [Jy] | [mJy] | [mJy] | ||||
| J1301-6306 | 127.2 | 118.3 | … | … | 3XMM J130138.2-630654b | ||
| J1302-6304 | 1448.0 | 1172.0 | … | … | none | ||
| J1301-6304 | 191.2 | 119.1 | … | … | none | ||
| J1300-6311 | … | … | 11.7 | … | 3XMM J130006.2-631207b | ||
| J1304-6258 | … | … | 11.3 | 5.7 | none |
-
a
There are also multiple infrared and/or optical sources that are consistent with the position of these radio sources.
-
b
Rosen et al. (2016)
3.1 Other sources in the observed region
Most of the sources detected in the field at GHz (Fig. 2), both compact and extended, have counterparts at other radio frequencies (Murphy et al., 2007; Condon et al., 1993; Schinzel et al., 2015). However, most of these sources are not classified, except MGPS J (G) which is identified as a HII region (Misanovic et al., 2002) and MGPS J which is coincident with an infrared bubble (Simpson et al., 2012). Extended emission at the south-western edge of the field is most probably related to the very extended source PMN J (Wright et al., 1994).
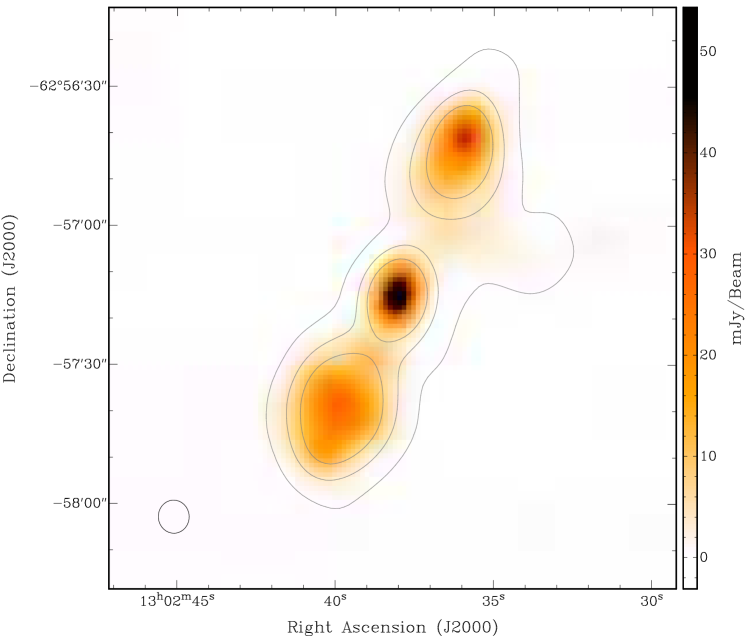
Observations at GHz and GHz might shed some light on the nature of the unidentified source MGPS J, which is also visible at other radio wavelengths (e.g. it is detected in the PMN survey). Both GHz and GHz data reveal a complex morphology with a central source and two lobes, strongly suggesting that MGPS J is an active galactic nucleus (AGN). Figure 3 shows the map at GHz overlaid with contours indicating significant emission from the source at GHz. Only the observations with the best angular resolution (2007-Apr-24) were used in this analysis. The fitted image RMS noise is mJy/beam at GHz (beam size: major and minor axes of and respectively with the positional angle of ) and mJy/beam at GHz (beam size: major and minor axes of and respectively with the positional angle of ). A fit to the observed emission at GHz and GHz was done using the imfit task with three Gaussian components. The integrated flux density from the central component is mJy and mJy at GHz and GHz, respectively. The flux densities from the southern and northern components are mJy and mJy at GHz and mJy and mJy at GHz. Unfortunately, the source is outside the primary beam for observations at GHz and GHz with much better angular resolution.
In the ATCA data presented here, 5 new point-like sources were detected in the region of HESS J1303631 (Fig. 1 and 2). Their locations and flux densities estimated using the imsad task are collected in Table 2. Only sources with significance above at both GHz and at GHz were considered. Each of these sources has one or more potential counterparts in infrared and/or optical catalogues (see e.g. Cutri et al., 2003; Wright et al., 2010; Benjamin et al., 2003; Monet et al., 2003). Two of them, J and J, have X-ray counterparts in the XMM-Newton catalog (Rosen et al., 2016). The source J is actually visible in the MGPS-2 (see Fig. 4 right) but is not listed in the catalogue probably because it is very difficult to separate its emission from the extended emission coincident with G304.40.2.
4 Discussion
The new radio observations reported in this paper were triggered by a hint of a signal () from a feature coincident with the X-ray PWN in the analysis of archival data from the PMN survey at 4.85 GHz (H.E.S.S. Collaboration et al., 2012). This feature is compatible to the resolution of the survey of (Condon et al., 1993). These deeper observations at 5.5 GHz and 7.5 GHz with ATCA were optimised for the detection of the putative radio PWN with a size comparable to the size of the X-ray PWN () while providing a resolution comparable to the one of XMM-Newton. The assumption of the size was motivated by the size of the possible radio feature and by the hypothesis that the size of both radio and X-ray PWNe is constrained by the region of high magnetic field around the pulsar. Indeed, 3D magnetohydrodynamic simulations of the Crab Nebula (Porth et al., 2014) show that the magnetic field strength close to the termination shock is an order of magnitude higher than the average magnetic field strength in the rest of the PWN. Moreover, in the left-behind relic nebula the magnetic field is expected to be relaxed with the magnetic field strength comparable to the interstellar medium (ISM) magnetic field of about G. However, neither new observations at 5.5/7.5 GHz nor the analysis of the archival data at 1.384/2.368 GHz show any evidence of extended emission coincident with PSR J13016305 and/or the X-ray PWN. It should be noted that the largest scales to which observations at 5.5/7.5 GHz are sensitive are slightly smaller than the size of X-ray PWN, at 5.5 GHz and at 7.5 GHz, and therefore we cannot rule out the detectebility of the putative radio PWN of the size of the X-ray PWN at these frequencies. However, observations at 1.384/2.368 GHz allow us to detect structures with an extension up to (1.384 GHz) and (2.368 GHz). Assuming the size of the X-ray PWN as reported in H.E.S.S. Collaboration et al. (2012) the upper limits on the radio flux density at GHz was estimated at the level of 3 time the RMS noise in the region of the X-ray PWN defined by a box (black box in Figs. 1 and 2). The upper limit on the flux density at GHz is mJy.
However, the size of the putative radio PWN might exceed the size of the largest angular structure resolved in the observations or even the size of the primary beam. GeV observaions (Acero et al., 2013) exhibiting a large size of the PWN () indicate that a large amount of relatively low energy relativistic electrons is spread out to large distances from the pulsar. If the size of the putative radio PWN is constrained by the existence of relativistic electrons, i.e. the magnetic field is strong enough for efficient synchrotron emission across the whole PWN, the radio PWN would be at least as large as the GeV PWN. The same electrons which emitt GeV -rays via inverse Compton scattering on ambient photon fields are also responsible for the generation of the radio emission via the synchrotron mechanism (see e.g. Vorster et al., 2013b, and references therein).
4.1 G304.40.2 - an SNR?
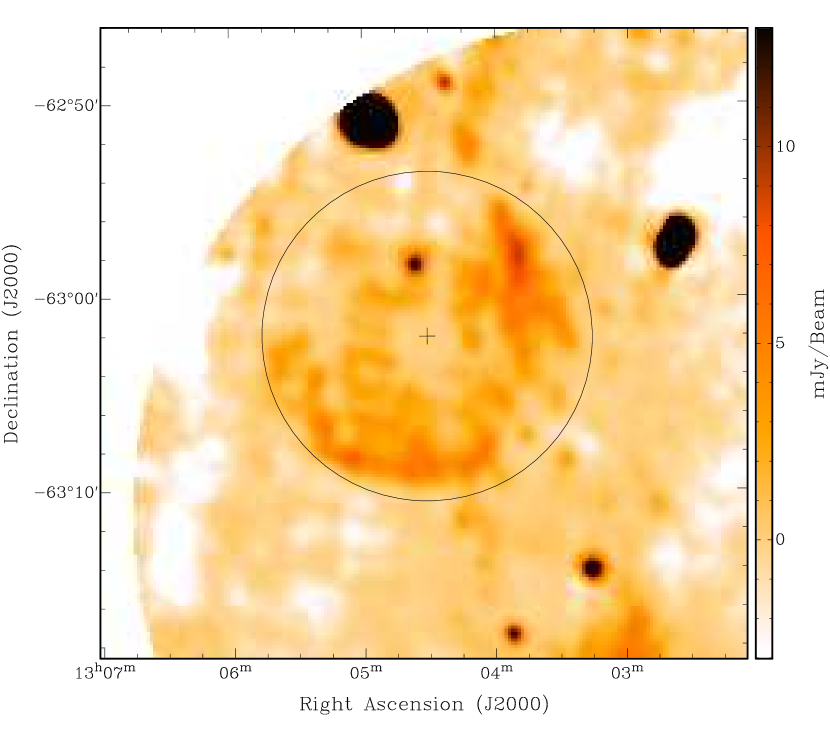
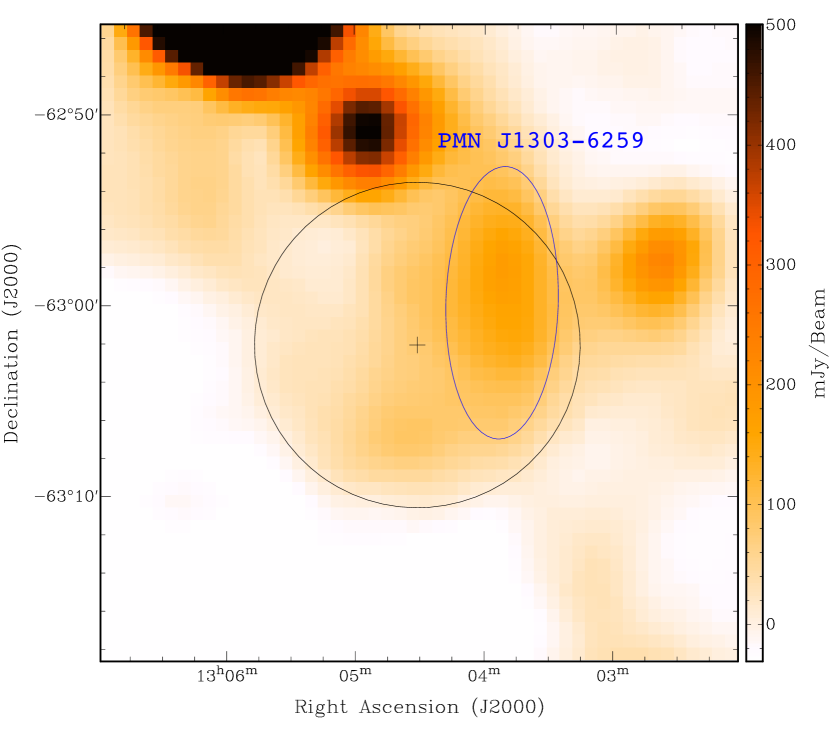
The extended structure, G304.40.2, detected to the east of the pulsar at 1.384 GHz exhibits a shell-like morphology. Such a morphology naturally suggests that this might be an SNR. G304.40.2 is coincident with PMN J13036259, an extended source detected in the PMN survey at GHz (Condon et al., 1993; Wright et al., 1994). The emission from PMN J13036259 was fitted with a two-dimensional asymmetric Gaussian with major and minor axis widths of and with a position angle of measured eastwards from the north direction (Griffith & Wright, 1993). The total flux density from the source is mJy at GHz (Wright et al., 1994). Although PMN J13036259 is coincident with the western part of the detected shell-like structure the map also reveals extended radio emission coincident with southern part of the shell (see Fig. 4 middle). Overall, the GHz map show a good agreement with the GHz morphology of the SNR candidate. To estimate a spectral index of the western part of the SNR candidate we smoothed the GHz map with a Gaussian with a width equal to the angular resolution of the PMN survey of and fitted the region of PMN J13036259 assuming the same extension of the source as obtained for PMN J13036259 using the miriad task imfit. The obtained flux density at GHz is mJy resulting in a spectral index of 111Flux density, , scales with frequency, , as , which is in a perfect agreement with a range of values observed for SNRs from to with a peak at around (Reynolds, 2011; Green, 2014) and very close to a canonical expected in the diffusive shock acceleration in the case of strong shocks with a compression ratio of 4 (see e.g. Dubner & Giacani, 2015, and references therein).
Neither the compact source catalogue nor the SNR catalogue of the second epoch Molonglo Galactic Plane Survey (MGPS-2) at MHz (Murphy et al., 2007; Green et al., 2014) provide any counterpart for the SNR candidate. However, the MGPS-2 image of the G304.40.2 region at MHz reveals a faint extended radio emission coincident with the SNR candidate, roughly following the GHz contours in the west and south regions but also exhibiting emission towards north-east (Fig. 4, right). The peak flux density reaches mJy/beam, well above the sensitivity of the survey of mJy/beam. The image is strongly distorted by artefacts produced by nearby bright sources which makes it impossible to classify the morphology of the extended emission. This might be the reason why the source did not appear in the list of the SNR candidates detected in the MGPS-2 survey as the search criteria include a condition on a morphology which has to be shell-like or composite (Green et al., 2014).
Infrared and optical observations, e.g. the Two Micron All-Sky Survey (2MASS) in the H-band (m; Skrutskie et al., 2006), do not show any extended emission from the region of G304.40.2. This further suggests that the radio emission from the SNR candidate is most probably non-thermal as expected for SNRs.
Available X-ray observations222All observations of the region of interest available at NASA’s HEASARC archive (https://heasarc.gsfc.nasa.gov/docs/archive.html) were examined including XMM-Newton, Swift, ROSAT, Chandra, and ASCA. of this region show no evidence of the large scale structures coincident with G304.40.2. This, however, does not contradict the SNR hypothesis. The absence of the non-thermal X-ray emission can be explained by a potentially old age of the SNR candidate (see below). Indeed, X-ray synchrotron emission from SNRs requires relatively high shock velocities of km/s to accelerate electrons to energies high enough, and these shock velocities are believed to be associated with young SNRs of yr (see e.g. Vink, 2012). Old age might also be a reason for the lack of the X-ray thermal emission. Slowing down of the shock to km/s in old SNRs of kyr results in cooling of the post-shock region to temperatures lower than required for the X-ray emission (see e.g. Vink, 2012). Some old SNRs, however, feature thermal X-ray emission from their interior which might be due to, for example, interaction with dense cloudlets, which survive the forward shock crossing and slowly evaporate inside the remnant due to saturated thermal conduction (see e.g. White & Long, 1991; Sushch et al., 2011). Another possible reason for the the lack of the thermal emission might be a low density of the ambient medium around the remnant. How low should this density be is, however, model dependent and depends on whether ionization quilibrium is sustained. Non-equilibirum ionization models coupled to efficient particle acceleration shows that X-ray thermal emission would dominate over synchrotron emission only for relatively high densities of about cm-3 (Ellison et al., 2007). The estimate of the density also depends on the distance to the remnant, which is not clear in this case. Finally, the lack of detection of X-ray emission from the source, both thermal and non-thermal, might be due to not sufficient sensitivity or exposure.
At -ray energies most of the field of view is covered by HESS J1303631 and it is impossible to distinguish any emission associated with the possible SNR.
It should be noted, however, that other possible interpretations of the detected extended emission cannot be firmly ruled out. Due to the faint emission the image of G304.40.2 appears to be pattchy making it difficult to firmly identify the shell-like morphology. The emission could also be contaminated by unrelated point sources and the image might be distorted by artefacts created by bright sources in the field of view. Since the shell-like morphology of the source is the strongest argument in favor of its SNR nature, we have to treat our conclusions with caution. The observed large scale structure might still be a composition of individual background sources and/or HII regions.
4.2 Possible birth place of PSR J13016305
If G304.40.2 is indeed an SNR it could be a birth place of the pulsar PSR J13016305. This hypothesis is supported by the direction of the X-ray “tail” which roughly points to the position of the SNR candidate (see Fig. 2). The pulsar is located outside the shell-like structure, which means that in case the SNR candidate is indeed the birth place of PSR J13016305, the pulsar has already escaped the remnant and continues to propagate in the ambient medium. The larger size of the PWN does not contradict this hypothesis as the present time nebula could have formed after the pulsar escaped the SNR. While the pulsar is still inside the SNR, its nebula is strongly disrupted by the reverse shock of the remnant (see e.g. Blondin et al., 2001; Vorster et al., 2013a) and at the moment of interaction with the shell it is very small. Moving outside the remnant the pulsar builds up a new nebula which can become very large due to the proper motion of the pulsar, i.e. left behind electrons, and diffusion of electrons in the medium. Escaping the SNR, the pulsar should also damage the shell of the remnant. Although the emission in the direction of the pulsar is slightly fainter exhibiting a gap in the shell, there is no clear evidence of distortion. This can be naturally explained if the pulsar is not moving in the projected plane but its velocity has a considerable component perpendicular to the projected plane. In this case the distorted part of the shell is facing the observer and is thus not visible. The angular distance between the pulsar and the centre of the SNR candidate of about corresponds to a projected distance of pc assuming the distance to the pulsar of kpc. This corresponds to a projected pulsar velocity of km/s for the characteristic age of the pulsar of 11 ky (Manchester et al., 2005). This velocity would make PSR J13016305 the fastest known pulsar. The highest pulsar velocity detected so far is km/s (Cordes & Chernoff, 1998). However, there are indications that some pulsars might be much faster, with velocities comparable to the estimate presented here for PSR J13016305. The estimate of the kick velocity of the possible pulsar IGR J is km/s (Tomsick et al., 2012), but the source nature cannot be unambiguously proven yet as no pulsations were detected so far. Also, the real age of PSR J13016305 might be higher than the characteristic age if the braking index is lower than , which is the case for 8 out of 9 pulsars for which the braking index has been measured reliably (Lyne et al., 2015; Archibald et al., 2016). In this case the estimate of the pulsar velocity would be lower.
Alterntively, the real age of the pulsar can be estimated as the age of its SNR. In case G304.40.2 is indeed an SNR and the birth place of the pulsar PSR J13016305, its size can provide an estimate for the pulsar age. Assuming a distance to the pulsar of kpc (H.E.S.S. Collaboration et al., 2012), the angular size of the SNR candidate of about corresponds to 30 pc in diameter. The Sedov solution (Sedov, 1959), which describes the hydrodynamical expansion of an SNR in the adiabatic stage of evolution into the homogeneous medium, provides an estimate of the SNR age for a given size of the remnant
| (1) |
where is the explosion energy, is the number density of the interstellar medium and is the radius of the remnant. This value is somewhat higher than the characteristic age of the pulsar of 11 kyr (Manchester et al., 2005), but does not contradict it if the braking index is lower than 3 (see above). If we assume that the real age of the pulsar is 16 kyr then the projected velocity would be km/s, which is still very high. It should be noted however hat the SNR age estimate is dependent on the ambient medium density which is often considerably lower than (even by orders of magnitude) and it is also very sensitive to the estimated physical size of the SNR. Therefore, this estimate of age should be taken with caution.
A pulsar with this high velocity will be moving supersonically in the interstellar medium creating a bow shock. A bow shock driven through the neutral gas can generate optical emission in the Balmer lines at the forward shock (Bucciantini & Bandiera, 2001; Bucciantini, 2002) and such emission is already discovered for a few pulsars in Hα. There is no evidence for such emission around PSR J13016305, which however does not necessarily contradict our hypothesis, since a lot of pulsars are believed to be moving supersonically and only for a few of them a bow-shock structure is detected at optical wavelengths. It should also be noted that Hα bowshocks and X-ray tails are rarely seen together (Kargaltsev et al., 2015). Inside the bow shock pulsar wind particles will be accelerated at the termination shock subsequently generating non-thermal emission synchrotron emission which can be detected in radio and X-rays (Gaensler & Slane, 2006). Although no extended radio emission associated with PSR J13016305 was detected (which can be simply because of the potentially large size of the radio nebula), the X-ray nebula does exhibit a bow-shock morphology with a tail pointing in the direction of G304.40.2 strongly suggesting that the pulsar is moving with high velocity.
5 Summary
ATCA observations of the HESS J1303631 region at GHz and GHz do not reveal any significant extended emission associated with PSR J13016305. Archival GHz and GHz data also do not show any evidence of a radio counterpart of HESS J1303631. Non-detection of this evolved PWN at radio wavelengths suggests that either the putative radio PWN is comparable to the size of the GeV counterpart and, thus, larger than the largest reliably imaged structure and even the primary beam of radio observations or that the magnetic field is rather low, which is in agreement with the evolved PWN identification as the magnetic field is expected to decrease with time in PWNe. The comparison of the X-ray emission to the TeV emission implies the average magnetic field in the PWN of G (H.E.S.S. Collaboration et al., 2012), which however does not exclude the possibility of enhanced magnetic field around the pulsar.
Archival GHz observations reveal a detection of a extended structure centred at the angular distance of from the pulsar. This extended structure might be an SNR and a potential birth place of the pulsar. If this is the case then the projected velocity of the pulsar would be km/s assuming the characteristic age of the pulsar. This would make PSR J13016305 the fastest known pulsar. However, the uncertainty of the true age of the pulsar can significantly change this estimate.
Acknowledgements.
We would like to thank the anonymous referee for valuable comments which strongly improved the paper. We would like to acknowledge the help of Marek Jamrozy (Astronomical Observatory of the Jagiellonian University of Kraków, Poland) and Michael Bietenholz (Hartebeesthoek Radio Observatory, South Africa; York University, Toronto, Canada) on understanding certain aspects of the ATCA analysis performed in the paper. The Australia Telescope Compact Array is part of the Australia Telescope National Facility which is funded by the Australian Government for operation as a National Facility managed by CSIRO. This paper includes archived data obtained through the Australia Telescope Online Archive (http://atoa.atnf.csiro.au).References
- Acero et al. (2013) Acero, F., Ackermann, M., Ajello, M., et al. 2013, ApJ, 773, 77
- Aharonian et al. (2005) Aharonian, F., Akhperjanian, A. G., Aye, K.-M., et al. 2005, A&A, 439, 1013
- Archibald et al. (2016) Archibald, R. F., Gotthelf, E. V., Ferdman, R. D., et al. 2016, ApJ, 819, L16
- Benjamin et al. (2003) Benjamin, R. A., Churchwell, E., Babler, B. L., et al. 2003, PASP, 115, 953
- Blondin et al. (2001) Blondin, J. M., Chevalier, R. A., & Frierson, D. M. 2001, ApJ, 563, 806
- Bucciantini (2002) Bucciantini, N. 2002, A&A, 393, 629
- Bucciantini & Bandiera (2001) Bucciantini, N. & Bandiera, R. 2001, A&A, 375, 1032
- Condon et al. (1993) Condon, J. J., Griffith, M. R., & Wright, A. E. 1993, AJ, 106, 1095
- Cordes & Chernoff (1998) Cordes, J. M. & Chernoff, D. F. 1998, ApJ, 505, 315
- Cutri et al. (2003) Cutri, R. M., Skrutskie, M. F., van Dyk, S., et al. 2003, VizieR Online Data Catalog, 2246
- de Jager et al. (2009) de Jager, O. C., Ferreira, S. E. S., Djannati-Ataï, A., et al. 2009, Proceedings of the 31st International Cosmic Ray Conference, arXiv:0906.2644
- Dubner & Giacani (2015) Dubner, G. & Giacani, E. 2015, A&A Rev., 23, 3
- Ellison et al. (2007) Ellison, D. C., Patnaude, D. J., Slane, P., Blasi, P., & Gabici, S. 2007, ApJ, 661, 879
- Gaensler & Slane (2006) Gaensler, B. M. & Slane, P. O. 2006, ARA&A, 44, 17
- Gelfand et al. (2013) Gelfand, J. D., Castro, D., Slane, P. O., et al. 2013, ApJ, 777, 148
- Gooch (1995) Gooch, R. 1995, in Astronomical Society of the Pacific Conference Series, Vol. 77, Astronomical Data Analysis Software and Systems IV, ed. R. A. Shaw, H. E. Payne, & J. J. E. Hayes, 144
- Green et al. (2014) Green, A. J., Reeves, S. N., & Murphy, T. 2014, PASA, 31, e042
- Green (2014) Green, D. A. 2014, Bulletin of the Astronomical Society of India, 42, 47
- Griffith & Wright (1993) Griffith, M. R. & Wright, A. E. 1993, AJ, 105, 1666
- H.E.S.S. Collaboration et al. (2012) H.E.S.S. Collaboration, Abramowski, A., Acero, F., et al. 2012, A&A, 548, A46
- Kargaltsev et al. (2015) Kargaltsev, O., Cerutti, B., Lyubarsky, Y., & Striani, E. 2015, Space Sci. Rev., 191, 391
- Lyne et al. (2015) Lyne, A. G., Jordan, C. A., Graham-Smith, F., et al. 2015, MNRAS, 446, 857
- Manchester et al. (2005) Manchester, R. N., Hobbs, G. B., Teoh, A., & Hobbs, M. 2005, AJ, 129, 1993
- Misanovic et al. (2002) Misanovic, Z., Cram, L., & Green, A. 2002, MNRAS, 335, 114
- Monet et al. (2003) Monet, D. G., Levine, S. E., Canzian, B., et al. 2003, AJ, 125, 984
- Murphy et al. (2007) Murphy, T., Mauch, T., Green, A., et al. 2007, MNRAS, 382, 382
- Porth et al. (2014) Porth, O., Komissarov, S. S., & Keppens, R. 2014, MNRAS, 438, 278
- Reynolds (2011) Reynolds, S. P. 2011, Ap&SS, 336, 257
- Rosen et al. (2016) Rosen, S. R., Webb, N. A., Watson, M. G., et al. 2016, A&A, 590, A1
- Sault et al. (1995) Sault, R. J., Teuben, P. J., & Wright, M. C. H. 1995, in Astronomical Society of the Pacific Conference Series, Vol. 77, Astronomical Data Analysis Software and Systems IV, ed. R. A. Shaw, H. E. Payne, & J. J. E. Hayes, 433
- Schinzel et al. (2015) Schinzel, F. K., Petrov, L., Taylor, G. B., et al. 2015, ApJS, 217, 4
- Sedov (1959) Sedov, L. I. 1959, Similarity and Dimensional Methods in Mechanics
- Simpson et al. (2012) Simpson, R. J., Povich, M. S., Kendrew, S., et al. 2012, MNRAS, 424, 2442
- Skrutskie et al. (2006) Skrutskie, M. F., Cutri, R. M., Stiening, R., et al. 2006, AJ, 131, 1163
- Sushch et al. (2011) Sushch, I., Hnatyk, B., & Neronov, A. 2011, A&A, 525, A154
- Tomsick et al. (2012) Tomsick, J. A., Bodaghee, A., Rodriguez, J., et al. 2012, ApJ, 750, L39
- Vink (2012) Vink, J. 2012, A&A Rev., 20, 49
- Vorster et al. (2013a) Vorster, M. J., Ferreira, S. E. S., de Jager, O. C., & Djannati-Ataï, A. 2013a, A&A, 551, A127
- Vorster et al. (2013b) Vorster, M. J., Tibolla, O., Ferreira, S. E. S., & Kaufmann, S. 2013b, ApJ, 773, 139
- White & Long (1991) White, R. L. & Long, K. S. 1991, ApJ, 373, 543
- Wright et al. (1994) Wright, A. E., Griffith, M. R., Burke, B. F., & Ekers, R. D. 1994, ApJS, 91, 111
- Wright et al. (2010) Wright, E. L., Eisenhardt, P. R. M., Mainzer, A. K., et al. 2010, AJ, 140, 1868
- Wu et al. (2011) Wu, J. H. K., Wu, E. M. H., Hui, C. Y., et al. 2011, ApJ, 740, L12