Long-term Evolution and Stability of Saturnian Small Satellites: Aegaeon, Methone, Anthe, and Pallene.
Abstract
Aegaeon, Methone, Anthe, and Pallene are four Saturnian small moons, discovered by the Cassini spacecraft. Although their orbital characterization has been carried on by a number of authors, their long-term evolution has not been studied in detail so far. In this work, we numerically explore the long-term evolution, up to yr, of the small moons in a system formed by an oblate Saturn and the five largest moons close to the region: Janus, Epimetheus, Mimas, Enceladus, and Tethys. By using frequency analysis we determined the stability of the small moons and characterize, through diffusion maps, the dynamical behavior of a wide region of geometric phase space, vs , surrounding them. Those maps could shed light on the possible initial number of small bodies close to Mimas, and help to better understand the dynamical origin of the small satellites. We found that the four small moons are long-term stable and no mark of chaos is found for them. Aegaeon, Methone, and Anthe could remain unaltered for at least Myr, given the current configuration of the system. They remain well-trapped in the corotation eccentricity resonances with Mimas in which they currently librate. However, perturbations from nearby resonances, such as Lindblad eccentricity resonances with Mimas, seem responsible for largest variations observed for Methone and Anthe. Pallene remains in a non-resonant orbit and it is the more stable, at least for 64 Myr. Nonetheless, it is affected by a quasi-resonance with Mimas, which induces long-term orbital oscillations of its eccentricity and inclination.
keywords:
planets and satellites: dynamical evolution and stability – planets and satellites: rings – methods: numerical1 Introduction
The Cassini space mission has been a highly successful
endeavor that helped to expand significantly our knowledge and
understanding of Saturn and its environment, both physically
and dynamically.
Among other important results,
several new moons around Saturn were discovered thanks to images taken
by the spacecraft. Four of such small moons, now called
Aegaeon, Methone, Anthe, and Pallene, lie between
the position of the co-orbital duet formed by Janus and Epimetheus,
at km from Saturn centre, and roughly the inner edge of the
E ring, where the moon Enceladus orbits, at km from Saturn
centre. Those small bodies
remain a challenge to be successfully characterized due to the
complex dynamical
environment they inhabit, nonetheless, such dynamical
environment has started to be explored. In the present work, we review
our current knowledge of the four small moons, and explore their dynamical
environment and evolution on a wider and longer basis than current
studies did.
Aegaeon was discovered and reported by Hedman et al. (2010).
It is a small moon of roughly
0.33 km in diameter (Thomas et al., 2013) that lies in the
middle of a prominent arc structure, located inside and
close to the inner edge of the
G ring. The G ring is a faint and thin ring formed
by m to cm sized particles (Hedman
et al., 2007), which extends from
to km from Saturn centre (Horányi et al., 2009).
Some particles forming the G ring presumably
emanate from collisions of micrometeoroids with the
largest objects of the region; like Aegaeon itself, however,
nowadays the origin
of the ring remains uncertain. As already mentioned, the G ring
possesses a unique bright
arc located close to
its inner edge, at km from Saturn centre, which covers
in longitudinal extend, while has just 250 km
of radial width. The arc is located at the 7:6 corotation eccentricity
resonance (CER) with Mimas. It has been assumed that this resonance
confines the longitudinal extent of the arc (Hedman et al., 2009).
Being the most prominent member of the arc of the G ring,
Aegaeon orbits trapped at the 7:6 CER with Mimas, with a
resonant argument given by
,
where and are the mean longitude and
longitude of pericenter, respectively. This resonant argument
librates with amplitude
around .
However, Aegaeon’s longitude deviates from the expected position,
if one only considers its libration due to the CER.
This small deviation has a
period of 70 yr, similar to the period of the Mimas longitude libration
due to a 4:2 mean motion resonance (MMR) with Tethys (Hedman et al., 2010),
therefore Tethys perturbs the orbit of Aegaeon through its
interaction with Mimas.
Furthermore, variations in Aegaeon’s eccentricity and inclination,
not related to the CER, indicate a possible influence of other resonances,
particularly the 7:6 Inner Lindblad Resonance (ILR), which resonant
argument is given by
.
This resonant argument librates, although not so tightly
as the argument of the CER,
with an amplitude of around zero
(Hedman et al., 2010); therefore the ILR could be inducing second or
higher order perturbations, not well
characterized so far.
Methone is a small moon of 1.45 km in diameter (Thomas et al., 2013).
First reported by Porco
et al. (2005), it is located at
km from Saturn centre. It inhabits inside an arc of
dust for which most probably it is the source (Sun
et al., 2017).
The arc’s longitudinal
extend is , roughly centered at the small moon.
Both Methone and its arc orbit near the 15:14 CER and the 15:14
outer Lindblad resonance (OLR) with Mimas (both resonances are
separated by just
4 km, El
Moutamid et al., 2014). Both resonant arguments of the 15:14
CER and OLR librate with amplitude around
zero. However,
the arc confinement is consistent with the maximum extension
permitted by the 15:14 CER with Mimas alone (Hedman et al., 2009).
Anthe is a tiny moon of an estimated 0.5 km in diameter;
a better define measurement has not been carried out to date,
due to the lack of resolution in Cassini images
(Thomas et al., 2013). Anthe is located at
km from Saturn centre. It was first reported by
Cooper et al. (2008), whom characterized its short-term dynamics.
They found that Anthe orbits close to an 11:10 outer resonance with Mimas,
with two librating arguments, one of which is associated with
the 11:10 CER with Mimas,
,
while the second one is given by
. Both periods of libration for these
arguments are 761 days (Cooper et al., 2008) and librate with amplitude
around zero.
Likewise Aegaeon and Methone, Anthe lies at the centre
of an arc of dusty material that extends
for , consistent with the confinement produced by the
11:10 CER with Mimas (Hedman et al., 2009).
Both arcs of Methone and Anthe have been deeply studied recently by
Sun
et al. (2017). They explored the evolution of
m sized particles
which origin is the ejecta produced by collisions of interplanetary
dust particles (IDP) on the surfaces of
the small moons. They then explored the dynamical evolution of the ejected
particles
considering an oblate Saturn, the gravitational perturbations of Mimas,
Enceladus, and Methone or Anthe, depending on the system, plus a number
of non-gravitational effects, such as solar radiation pressure, Lorentz
force, and plasma drag. The authors are able to reproduce some of the
properties of both arcs, such as their longitudinal extend and optical
depth,
although dust density in the simulations is an order of magnitude
smaller compared to estimations derived from observations.
According to Sun
et al. (2017),
particles smaller than 5 m are quickly removed from the arcs due
mainly to the action of plasma drag,
while larger particles could survive up to 100 yr in the arcs
before recolliding with the parent small moon or leaving the arc.
Regarding Pallene, also first reported by Porco
et al. (2005), it
is a small moon of
diameter 2.23 km (Thomas et al., 2013), orbiting at
km from Saturn centre. It shares its orbit with a
faint full ring of dusty material. This ring is only
visible at extremely high phase angles, implying that it is
formed by m sized particles. The Pallene ring is very thin,
with a vertical width of just 50 km. For comparison, Pallene
achieves vertical excursions
of km above Saturn’s equatorial plane,
due to its relatively large inclination. The ring is therefore
tightly constrained to the orbital plane of Pallene, sharing
the same inclination of the small moon (Hedman et al., 2009).
Regarding their dynamics, Spitale et al. (2006) suggested that both the
moon and its ring were probably in a 19:16 inner mean
longitude resonance with Enceladus, with resonant argument given by
. Meanwhile, Callegari &
Yokoyama (2010) argued for
a secular resonance relating Pallene and Mimas, with resonant
argument given by . Nonetheless, both arguments circulate,
with different periods, suggesting that Pallene is most probably
evolving out of any strong resonance. We provide some details
in sections 3 and 5.
The short-term dynamics of the four small moons have been explored
in a number
of works, mainly those concerning their discovery and orbit determination
from Cassini raw images. As we have recalled, Aegaeon, Methone
and Anthe orbit near CER with Mimas, while Methone and Anthe
also lie close to Lindblad resonances with Mimas. CER and Lindblad
resonances are separated by just some km and are very close to the mean
semimajor axis of Methone and Anthe. Motivated by this,
El
Moutamid et al. (2014) proposed a simplified analytical model, named
CoraLin model,
to explore the dynamics of test particles close to both
CER and Lindblad eccentricity resonances (LER), which can be applied,
under some assumptions, to these small moons.
The CoraLin model is a simplification of the Hamiltonian
for a restricted three body problem, where the large perturbing moon
is eccentric and the test particle orbits near a MMR of the
form , where is an integer. The model depends upon just two
free parameters. The first one, , is related to the
separation distance between the positions of the CER and LER, while
the second parameter, , is related to the mass and eccentricity
of the perturbing satellite. means that both CER and LER lie
at the same position,
and the Hamiltonian is integrable in this case. For both
resonances are separated enough as to not interfere with each other and
the Hamiltonian is quasi integrable.
Intermediate cases, leads to strong coupling between
the resonances, which in turn leads to a chaotic evolution of
the orbits.
The results from applying the CoraLin model to the small moons,
by inspecting the corresponding Poincaré surfaces of section, suggest
that Anthe is closer to the chaotic region than any of the other small
moons. Methone is farther from the chaotic region than Anthe,
while Aegaeon is the more stable, for being
far enough from the chaotic region.
Those small moons form a distinctively family of objects
which dynamics is dominated by CER and LER coupling resonances
(Cooper et al., 2015).
The only long-term exploration so far regarding the dynamics of the
small moons (except for Aegaeon), was carried out by Callegari &
Yokoyama (2010).
They performed yr numerical integrations of the orbits
of Methone, Anthe and Pallene under the influence of Saturn’s oblateness
until , and the gravitational perturbations from Mimas,
Enceladus, Tethys,
Dione, Rhea, and Titan. They found a high sensitivity on initial
conditions for both Methone and Anthe, suggesting that their evolution
could be chaotic, while Pallene seems to be very stable. The authors
suggest a possible resonance involving the longitudes of pericenter
and ascending nodes of Pallene and Mimas, however, as previously
noted, such resonant argument does not librate, but
circulates with a long period, as we will verify in sections
3 and 5.
Regarding their physical characteristics, the Cassini images have revealed
smooth surfaces for two moons, Methone
and Pallene, for which there are enough resolution in the images.
It is expected that both Aegaeon and Anthe share
the same feature, i.e. a smooth surface; this because of their
proximity, size and
likely same formation process. Moreover, since the discovery of
the arc/ring structures associated with the small moons, the source
of the micrometric material forming such structures
has been assumed to be the escaped debris particles produced
when IDP collided on the surface of the small moons. Due to their
small size, their escape velocity is very low, letting
almost all impact ejecta freely evolve out of the surface of
the small moon into
the arcs/ring. However, a considerable proportion of those dusty
particles end up colliding again with the moons, smoothly
depositing themselves on the surface of the small moons, thus being likely
responsibly for the even surfaces observed. Numerical
evidence for such scenario can be found in Sun
et al. (2017).
In this paper we explore the long-term evolution of the four small
moons, exceeding any previous integration of their orbits. We also
explore, with thousands of test particles, a wide region of the
geometric phase space of semimajor axis, , vs
eccentricity, , surrounding the small moons, to gain a global
understanding of the dynamical behavior and evolution of such
regions where arcs/ring structures coexist.
This paper is organized as follows: in section 2 we
describe the frequency analysis technique and the simulations
used in this work. Section 3
is devoted to the short-term evolution of the small moons, while
in section 4 we present
several diffusion maps, based on frequency analysis, which characterize
the dynamical behavior of all the regions of interest. In section
5 we present our main results regarding the
long-term evolution of the small moons. Finally, in section 6
we enumerate our main conclusions.
2 Methods and Numerical Simulations
| Name | GM (km3 s-2) | (g cm-3) | (km) | Reference |
|---|---|---|---|---|
| Janus | 1.2656324971531704E-01 | 0.63 | 89.2 | Thomas et al. (2013) |
| Epimetheus | 3.512421991952764E-02 | 0.64 | 58.2 | Thomas et al. (2013) |
| Aegaeon | 1.2606299971854121E-09 | 0.54 | 0.33 | Thomas et al. (2013) |
| Mimas | 2.502784093954375E+00 | 1.15 | 198.2 | Cooper et al. (2015) |
| Methone | 6.261297469640338E-08 | 0.31 | 1.45 | Thomas et al. (2013) |
| Anthe | 2.334499994563023E-08 | 0.35 | 0.5 | Thomas et al. (2013) |
| Pallene | 1.7980185560068351E-07 | 0.25 | 2.23 | Thomas et al. (2013) |
| Enceladus | 7.211597878640501E+00 | 1.6 | 252.6 | Cooper et al. (2015) |
| Tethys | 4.121706150116760E+01 | 0.956 | 537.5 | Cooper et al. (2015) |
| Constant | Value | Reference |
|---|---|---|
| GM (km3 s-2) | 3.793120706585872E+07 | Cooper et al. (2015) |
| (km) | 60,330 | Cooper et al. (2015) |
| 1629.054382E-05 | Hedman et al. (2010) | |
| -93.6700366E-05 | Hedman et al. (2010) | |
| 8.6623065E-05 | Hedman et al. (2010) |
2.1 Frequency Analysis
Frequency analysis is a powerful technique to quantify the weak chaotic
behavior of a dynamical system with arbitrary degrees of freedom.
Since its original formulation by Laskar (1990, 1993), who develop it
in order to prove the chaotic nature of the solar system’s secular
evolution, it has been successfully applied to a wide variety of
dynamical problems, going from planetary sciences
(Nesvorný
& Morbidelli, 1998; Robutel &
Laskar, 2001)
to galactic dynamics (Papaphilippou
& Laskar, 1998; Valluri &
Merritt, 1998),
and even through fundamental particle physics
(Nadolski &
Laskar, 2003; Papaphilippou, 2014).
The frequency analysis algorithm developed by Laskar, look for the fundamental frequencies of the system resulting from a numerical integration. A brief sketch of the method and, at the same time, a justification for its use, can be stated as follows (Laskar et al., 1992): consider the Hamiltonian of an integrable dynamical system, ; once the system is reduced to action angle variables, , the Hamiltonian will depend only on the actions, , where for a system of degrees of freedom. We know that actions are constants of the motion, , while angles evolve according to:
| (1) |
where the are the fundamental frequencies of the motion.
In numerical experiments, we will rarely work on action angle
variables, nonetheless, we can still consider some close related
dynamical variables, say , of the form:
, where
, this is,
any variable will be a certain function, , close to unity,
that depends on the actual actions and angles of the system. Although
are not the action angle variables, the analysis of
will still give us the fundamental frequencies, , since
for periodic and quasi periodic motions, these frequencies
will remain constant.
If we recover the fundamental frequencies in different
intervals of a numerical integration, we will be able to determine the
existence of periodic motion, if frequencies remain almost constant,
or on the contrary, if largely variable frequencies are found,
the implication is
an irregular, maybe chaotic motion. This is because, by inverting
Eq. 1, we can state that ,
therefore
variable frequencies imply variable actions.
We are not interested in recovering the analytical representation of
particles orbits in our region of interest. On the
contrary, we are interested in the variations of their motions due
to different perturbations, thus we focus on the global
variations of the frequencies and not in their specific values.
In this work we calculate the main frequency, , of the
quantity , from a time
series dataset resulting from a numerical integration. To obtain the
frequencies we use
the frequency modified Fourier transform (FMFT) algorithm, described in
Šidlichovský & Nesvorný (1996), made publicly available by the author
111https://www.boulder.swri.edu/~davidn/fmft/fmft.html.
According to Robutel & Laskar (2001), the main frequency of will be related to the mean motion, , of the orbit. A full representation of through frequency analysis would be:
| (2) |
where in the case of pure Keplerian motion. As this is not the case, both and are close, but not equal, to the initial semimajor axis and mean motion, respectively. Nonetheless, the amplitudes of the following terms are 100 to times smaller for quasi-periodic trajectories, therefore, variations in the main frequency, , will be enough to provide an estimation of the orbit’s stability.
2.2 Numerical simulations
In order to obtain a global dynamical perspective
of the region inhabited by Aegaeon, Methone, Anthe,
and Pallene, we performed
short-term (18 yr) numerical simulations
of thousands of test particles that initially
cover the entire vs geometric phase-space,
from the orbit of
Janus-Epimetheus, to beyond the orbit of Enceladus. The choice
of our integration time relies on a compromise, between the large
volume of data produced and the requirement of enough orbital periods
to accurately calculate the main frequencies for our analysis. In
18 yr Mimas performs orbital revolutions around
Saturn, while
Enceladus, close to the exterior limit of our maps, performs
revolutions, i.e. we obtain enough orbital revolutions for all particles
for an accurate recovery of their frequencies.
Test particles are subject to gravitational perturbations from the oblateness
of Saturn up to in zonal harmonics,
plus the five largest moons of the region, namely
Janus, Epimetheus, Mimas, Enceladus, and Tethys, in a first set.
In later simulations we consider the gravitational perturbations
from Saturn and the large five moons, as well as the gravitational
perturbations from the four small moons. After the global exploration,
we zoomed in towards those regions closer to each small moon, performing
simulations that include thousands of test particles
covering a smaller patch of the geometric vs
phase-space, but in finer steps. We
provide the details for each simulation along with the results in the next
section.
In section 5, the results for a single long-term
( yr) numerical integration are reported,
where only the interaction between the five large moons and the four
small moons, orbiting an oblate Saturn, is considered.
All of the numerical simulations presented in this work were performed
using the Bülirsch-Stöer integrator from the MERCURY package
(Chambers, 1999), where a toleration accuracy parameter was set to
and an initial time-step of day was used.
Most of the simulations were performed at the Saturn Cluster
belonging to the Group of Planetology and
Orbital Dynamics of the Mathematics Department of the São Paulo State
University (UNESP).
3 Short-term Dynamics
| Parameter | Janus | Epimetheus | Mimas | Enceladus | Tethys |
|---|---|---|---|---|---|
| (DMim) | 0.816224821915373 | 0.816481357153813 | 1.00001997053844 | 1.282926463121003 | 1.588211135154469 |
| (km) | |||||
| 0.006783798913451 | 0.009648290023497 | 0.01935393988488 | 0.004717750162711 | 0.000318152308649 | |
| (∘) | 0.163561569028246 | 0.351528831169069 | 1.56783494576081 | 0.004011975196723 | 1.091284647139937 |
| (∘) | 6.132967855641644 | 116.348018800562642 | 88.06783652593947 | 57.40490801677754 | 29.38263145675355 |
| (∘) | 6.369960248480534 | 44.525088430924164 | 239.785329147143301 | 337.68709939428453 | 141.711912205570002 |
| (∘) | 129.813146812610796 | 263.577236051360842 | 318.616779106079946 | 217.90585212208282 | 271.834917459084238 |
| Parameter | Aegaeon | Methone | Anthe | Pallene |
|---|---|---|---|---|
| (DMim) | 0.90274553988027 | 1.046749724679189 | 1.065312819759956 | 1.144147730931239 |
| (km) | ||||
| 0.000312629006216 | 0.000781255131993 | 0.000980088315003 | 0.003986601194199 | |
| (∘) | 0.002368099675087 | 0.010191700663056 | 0.018728031233752 | 0.181964040454351 |
| (∘) | 240.784600532626655 | 101.055122930558355 | 196.379681976898155 | 320.254677876382459 |
| (∘) | 246.490855111672857 | 150.999808094857514 | 115.172628200709838 | 131.420435093503784 |
| (∘) | 325.21506542212154 | 205.403404370634803 | 159.569919065624163 | 293.49347042844056 |
To test the robustness of the initial conditions used in all of our
simulations, we performed a detailed short-term integration, lasting
for 24 yr, in order to reproduce the resonant dynamics of
Aegaeon, Methone, and Anthe, as has been found
by previous authors. This simulation includes the nine moons
presented in Table
1, plus Saturn and its gravity coefficients given in
Table 2.
The initial conditions for all the bodies
were taken from the Horizons website for the Julian Day
, which corresponds to the
date August 01, 2016. The geometric elements used as
initial conditions for the nine objects which constitute the n-body
part of the simulations,
are shown in Tables 3 (for the five large moons)
and 4 (for the four small moons), where
all variables have their usual meaning of: geometric semimajor axis, ,
geometric eccentricity, , geometric inclination, ,
longitude of pericenter,
, longitude of the ascending node, , and mean
longitude, . In Tables
3 and 4,
DMim stands for the normalized geometric semimajor axis of Mimas,
D, used as a reference
distance unit throughout this work. In physical units
D km.
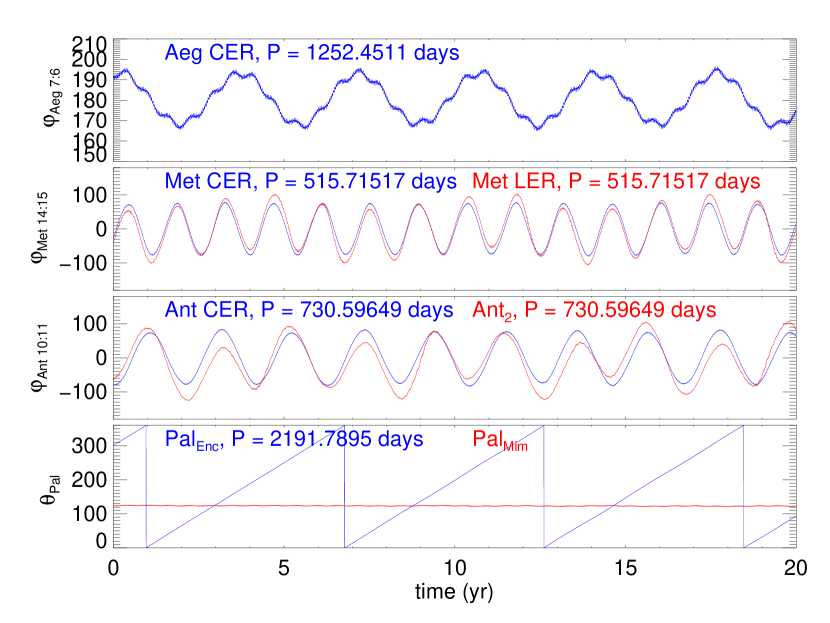
The most important constraint for the dynamics
of the small moons is the resonant dynamics associated with several
resonances, among them the CER and LER
with Mimas. In Fig. 1 we show the short-term
evolution of
the resonant arguments for Aegaeon, Methone, and Anthe resonances.
In addition, we plotted the evolution of the two arguments associated with
the quasi-resonances of Pallene with Enceladus and Mimas, as suggested
by Spitale et al. (2006) and Callegari &
Yokoyama (2010), respectively.
Hedman et al. (2010) found that Aegaeon is trapped in the 7:6 CER with Mimas,
with a libration argument , a
period of libration around 180∘ of days, and
amplitude of . We found (top panel of Fig. 1)
a libration period of
days, a difference of only 0.9% with the previous
result, and the same libration
amplitude of 10∘ around 180∘.
For Methone, both Spitale et al. (2006) and Jacobson et al. (2006) found a
libration argument , a
period of libration of 450 days, and an amplitude of the
residual longitude of
. This argument corresponds to the 15:14 LER with Mimas.
Nonetheless, Hedman et al. (2009) also found that the argument
associated to the 15:14 CER with Mimas, , also
librates with the same period and amplitude as the one associated
with the LER. This means than Methone is perturbed by both the CER and
the LER with Mimas, which are separated by just 4 km. We
found that effectively both arguments for the CER (blue curve in second panel
of Fig. 1) and the LER (red curve in same panel) of Methone,
librate, and we have normalized the
two arguments for them to librate around zero, in order to compare their
amplitudes, which is around 90∘. Their period of libration is
of 515.7 days,
a difference of 14% with previous results. Such
differences could
be the result of the updated orbital data and masses we have
used. An
evidence in this sense is the recent result found by Sun
et al. (2017)
for the Methone libration period of the CER. They found this period
to be days and an amplitude of the residual longitude of
. The result of Sun
et al. (2017) is in better agreement
with ours, since they used updated data from the Horizons system
of the Jet Propulsion Laboratory, as we did.
In the case of Anthe, Cooper et al. (2008) found two resonant arguments that
librate, one is the associated with the 11:10 CER with Mimas,
, and the second
argument is given by . For both arguments, Cooper et al. (2008)
found a period of libration of 761 days and an amplitude of
78∘. We find for both arguments (blue and red curves in
third panel of Fig. 1) a period of days,
a difference of
just 4% with the previous result, with an amplitude of libration of
.
Hedman et al. (2009) and Sun
et al. (2017) argue for the 11:10 CER of Anthe with
Mimas to be responsible for the confinement of the Anthe’s arc,
being then the most relevant for the evolution of the moon and
its environment.
Finally, although Pallene is not in resonance neither with Mimas or
Enceladus, both Spitale et al. (2006) and Callegari &
Yokoyama (2010) suggest
two different arguments that circulate and could indicate a
quasi-resonance of Pallene with any of those large moons.
First, Spitale et al. (2006) suggest the
argument: , a 19:16 inner mean
longitude resonance between
Pallene and Enceladus, as responsible for the long-term
variations in the orbital elements of Pallene. On the other hand,
Callegari &
Yokoyama (2010) argue for an argument given by
, which implies a relation between
Pallene and Mimas, based on the high stability found by the authors
in their long-term simulations. They obtain a period of circulation
of yr. We find that in fact both cited
arguments circulate, where the one involving Pallene and Enceladus
has a period of circulation of days (blue curve in bottom panel
of Fig. 1), while the second argument, involving Mimas and
Pallene, although at first glance could seem as librating (see red curve
in Pallene’s panel), it actually
circulates but with a much larger period, not visible in this
short-time scale plot. We show the circulation of this second argument in
section 5, for which we find a period of yr,
a difference of 7.6% compared with Callegari &
Yokoyama (2010)
work.
4 A Global Dynamical Perspective Through Frequency Analysis Maps
4.1 The Full Region Around Mimas
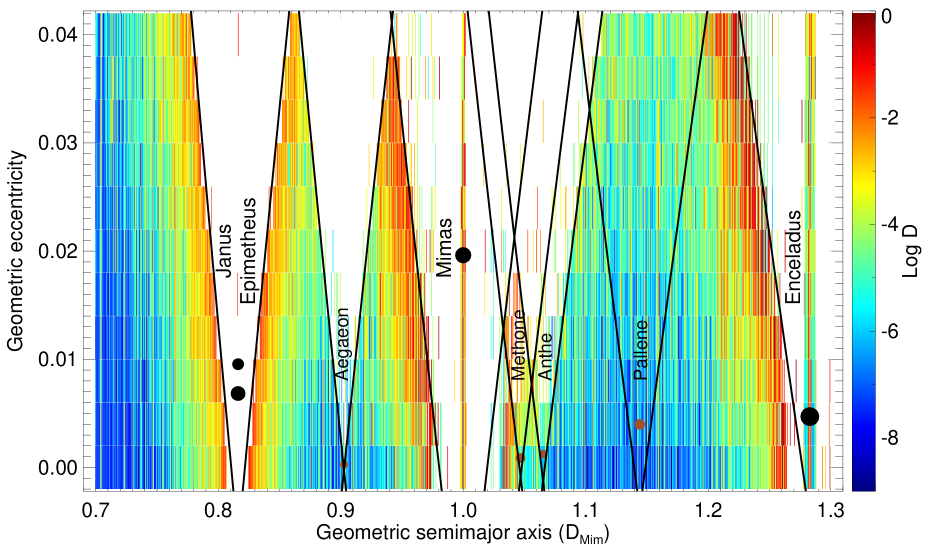
The aim of this section is to delineate
the lookalike of a wide dynamical region around Mimas, going from
0.7 to 1.3 , to better understand the influences that
can drive the evolution of the small moons and their ring/arcs. In
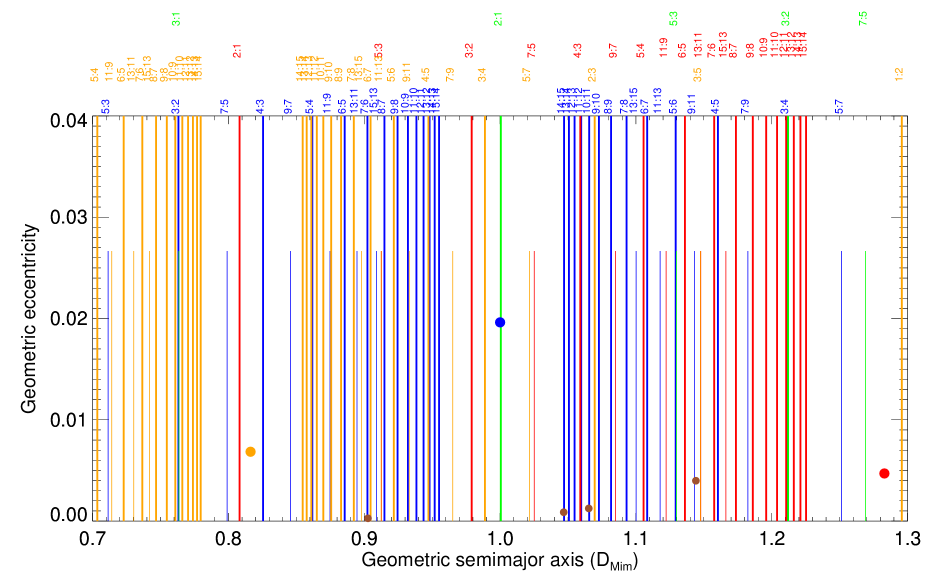
Fig. 2 we plot the location of all first and second
order MMRs with Janus, Mimas, Enceladus, and Tethys, present in this
region of the Saturnian system. All this resonances are somewhat
responsible for the shaping of structures, cleaning or maintaining
of the particles in the region, which are subject to gravitational
forces only. Although it is well-known that all Aegaeon, Methone,
Anthe, and their associated arcs lie in CER with Mimas, here we
provided a global framework for further detailed explorations
near any specific MMR of interest, where other kinds of dynamics could
better fit to the particular case, such as corotation or Lindblad
resonances.
The global dynamical picture of the full region was obtained
from the detailed numerical
integration during 18 yr of test
particles distributed in a rectangular grid, covering the geometric
phase-space of vs . In ,
initial conditions are taken from
0.7 to 1.3 DMim in steps of .
In we cover from 0 to 0.04 in steps of .
In all this work we explore the evolution of particles initially
in the Saturn’s
equatorial plane (thus all test particles
have initially zero inclination). As for the remaining
orbital elements of each particle,
, , and , they are set to zero,
following the approach of Robutel &
Laskar (2001) in their global exploration
of the dynamics of the solar system. Indeed, the variations of the angular
elements (, , and ) do not change significantly
the results for the diffusion of the particles outside resonances (which
constitutes most of the dynamical space in all our experiments).
Such variations lead only to different capture rates for
particles which are initially close to MMRs and therefore
are subject to get trapped. In this sense, angles’ values are important
mainly because they determine the width of the libration regions
of MMRs. Nonetheless, in our case, as we only explored very low
eccentricities, the width of MMRs is, as we will see, very thin,
thus the contribution from variations of the angles is negligible.
All test particles are subject to the non-spherical potential of
Saturn up to an order in zonal harmonics, plus the
gravitational perturbations of
the five large moons close to the region, namely Janus, Epimetheus,
Mimas, Enceladus, and Tethys, in the first set. For the second set
we also added the gravitational perturbations from Aegaeon,
Methone, Anthe, and Pallene.
To account for the rapid
orbital oscillations due to the oblateness
of Saturn, the state vectors resulting from the integrations are
everywhere transformed to
geometric elements following Renner &
Sicardy (2006).
In order to construct the frequency analysis map we explore the evolution
of the quantity , for each particle,
where is the geometric
semimajor axis and is the mean longitude of the orbit. We have
yr, equivalent to half the total
integration time. We applied the FMFT (Šidlichovský & Nesvorný, 1996)
over on the adjacent time intervals, and ,
in order to compare the main frequencies of , and
, from each time interval.
Since we are interested in the global dynamical structure of the region, we focus on the diffusion parameter, , for each particle, defined following Robutel & Laskar (2001) and Correia et al. (2005), as:
| (3) |
The parameter provides a measure of the particle’s orbit
stability. Some particles do not survive the whole simulation and
we do not compute for them. For unstable particles,
that nonetheless survive until the end of the simulation,
the difference will be significant,
leading to large values of . On the contrary, for stable particles
the same difference will be small, leading to very small values of .
An estimation
of a diffusion time-scale, , this is, an estimation
of the time required until an appreciable change in the of the
particle is
observed, or the time required for
a diffusion of the orbit in the radial direction, can be crudely
estimated as
yr, where is the period of the orbit in yr.
The FMFT algorithm let us to measure with confidence the variations
of and , in the very short-time integrations
performed. In order to characterize the dynamical region of
interest, we have plotted, in a color scale, the for
each particle, according to its initial position in the geometric
vs phase-space plane. The
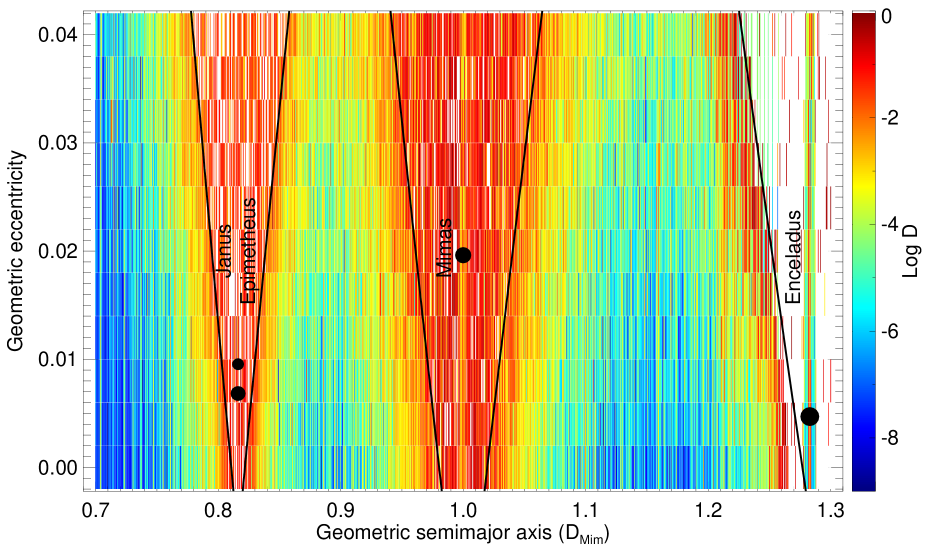
resulting map of the entire region is shown in Fig. 3.
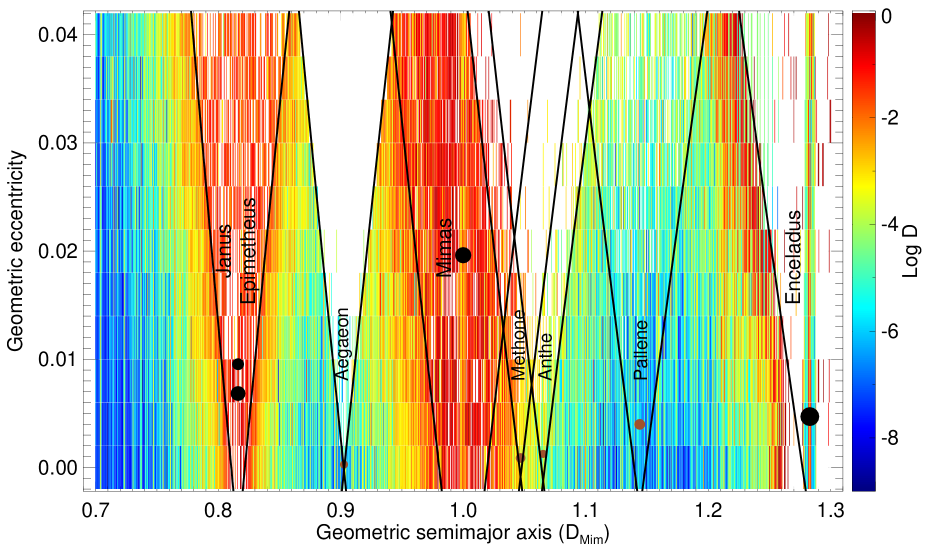
To highlight the relevance of the small moons
over their environment, an analogous map to that of Fig. 3
is shown in Fig.
4. This map was obtained from the integration of
the same set of test particles subject to the gravitational
perturbations from the five large moons, plus the four
small moons: Aegaeon, Methone, Anthe, Pallene, and an oblate Saturn.
The maps presented in Figs. 3 and 4,
show the general dynamical characteristics of the
region. In both figures, black lines delimit the
position of constant pericenter
and apocenter of test particles, at the positions of the apocenter
and pericenter
of each major body, respectively. In Fig. 3, the
positions of the four large moons are pointed by
filled black circles. Near the coorbital moons
Janus-Epimetheus, the constant pericenter and apocenter lines are
those corresponding to
the position of Janus’ apocenter and pericenter, respectively, as it
is the more massive moon of the two coorbitals. For Mimas,
both curves of constant apocenter and pericenter are plotted. For
Enceladus, only the line delimiting the constant apocenter of particles at
the position of Enceladus’ pericenter is shown.
The redder colors in both maps are enclosed by such black lines.
Particles that enter, or that are initially located inside such
regions, are strongly perturbed
by the major bodies, resulting in a major probability for them to
collide with the corresponding moon, thus being lost from the simulation.
In the map of Fig. 3 most particles inside
the Enceladus region are removed before
the end of the simulation, while much less
particles are removed inside the regions of Mimas and
Janus-Epimetheus. However, some of the particles inside the Enceladus region
survived, remarkably those that are coorbital with the large moon.
A small patch of stability is also seen for particles of
small eccentricity, coorbital with Mimas, while no evident
coorbital stability region is seen inside the
Janus-Epimetheus region. Outside of the regions delimited by black
lines, the more stable particles are those of small eccentricity,
expected since they do not cross the orbit of any large moon.
Regarding particle collisions with the large moons we
see that, for the simulation shown in Fig. 3,
due to the Mimas larger eccentricity, compared to
that of Enceladus or Janus and Epimetheus, it takes
longer time for Mimas to clean up its region despite its large size.
From the particles initially
inside the Mimas region, only 12% of them collided with the
large moon.
The surviving particles have an average .
This implies a diffusion time of
yr, considering the orbital period of Mimas.
For Enceladus we found 885 particles initially inside
its region, out of which almost 70% collided,
and the surviving particles are mainly coorbitals
with the large moon. The surviving particles have an average
, which implies a
yr, considering the period of Enceladus.
Finally, in the region dominated by
Janus-Epimetheus, out of the 806 particles initially inside
the corresponding region, around 36% collided with any of the large
moons. The average of the surviving
particles leads to a diffusion time of yr,
by considering the period of Janus.
In the simulation shown in Fig. 4,
Aegaeon, Methone, Anthe, and Pallene were
included as n-bodies. The
positions of the four
small moons are indicated by brown circles in the map. All lines for
constant pericenter and apocenter of test particles at the positions
of apocenters and pericenters of the large and small moons are shown in
black solid lines. In this case, a greater number of
particles is removed
from the collision regions (those enclosed by solid black lines)
leading to the appearance of big white zones. As
in the previous case,
inside these collision regions, some coorbital particles survive,
mainly with Enceladus and with Mimas to a lesser extent.
The results from the map of Fig. 4 suggest
that the small eccentricity of Aegaeon, Methone, and Anthe, let them to
better clean up their orbits in a short period of time
(18 yr), when compared to the much more
massive Janus, Epimetheus, or Mimas. Nonetheless, inclinations
likely play also an important role for the clearing ability of the
moons. To test this, we perform a simulation with the same conditions
of that of Fig. 4, but this time with the
initial inclinations of all the
nine moons set to zero. The result is shown in the map of Fig.
5. Clearly, when the moon lies in the orbital
plane, it better clear its path, this is manifest in the large white
regions inside the black lines limiting the regions of Janus-Epimetheus and
Mimas. Moreover, the coorbital stability region is clearly visible now
for Mimas, and two high eccentricity coorbitals with Janus-Epimetheus
also survive. In the case of Aegaeon, Methone, and Anthe, the changes are
insignificant as all they had from the beggining a small inclination
(). The same lack of change is observed for Enceladus,
which has an .
Therefore, moons of small eccentricity and inclination
clean their orbits efficiently, regardless their mass (see Aegaeon,
Methone, Anthe, and Enceladus), and coorbital particles with the
lowly inclined moons are more likely to survive. On the other hand,
moons with larger eccentricities and inclinations require longer
times for the clearing of their orbits despite their large masses
(see Janus-Epimetheus, Mimas, and Pallene), and coorbital particles
are not likely to coexist with them due to a large inclination.
Interestingly for Pallene, from the previous exercises we
have gained an important hindsight about the high stability of the region
surrounding this small moon. The combination of a small mass and
a large inclination () make Pallene a
weak perturber and inefficient clearer of its region.
In order to explore in detail the dynamical environment of the
small moons, we mapped the geometric phase-space around them,
zooming from the general view
into three finer maps, one around Aegaeon, a second around
Methone and Anthe, and one more around Pallene. Although
the simulations last the same amount of time as the ones describe
earlier, the coverage of and is far better. We describe the
initial conditions used for each map in the next subsections.
4.2 The Dynamical Environment of Aegaeon
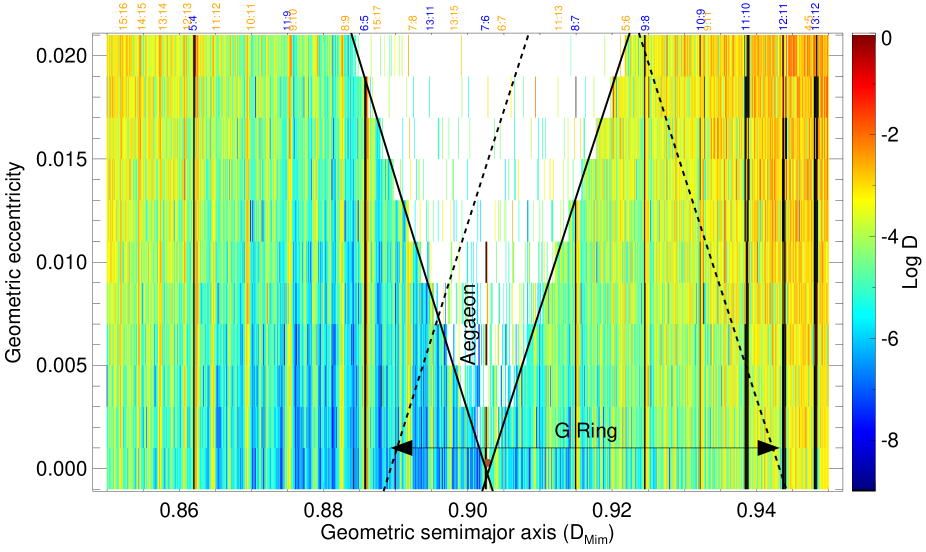
To get a better understanding of the dynamical evolution of Aegaeon and
particles nearby, like the ones forming the G ring,
we perform the numerical integration of the orbits
of test particles, covering a small
patch of the geometric vs phase-space around the small moon.
In we cover
from 0.85 to 0.95 DMim, in
steps of . In we cover from
0.0 to 0.02 in steps of . Initial inclination
and the angles , , and ,
are all set to zero. Test particles are subject to gravitational
perturbations from the oblateness
of Saturn up to , the five large moons of
the global case described earlier, and
Aegaeon, included as a massive body of g, assuming
a bulk density of g/cm3 (Thomas et al., 2013). The
resulting diffusion map is showed in Fig. 6.
The average
location of Aegaeon is shown in the map of Fig. 6
by a filled brown circle. This location is close but not
equal to the location of the 7:6 MMR, as Aegaeon librates in the 7:6
CER with Mimas. The
long-term dynamics of Aegaeon in this resonance will be further analyzed
in section 5. In this map, black solid lines
indicate the constant apocenter and pericenter distances of particles,
at the position of Aegaeon’s pericenter and apocenter, respectively. Most
of the particles inside this region end up colliding with the small
moon before the end of the simulation, which results in a wide
white triangle feature. Initially, particles were inside
the region enclosed by solid black lines, while just 303 of them survived,
i.e. almost 85% of the
particles collided with Aegaeon in just 18 yr. In average, surviving
particles have , which implies a
yr.
As we can see from Fig. 2, a great number of
first and second order MMRs, mainly with Janus and Mimas, populate
the region around Aegaeon. The evenly colored vertical
features in the map of Fig. 6, both interior and
exterior to the orbit of Aegaeon, are related to any of these MMRs.
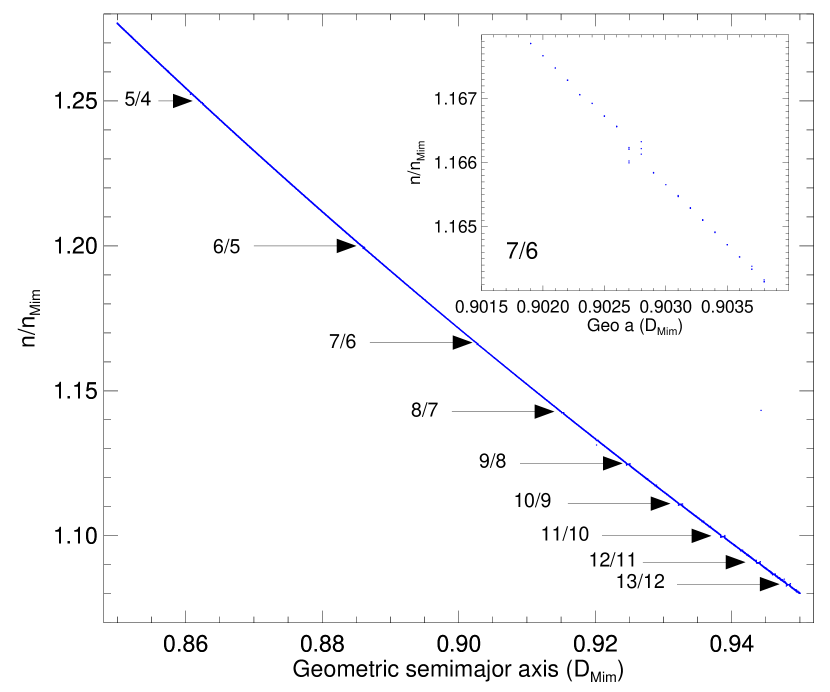
To identify the strongest resonances, and therefore particles
librating inside them, we make use of the frequency curve
(Robutel &
Laskar, 2001). In Fig 7
we show the frequency curve, i.e. the ratio of the particle’s mean
motion over Mimas mean motion, , vs the initial
particle geometric . MMRs are characterized for the flatness of
the frequency curve, due to a constant ration of nearby
particles of different ; this facilitates the identification
of librating particles. In the curve
of Fig. 7, we point out (with arrows in the figure)
to the presence of the next first order MMRs: 6:5, 7:6, 8:7, 9:8,
10:9, 11:10, 11:12, and
13:12; although the flatness of the frequency curve associated to the
mentioned resonances is barely visible,
some particles cause the curve to flatten, making possible their
identification.
To exemplify the way how frequency curve flats in resonances,
in Fig. 7 we zoomed into a region
very close to the 7:6 MMR with Mimas, where
a number of particles maintains a constant ratio .
We note that the small maximum eccentricity covered by our grid of
initial conditions
accounts for the width of the resonant region to be very small, thus
making difficult for such regions to stand out from the Keplerian trend
of the rest of the frequency curve.
It is in this sense that the resonant regions are better
recognized directly from the diffusion map of Fig. 6.
In the map we have plotted as black rectangles the resonant particles with
Mimas identified from the frequency curve, i.e. the particles for
which the ratio is equal to the corresponding MMR ratio .
Nonetheless, apart from this first order MMRs with Mimas, other
homogenous vertical regions are clearly recognizable, and other
resonances can be related to them. For this, we have indicated at
the top of the
Figure the corresponding ratios at the position of first and
second order MMRs with Janus, in orange, and with Mimas, in blue.
Such resonances could not be as strong as first order MMRs with Mimas,
however, their influence is imprint in the homogeneous parameter
they produced over particles of different eccentricities.
We highlight the importance
of MMRs on the evolution of test particles, even as there are
not known structures or particles in such regions in the real system,
i.e. outside the edges of the G ring.
If ever a population of particles inhabited some of the stable regions
currently empty,
then it needs to be an explanation, other than the pure gravitational
evolution, for the lost of such particles. Non-gravitational forces
are a likely explanation, given that particles inhabiting
such regions are expected to be small and therefore subject to
drift forces like solar radiation pressure and plasma drag
(see for example Sun
et al., 2017, Madeira et al., in prep.).
Regarding the G ring, we know it is formed by m-sized
particles and extends from
to km from Saturn centre, or from
0.8893 to 0.9432 DMim (Horányi et al., 2009). In Fig.
6 the location
and size of the G ring are indicated by the
double-headed black arrow. Also showed in the figure, in dashed lines,
are the constant pericenter and apocenter of particles at the position of
the inner and outer edges of the G ring, respectively. It is assumed
that particles inside this region can form part of the ring, since
particles outside of it (some of them with the same but larger )
would have pericentric and apocentric excursions farther away from
the observed edges of the ring.
Initially particles form
part of the ring, while survive at the end of the
simulation. This is, around
25% of the G ring particles are lost due to collisions with
Aegaeon. Besides, surviving particles have in average a
, which implies a yr.
Such particles are
dynamically heated, i.e. by increasing their inclination, from 0 to
0.00425∘ in average, mainly due to the effect of MMRs with Mimas.
This average inclination implies that the G ring is vertically widened
in a short time period, by km, considering an average
km
for the vertical excursions of particles ().
4.3 The Region Around Methone and Anthe
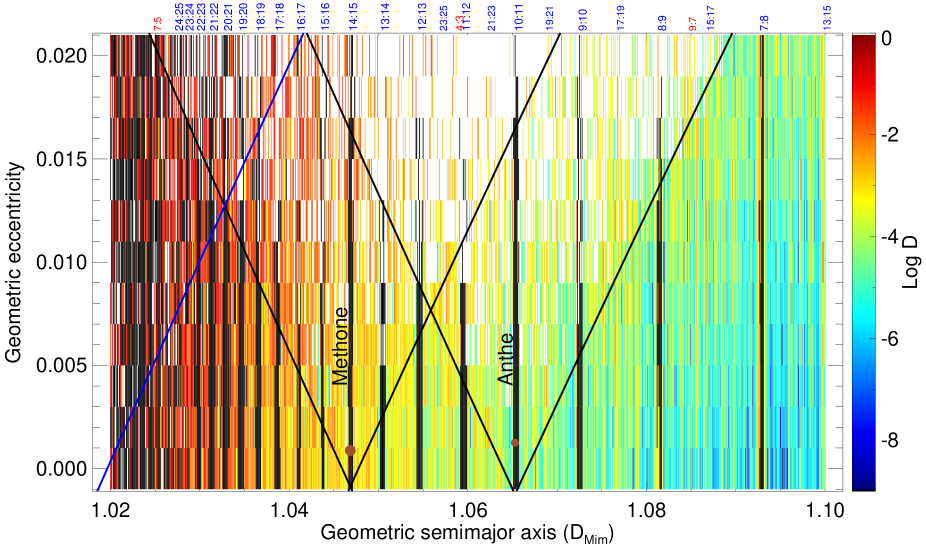
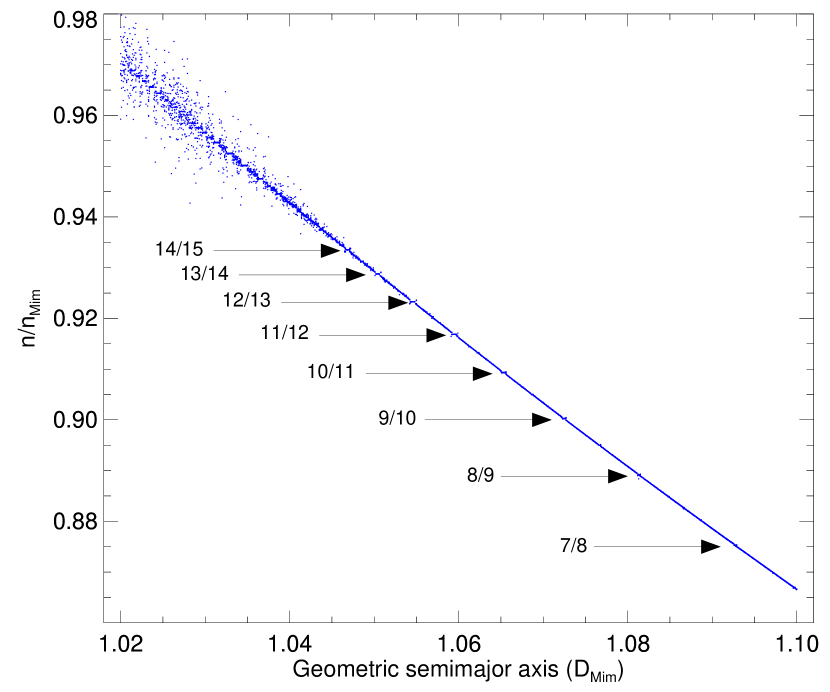
For Methone and Anthe, we study the region around
both moons in the same map, due to their proximity. The
simulation performed for this aim covers from 1.02 to 1.10 DMim
in geometric and from 0 to 0.02 in geometric .
The steps in and are,
as in the previous case, and ,
respectively. This makes a total of test particles.
Inclination is set to 0 as well as , , and .
Particles are subject to the oblateness of Saturn, gravitational
perturbations from the five large moons, plus Methone and Anthe, whose
masses were considered to be: g for Methone and
g for Anthe. Regarding densities, we assumed
values of 0.31 g/cm3 for Methone, following Thomas et al. (2013),
while for Anthe we used a value of 0.35 g/cm3,
by considering an average of the densities of the other three small moons.
The diffusion map for the region of Methone and Anthe is shown in
Fig. 8. Brown filled circles mark the average position
of the small moons. Black lines indicate the pericentric and
apocentric distances
of particles at the positions of the apocenters and pericenters of
Methone and Anthe, respectively. The blue line mark the pericentric
distance of particles at the apocenter of Mimas.
An important fraction of this map
is unstable, mainly due to the overlapping of the collision
regions of Mimas, Methone, and Anthe. Nonetheless, some particles
in the region interior to the orbit of Methone, lie in MMRs with Mimas,
which are tightly packaged the closer they are
to the large moon. Another stability zone exists, located
between the Methone and Anthe locations, while the predominantly
stable region can be found
beyond the orbit of Anthe, where the perturbative influence of Mimas is
weaker.
Inside the combined collision regions of Methone and Anthe, there
are initially particles, out of which survive the
whole simulation, therefore, around 46% of the particles end up
colliding with any of the moons. For the surviving particles an average
is found, which implies a
yr. This is a considerable shorter stability time than that found for
the surviving particles inside the Aegaeon region; this since although
there are few of them, several
of the Aegaeon surviving particles are those of smaller eccentricity,
while others remain in resonance,
avoiding larger perturbations from Mimas and collision with Aegaeon.
In this case, however, many particles that survive the simulation
are part of the high eccentricity and largely perturbed region of
the map, for which it is to be expected shorter diffusion time-scales.
Fig. 9 shows the frequency curve for the Methone/Anthe region. Interestingly, the unstable region close to Mimas is very easy to identify due to the scatter of the points (or values) away of the Keplerian trend. In the figure we point out the existence of the Mimas MMRs: 7:8, 8:9, 9:10, 10:11, 11:12, 12:13, 13:14, and 14:15. The particles with the constant ratios responsible for the plateaus are colored in black in the map of Fig. 8.
4.4 The Dynamical Environment of Pallene
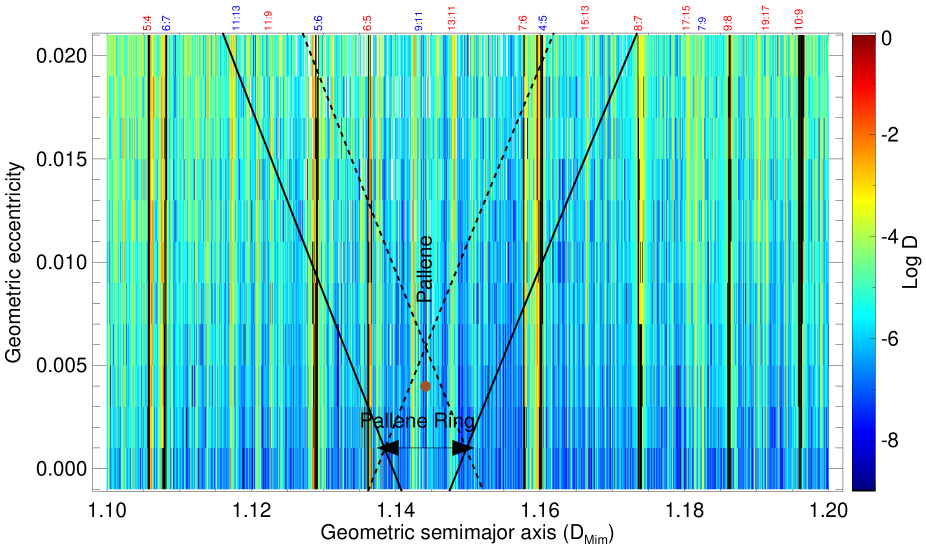
The region around Pallene was studied through a simulation
of test particles covering a patch of geometric vs phase-space,
going from 1.1 to 1.2 DMim in , in steps of .
In the values run from
0.0 to 0.02, in steps of , totalizing
test particles. They are subject to the gravitational
perturbations from an oblate Saturn,
the five large moons of the region plus Pallene. The mass of
Pallene is taken to be g, with a density of
0.25 g/cm3 (Thomas et al., 2013).
The diffusion map for the Pallene region is shown in Fig. 10.
Same as in previous cases, the average location of Pallene is mark by the
filled brown circle. Solid black lines delimit the region
where particles have the highest
probability for colliding with Pallene. Dashed black
lines delimit the apocentric and pericentric distances of particles
at the position of the inner and outer edges of
the Pallene ring, respectively. The width of the ring is
accounted for with the
double-headed arrow. The ring is about km in width and
centered at the small moon (Hedman et al., 2009). Interestingly, the
radial extend of the ring is constrained by the largest pericentric and
apocentric excursions of Pallene itself.
We can see from Fig. 10 that Pallene does not lie close to
any first order MMR, neither with Mimas or Enceladus,
suggesting the non-resonant dynamics of the small moon and its
ring. If by chance, the second order MMRs 9:11 with Mimas and
13:11 with Enceladus, lie
close to the position of Pallene, these weak resonances seems
unable to affect the dynamics of the small moon whatsoever.
Nonetheless, a rich structure of resonances shapes this intermediate
region between the major satellites Mimas and Enceladus, as can
be seen from Fig. 2. In
the map of Fig. 10 we plot in black the resonant
particles in first order MMRs either with Mimas or Enceladus. At the top
of the figure we indicate the ratios of the resonances (in blue for
Mimas, in red for Enceladus). It is clear that some of
the vertical features visible on the map are not related to first
order MMRs, therefore we also indicate, by labeling the ratio at the top
of the figure, the location of second order MMRs with Mimas
and with Enceladus, with the same color code. Despite the abundance of such
first and second order MMRs, all the region is globally very stable and
only a minor fraction of particles are lost in our short time
integration.
Inside the collision region of Pallene, there are initially
particles, while of them survive at the end
of the simulation. This is, less than 5% of the particles
collide with Pallene in 18 yr. In average,
for the surviving particles we have a , which
implies a stability time of yr, the longest
for any of the regions studied so far. Regarding the Pallene ring,
there are initially
inside the region delimited by the dashed lines a total
of particles, out of which only one collided with Pallene. A is
found in average for the ring surviving particles, leading
to yr. The
average inclination of the surviving ring particles is
0.001023∘. This inclination implies vertical
excursions of just km, considering an
average km. This is an order of magnitude smaller
than the vertical width of around 50 km, determined by Hedman et al. (2009)
for the Pallene ring. Nonetheless, we expect a larger value of
the final average inclination in longer simulations. Such explorations
are planned to be presented in a future work.
It is worth to note the high stability of the orbits inside the region of
the maximum orbital excursions of Pallene. Even more, particles of small
eccentricity laying close to the small moon, at least below
, are those actually forming
part of the ring and are expected to survive in a long-term basis.
If the ring itself is a stable feature, it should then be formed by
this low particles, leading in its way to a ring of small
eccentricity also.
Due to the limited number of Cassini images in which the Pallene ring
is visible, it has not been possible to accurately determine the
eccentricity of the ring, among other properties such as its mass.
Nonetheless, the ring seems to follow closely the orbital path
of the small moon. This fact implies that most likely the ring
shares the same orbital
properties of the parent moon. A further detailed study about the ring
is planned to be presented in a future paper.
5 Long-term evolution of Aegaeon, Methone, Anthe, and Pallene
| Satellite | (DMim) | (km) | (∘) | (Myr) | ||
|---|---|---|---|---|---|---|
| Aegaeon | -3.0138 | |||||
| Methone | -3.1172 | |||||
| Anthe | -3.1291 | |||||
| Pallene | -5.3085 |
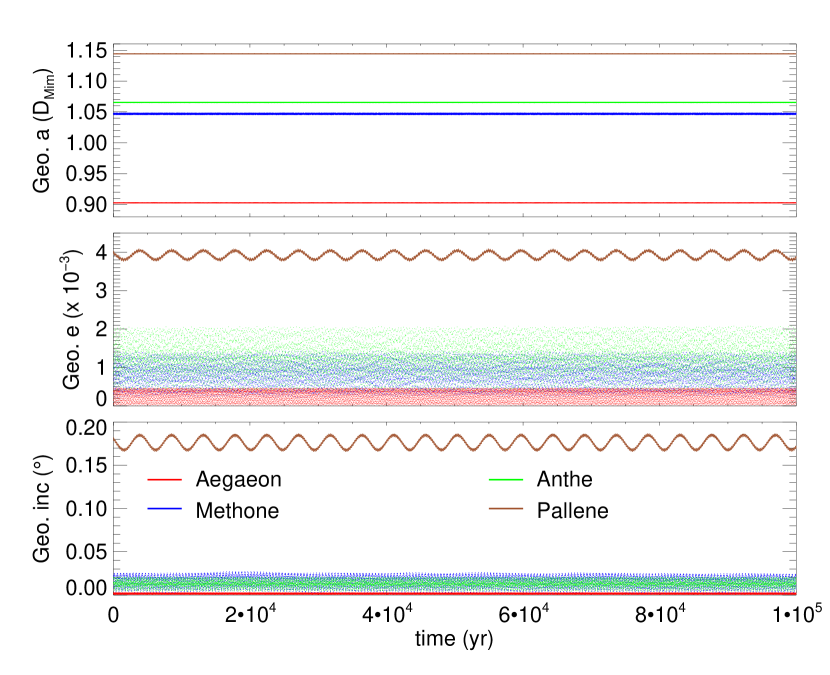
In this section we present the results of a single
long-term simulation, lasting for yr,
which included the nine large bodies of Table 1, and the
oblate Saturn with physical parameters given in Table 2.
In Fig. 11 we plot the evolution of the geometric orbital
elements of the four small moons of Table 4.
For them, we calculate
the mean and maximum variations of the geometric parameters.
Also, we apply the frequency analysis to
the small moons in order to estimate a diffusion parameter and
an associated diffusion time-scale for them in the current
configuration of the saturnian system.
Our results are summarize in Table 5.
Second and third columns of Table 5 show the
mean and maximum variations of the
geometric semimajor axis, , in units of DMim
(second column) and
km (third column) for an easier interpretation.
The largest variations in this parameter are
those of Methone and Anthe. We can see that all
the orbits of the small
moons are highly stable over the yr simulation. The largest
ones, for Methone and Anthe, are of only km.
It has been suggested
that those two moons are closer to a chaotic zone produced by the
overlapping of the CER and LER resonances with Mimas
(El
Moutamid et al., 2014). The variations, well above the 4 km separation of
the CER and LER may lead to Methone and Anthe to be influenced by both
resonances at different times, nonetheless, the combined perturbations
are weak enough as being ineffective in leading to a chaotic evolution
of their orbits in yr.
In the case of Aegaeon, the variations km implies that
the moon is well trapped inside the 7:6 CER with Mimas. For
Pallene, the variations of only 3 km turns it into the more stable
of the small moons. Pallene is far from any first order
MMR, this allows it to avoid any strong perturbation from Mimas
or Enceladus.
Regarding geometric and , Anthe turns out to be the
more perturbed in , probably as a result of
perturbations produced by the overlapping the CER and LER with Mimas,
being that, as El
Moutamid et al. (2014) have pointed out, Anthe is
closer to the chaotic zone than any of the other small moons, although
variations in this parameter for Methone are comparable.
Regarding inclinations, for Aegaeon, Methone,
and Anthe, they are also small, so the small moons remain very
close to Saturn’s equatorial plane; Aegaeon reachs maximum
excursions above the plane of only km, while for Methone
and Anthe vertical excursions are of and km,
respectively. For Pallene such excursions reach km.
The orbital behavior of Pallene is interesting, showing that
variations in and are
periodic and clearly correlated. The period of such oscillations is
yr, for both and , and although its mean
values of and are the largest among the small moons,
it presents the more stable orbit.
We can confirm the last statement by calculating
the diffusion parameter and the associated diffusion time for the
orbits of the small moons, as shown in the last two columns of Table
5. The value of is determined from the evolution of
the same quantity as for the test
particles of the diffusion maps.
Here, gives us an estimation of the time required for an
appreciable change in the orbital evolution of the small moons to be
observed.
As shown in the last column of Table 5, Pallene could
remain stable for as long
as 64 Myr in its current orbit, while Aegaeon, Methone, and Anthe
could do the same for only Myr. This short-time
period results from a crude estimation and could result from the
large variations of the three small moons produced by the resonances
they are trapped in. Nonetheless, for Pallene it seems to represent
a confident value for the stability of the moon in a long term basis.
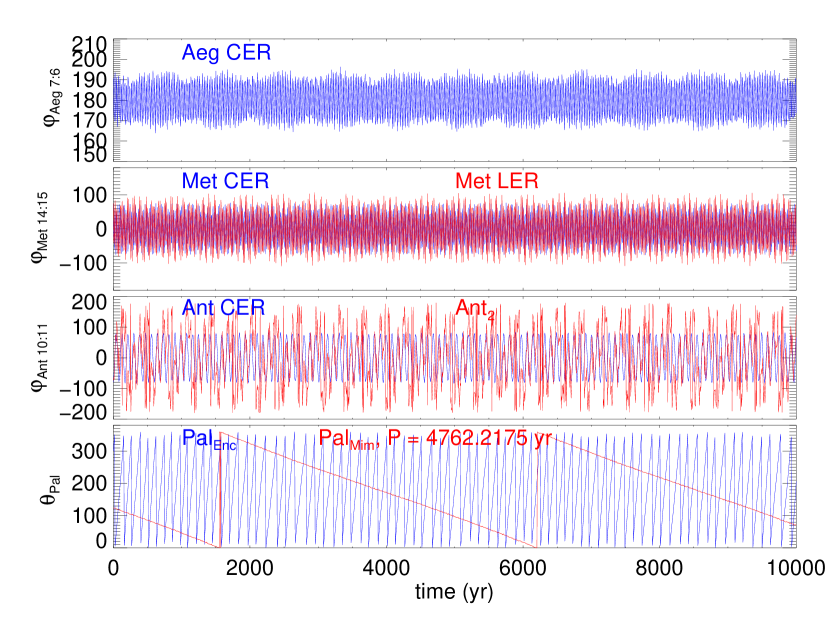
Regarding the resonant nature of the small moons, we show in Fig.
12 the long term evolution of the same resonant
arguments previously shown if Fig. 1, where
we explored their
short-term evolution. Now we show a period of yr out
of the yr of our simulation, as the behavior remains
unchanged along the whole run. From Fig. 12
we can conclude that the three small moons currently trapped in CERs with
Mimas, will remain there for a long-term basis, as is shown by blue
curves in the three first panels of Fig. 12. Such
arguments remain librating for the whole time of the simulation.
Aegaeon, Methone, and Anthe are
strongly affected by CER resonances and
they could hardly escape from them, probably explaining the existence
of their associated arcs. Indeed, if the small moons remain for a long
time trapped in the
resonances, the slow impact-ejecta processes that are believed to
suply the arcs with dusty material, could have plenty of time to act
and originate
such structures, even if the tiny grains are constantly removed
due to the action of gravitational and non-gravitational forces,
such as collisions, solar radiation, and plasma drag.
For Methone, the argument associated to the LER with Mimas also remains
librating for the whole simulation, therefore, this resonance
also affects the dynamics
of the small moon; this could explain the large variations in
seen for Methone. In the case of Anthe, the argument
, shown in Sec.
3, starts librating
but then it changes and starts to circulate,
then librates again repeating the cycle with a constant period
and sequence. Although the erratic regime changes from libration
to circulation are a signature of chaotic behavior, in this case, the
regularity in the behavior of this argument seems not to lead to
the chaotic evolution of Anthe.
In the case of Pallene, we show the two arguments previously
presented in Sec. 3; now it
is clear that both arguments circulate. The resonant argument
associated with Mimas, ,
circulates with a period of yr; this is the same period as
the one found for the long-term oscillations of and . Such correlation
implies that Mimas induces those variations on the orbit of the small moon,
despite leaving it in a highly stable orbit.
6 Conclusions
In this work we have explored the dynamical evolution of four Saturnian small moons: Aegaeon, Methone, Anthe, and Pallene, as well as characterized their dynamical environment by using thousands of test particles surrounding them, by means of short and long term simulations, going up to yr, this is, longer than any previous numerical exploration. We have considered the current configuration of the Saturnian system, including the oblateness of Saturn up to and the five largest moons close to the region of interest, namely Janus, Epimetheus, Mimas, Enceladus, and Tethys. Through frequency analysis and the long term evolution of the moons we have analyzed their stability and that of the region surrounding them. The frequency analysis has allowed us to obtain a global dynamical perspective of the region inhabited by the small moons by using detailed but short time integrations. With it we gain an estimation of the stability times for particles in such regions and it also let us characterize the resonances involved in shaping or perturbing such regions. We have also found that:
-
•
all the four small moons are stable in a long-term basis. If the current configuration of the system would remain unchanged, this is, if the migration of the largest moons, mainly Mimas, is slow enough, then the stability time for the small moons would be at least Myr for Aegaeon, Methone, and Anthe, and up to 64 Myr for Pallene.
-
•
Aegaeon remains trapped in the 7:6 CER with Mimas, with maximum variations of only km in . Its remains small, and variations in implies maximum excursions above Saturn’s equatorial plane of 4.7 km.
-
•
Methone and Anthe share similar stability times, as well as variations of the same order in their orbital parameters. Methone librates in both the 14:15 CER and LER with Mimas, while Anthe remains in the 10:11 CER with Mimas but it is also close to the chaotic region produced by the overlapping of the CER and LER. The influence of two resonances on those small moons likely lead to largest variations than those observed for Aegaeon. For both Methone and Anthe, variations in are of 28 km, while their imply vertical excursions of 52 and 46 km, respectively.
-
•
Pallene is the most stable of the small moons analyzed. It remains as non-resonant but, nonetheless, it suffers long-term perturbations from Mimas, through the quasi-resonance found by Callegari & Yokoyama (2010). Such perturbations only affect the evolution of and , inducing long-term oscillations, while its changes by only 3.2 km.
-
•
Regarding the G ring, 25% of ring particles collide with Aegaeon, while the remaining are stirred in their up to in average. This implies a vertical widening of 12.6 km in just yr, of an initially flat distribution of particles.
-
•
The Pallene ring may be formed of particles of small eccentricity, below 0.006. Despite the larger size of Pallene compared to Aegaeon, Methone or Anthe, the small moon is unable to efficiently clean up its orbit, due to its anyway small size and large . The average final inclination of ring particles is , which leads to a vertical width of 3.8 km.
All the regions explored in this work have some stable zones
where no particles are found in the real system. If ever some particles
existed in such regions, then some mechanism should be
responsible for their removal. Such mechanisms are most likely the
non-gravitational forces, such as solar radiation force and plasma
drag, as it is expected that particles close to the small moons were
originated when micrometeoroid IDPs hit
the surfaces of the small moons, leaving ejecta that is also
micrometrical in size.
The influence of non-gravitational forces have been studied for the regions of Aegaeon (for example in Madeira et al., in prep.), Methone and Anthe (Sun et al., 2017). The work exploring such shaping forces for the Pallene ring is under investigation.
Acknowledgements
We acknowledge an anonymous referee for insightful comments that help to improve the present work. We thank the financial support from FAPESP (Proc. No 2016/01467-8 and 2011/08171-3). SGW also thanks CNPq project number 309254/2012-4. We acknowledge the use of the Saturn Cluster of the Grupo de Dinâmica Orbital e Planetologia at UNESP, campus of Guaratinguetá.
References
- Callegari & Yokoyama (2010) Callegari N., Yokoyama T., 2010, in Fernandez J. A., Lazzaro D., Prialnik D., Schulz R., eds, IAU Symposium Vol. 263, Icy Bodies of the Solar System. pp 161–166 (arXiv:0910.2726), doi:10.1017/S1743921310001699
- Chambers (1999) Chambers J. E., 1999, MNRAS, 304, 793
- Cooper et al. (2008) Cooper N. J., Murray C. D., Evans M. W., Beurle K., Jacobson R. A., Porco C. C., 2008, Icarus, 195, 765
- Cooper et al. (2015) Cooper N. J., Renner S., Murray C. D., Evans M. W., 2015, AJ, 149, 27
- Correia et al. (2005) Correia A. C. M., Udry S., Mayor M., Laskar J., Naef D., Pepe F., Queloz D., Santos N. C., 2005, A&A, 440, 751
- El Moutamid et al. (2014) El Moutamid M., Sicardy B., Renner S., 2014, Celestial Mechanics and Dynamical Astronomy, 118, 235
- Hedman et al. (2007) Hedman M. M., et al., 2007, Science, 317, 653
- Hedman et al. (2009) Hedman M. M., Murray C. D., Cooper N. J., Tiscareno M. S., Beurle K., Evans M. W., Burns J. A., 2009, Icarus, 199, 378
- Hedman et al. (2010) Hedman M. M., Cooper N. J., Murray C. D., Beurle K., Evans M. W., Tiscareno M. S., Burns J. A., 2010, Icarus, 207, 433
- Horányi et al. (2009) Horányi M., Burns J. A., Hedman M. M., Jones G. H., Kempf S., 2009, Diffuse Rings. p. 511, doi:10.1007/978-1-4020-9217-6_16
- Jacobson et al. (2006) Jacobson R. A., Spitale J., Porco C. C., Owen Jr. W. M., 2006, AJ, 132, 711
- Laskar (1990) Laskar J., 1990, Icarus, 88, 266
- Laskar (1993) Laskar J., 1993, Celestial Mechanics and Dynamical Astronomy, 56, 191
- Laskar et al. (1992) Laskar J., Froeschlé C., Celletti A., 1992, Physica D Nonlinear Phenomena, 56, 253
- Nadolski & Laskar (2003) Nadolski L., Laskar J., 2003, Physical Review Special Topics Accelerators and Beams, 6, 114801
- Nesvorný & Morbidelli (1998) Nesvorný D., Morbidelli A., 1998, AJ, 116, 3029
- Papaphilippou (2014) Papaphilippou Y., 2014, Chaos, 24, 024412
- Papaphilippou & Laskar (1998) Papaphilippou Y., Laskar J., 1998, A&A, 329, 451
- Porco et al. (2005) Porco C. C., et al., 2005, Science, 307, 1226
- Renner & Sicardy (2006) Renner S., Sicardy B., 2006, Celestial Mechanics and Dynamical Astronomy, 94, 237
- Robutel & Laskar (2001) Robutel P., Laskar J., 2001, Icarus, 152, 4
- Spitale et al. (2006) Spitale J. N., Jacobson R. A., Porco C. C., Owen Jr. W. M., 2006, AJ, 132, 692
- Sun et al. (2017) Sun K.-L., Seiß M., Hedman M. M., Spahn F., 2017, Icarus, 284, 206
- Thomas et al. (2013) Thomas P. C., Burns J. A., Hedman M., Helfenstein P., Morrison S., Tiscareno M. S., Veverka J., 2013, Icarus, 226, 999
- Valluri & Merritt (1998) Valluri M., Merritt D., 1998, ApJ, 506, 686
- Šidlichovský & Nesvorný (1996) Šidlichovský M., Nesvorný D., 1996, Celestial Mechanics and Dynamical Astronomy, 65, 137