Search for extreme energy cosmic ray candidates in the TUS orbital experiment data
S.V. Biktemerovab, A.A. Botvinkoc, N.P. Chirskayaa, V.E. Eremeeva, G.K. Garipova, V.M. Grebenyukb,d, A.A. Grinyuka, S. Jeongf, N.N. Kalmykova, M.A. Kaznacheevaa, B.A. Khrenova, M. Kimf, P.A. Klimova, M.V. Lavrovaa, J. Leef, O. Martinezg, M.I. Panasyuka, I.H. Parkf, V.L. Petrova, E. Ponceg, A.E. Puchkovc, H. Salazarg, O.A. Saprykinc, A.N. Senkovskyc, S.A. Sharakina, A.V. Shirokova, A.V. Tkachenkob, L.G. Tkachevb,d, I.V. Yashina, M.Yu. Zotova
(The Lomonosov–UHECR/TLE collaboration)
aM.V. Lomonosov Moscow State University, GSP-1, Leninskie
Gory, Moscow, 119991,
Russia
bJoint Institute for Nuclear Research, Joliot-Curie, 6, Dubna, Moscow region, Russia, 141980
cSpace Regatta Consortium, ul. Lenina, 4a, 141070 Korolev, Moscow region, Russia
dDubna State University, University str., 19, Bld.1, Dubna, Moscow region, Russia
eDepartment of Physics and ISTS, Sungkyunkwan
University, Seobu-ro 2066, Suwon,
440-746 Korea
fBenemérita Universidad Autónoma de Puebla, 4 sur 104 Centro Histórico C.P. 72000, Puebla, Mexico
Abstract
TUS (Track Ultraviolet Setup) is the first space experiment aimed to check the possibility of registering extreme energy cosmic rays (EECRs) at EeV by measuring the fluorescence signal of extensive air showers in the atmosphere. The detector operates as a part of the scientific payload of the Lomonosov satellite for more than a year. We describe an algorithm of searching for EECR events in the TUS data and briefly discuss a number of candidates selected by formal criteria.
1 Introduction
Measurements of the cosmic ray (CR) energy spectrum, their nuclear composition and arrival directions at extreme energies eV are an important part of modern astrophysics and particle physics [1].
The first CR particles with energy EeV were detected [2] and a cut-off of the energy spectrum was predicted [3, 4] more than 50 years ago but results in the EECR study do not give clear answers to the most important question of the Greisen–Zatsepin–Kuz’min cut-off [5]. The nature and origin of EECRs are still not understood. To a great extent, the problem relates to a very low flux of EECRs: the two largest ground-based arrays—The Pierre Auger Observatory and the Telescope Array—registered less than two dozen events with energies EeV in 10 and 5 years of operation respectively [6, 7].
A primary goal of the TUS project, first announced in 2001 [8], is to expand the EECR experimental studies to space as was suggested by Benson and Linsley in early 1980’s [9, 10]. The main idea is that fluorescent and Cherenkov radiation of an extensive air shower (EAS) generated by an EECR in the nocturnal atmosphere of the Earth can be detected from a satellite similar to the way it is observed from the ground but with a much larger exposure, thus considerably increasing the statistics of registered events.
Following the idea, a number of orbital detectors with a large signal collecting area and high time-lateral resolution are being elaborated [11]. The TUS detector is a pathfinder to the large-scale missions like KLYPVE [12] or JEM-EUSO [13]. Accurate estimations of the energy and arrival directions of primary EECR particles are left to the future orbital detectors.
Skobeltsyn Institute of Nuclear Physics of Lomonosov Moscow State University (SINP MSU), Joint Institute of Nuclear Research (JINR) and Space Regatta Consortium together with several Korean and Mexican Universities have collaborated in the TUS detector preparation. Results of the detector simulations, development and preflight tests are published elsewhere [14, 15, 16, 17, 18].
The Lomonosov satellite was launched into orbit from the newly built Vostochny Cosmodrome (Russia) on April 28, 2016. The satellite has a sun-synchronous orbit with an inclination of , a period of min, and a height of about 470–500 km.
2 The TUS detector data acquisition system and on-line trigger
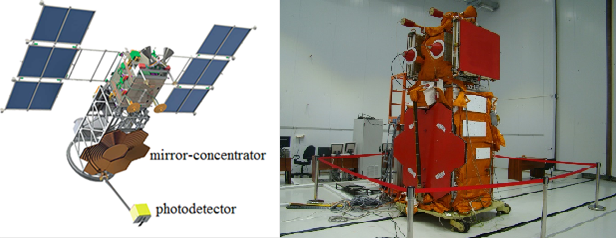
The TUS detector on board Lomonosov satellite is presented in Fig. 1. It consists of the two main parts: a modular Fresnel mirror-concentrator and a photo-receiver matrix consisting of 256 channels (16 photodetector modules (PDMs) of 16 channels each) in the focal plane of the mirror. A sensor of each channel (pixel) is a Hamamatsu-type R1463 photomultiplier tube (PMT) with a 13 mm diameter multi-alcali cathode covered by a ultraviolet (UV) glass filter and a mirror light guide with square entrance of 15 mm size. Quantum efficiency of PMTs in the UV band is %. The Fresnel mirror has an area of 2.0 m2 and a focal distance of 1.5 m. One pixel has an FOV of 10 mrad, which corresponds to a spatial spot of about at the sea level for a 500 km orbit height. Thus, the total FOV equals (), and the full area observed by TUS at any moment is approximately . A detailed description of the TUS detector can be found in [19].
The general design of TUS is determined by its main task of registering fluorescence and scattered (reflected) Cherenkov radiation of EASs in the UV band with a time resolution of 0.8 s in full temporal interval of 256 time steps. It can also be employed for measuring transient events in the atmosphere with longer duration in modes with longer time samples implemented in the detector DAQ system. This design makes TUS a multi-purpose detector [20, 21, 22].
A crucial part of any detector is its trigger system. TUS has a two-level trigger [23, 24]. The first-level trigger is a threshold trigger: the PDM board calculates a moving sum (MS) of PMT signals during 16 time steps in each channel and looks for an MS value above a threshold level. The threshold level is calculated as , where is the mean value of MS obtained during previous 100 ms for each channel, and is a constant unique for all channels. It can be changed by commands from the mission control center (MCC). The PDM board transmits a trigger word to the central processor board (CPB), which forms a map of active pixels with moving sums above the threshold. The second-level trigger is a pixel-mapping trigger implemented in the CPB. It acts as a contiguity trigger. This procedure selects cases of sequential triggering of spatially contiguous active pixels that are also adjacent in time, allowing for the selection of events with a special spatial-temporal pattern. An additional parameter important for this trigger is the so-called adjacency length (), i.e., the number of neighboring channels sequentially activated by a signal from a given event. Data of all 256 channels for 256 time steps is transmitted from the CPB memory to the on-board computer in case conditions of the trigger system are satisfied.
For the maximal EAS trigger rate of about 1 min-1 (confined by the design of the on-board computer) and the event size of 128 KiB, an amount of data collected in one satellite revolution does not exceed 12 MiB. This information is transferred to the MCC twice per day at sessions of the best connection between the satellite and the MCC.
3 Expected EAS signal: simulation and criteria
Various aspects of TUS’ operation in space were simulated before the launch [25, 23, 26, 24]. The simulations employed ESAF (EUSO Simulation and Analysis Framework) [27] and the TUSSIM program developed at JINR. The QGS model parametrization of Ilina et al. [28] was selected as the closest to experimental data at primary energies in the range of 10–100 EeV. It was found in particular that duration of a horizontal EAS in the FOV of one pixel is s. For vertical EASs, it is approximately two times larger. The total duration of an EAS signal depends on the zenith angle and varies approximately from 30 s to 100 s. A measure of the energy of a primary particle is a number of photons in the EAS maximum, which is related to the electron (positron) number as , where photons/m is a fluorescent photon yield. The detected amplitude of fluorescence at the cascade maximum is expected to be of the order of 20 photons/s for a horizontal EAS generated by a 100 EeV proton.
It should be noticed that maximum of the vertical cascade curve at such high energies is close to the sea level, so that a considerable part of the cascade curve escapes observation in the atmosphere. On the other hand, it is followed by a strong Cherenkov light signal reflected by the surface (up to 80% by snow). A back-scattered Cherenkov “point” with an amplitude of the signal in one time sample of the detector much higher than the background is a characteristic signal of an EAS. Typical light curves (total number of UV photons per microsecond on the detector focal surface as a function of time) for three values of EAS zenith angle are shown in Fig. 2 for a primary proton with the energy 100 EeV approaching the FOV of TUS along one of the diagonals. The curves were obtained with ESAF and optics simulation software based on a realistic 3D TUS mirror model, developed at JINR.
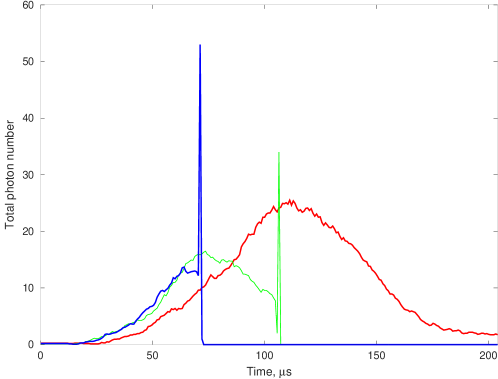
The main features of the light curves for (quasi-)vertical and (quasi-)horizontal EASs are obviously different. A sharp break of the fluorescent signal and a Cherenkov peak at the meeting point of an EAS front with the scattering surface (ocean, continent) are expected for vertical events. Duration of the signal in one pixel is larger than for inclined events and the amplitude of the fluorescent signal is lower.
An image of an EAS on the focal surface produces a moving track. The speed of the movement depends on the zenith angle as , where is an angular speed of the source, is the distance from the source to the detector (which weakly depends on ), and is the speed of light in the atmosphere. This leads to the difference in the signal duration in different channels. A comparison of parameters of EASs with various zenith angles is presented in Table 1. Here, is duration of the signal in one pixel estimated as with mrad being the FOV of one pixel, and is the full duration at half maximum (FDHM) of the light curve. All calculations were made for a 100 EeV primary proton.
| , km | , mrad/s | s | s | |
|---|---|---|---|---|
| 15∘ | 1.5 | 0.08 | 123 | |
| 30∘ | 2.5 | 0.17 | 61 | 38 |
| 45∘ | 4.2 | 0.26 | 39 | 42 |
| 60∘ | 6.3 | 0.36 | 28 | 47 |
| 75∘ | 11 | 0.48 | 21 | 69 |
| 80∘ | 14 | 0.53 | 19 | 94 |
It is clear from the table that the temporal evolution of the signal strongly differs for the two limiting intervals of the zenith angle. For the sake of brevity, we shall call air showers with as vertical, those with as horizontal, and all the rest as inclined.
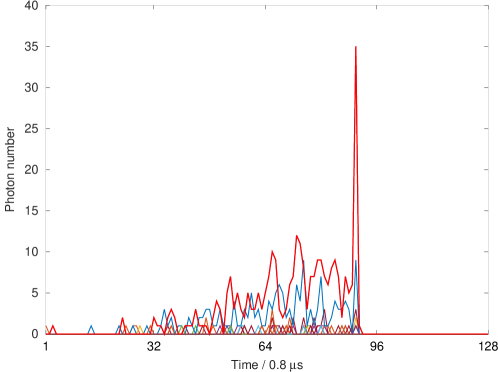
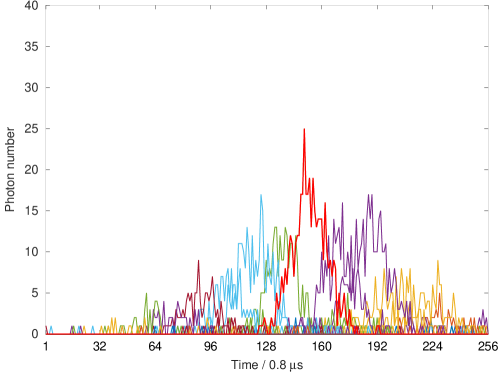
Figures 3 and 4 demonstrate results of simulations of the flux of photons in the TUS detector channels for a vertical () and horizontal () air showers respectively. Zero background radiation is assumed. In both cases, the EASs are generated by a 100 EeV primary proton arriving along one of the diagonals of the FOV. One can see features discussed above for the vertical EAS shown: the duration of the signal in the brightest pixel is s with a very short (s) flash of the Cherenkov light at the end. This vertical EAS signal is expected to be measured in one or two pixels of an “ideal” detector with a small point spread function (PSF). In the real TUS detector, the PSF spreads for more than one pixel, and the signal might be registered in a group of 3–5 adjacent pixels.
A horizontal EAS shown in Fig. 4 demonstrates a completely different signal. In contrast to the vertical EAS, signals in separate channels have shorter duration with photons/s in the brightest pixels. Information that can be obtained from inclined showers is richer than from vertical ones due to the signal detection in several pixels and larger signal-to-noise ratio due to shorter duration of useful time interval for EAS photons collection. An analysis of the light curves of different types of EASs allow one to obtain several criteria for selecting EECR candidates in the TUS data, see below.
4 EAS candidates in the TUS data
TUS began measurements in space on May 19, 2016. The first months of work were mostly dedicated to testing hardware, software and various modes of operation. Continuous measurements were started in September 2016 with several gaps for the satellite technical service. By the end of May 2017, TUS registered around 35,000 events at nocturnal parts of its orbit in the EAS mode. The total exposure is approximately km2 yr sr. It is small in comparison with that of the largest ground-based arrays but sufficient to look for an EECR above the TUS threshold energy EeV [24].
In a search for possible EAS candidates, we analyzed approximately 10,000 events registered in the conditions of the minimal background radiation and considered those that satisfied the following criteria. First, we selected events such that the moving sum of a waveform in the event exceeded the background level by at least 96 ADC counts (i.e., ), and the adjacency length (i.e., satisfied conditions of a “software” trigger). The number of such software triggers in an event should be less than 17.
Among events obtained at the first stage, we selected those that satisfied additional constraints based on the Gaussian approximation of waveforms of active pixels (“fit conditions”):
-
•
the peak of the signal was located within 72…230 s from the beginning of the record;
-
•
total duration of the signal in any active channel was within 27…144 s;
-
•
the coefficient of multiple determination .
The above criteria were developed basing on simulations of a few thousand EECRs with different parameters of primary particles and an analysis of different types of “noise” events in the data set [22]. The procedure led us to a list of 13 events presented in Table 2.
| # | Date | UTC | Geolocation | T&F |
|---|---|---|---|---|
| 1 | 160928 | 06:30:53 | N, W | 12 |
| 2 | 160930 | 05:39:02 | N, W | 1 |
| 3 | 161003 | 05:48:59 | N, W | 6 |
| 4 | 161003 | 05:50:02 | N, W | 1 |
| 5 | 161023 | 07:49:56 | N, W | 2 |
| 6 | 161024 | 10:25:57 | N, W | 1 |
| 7 | 161031 | 10:25:18 | N, W | 4 |
| 8 | 161124 | 20:20:19 | S, E | 1 |
| 9 | 161208 | 07:20:40 | N, W | 1 |
| 10 | 170420 | 02:18:33 | S, W | 2 |
| 11 | 170421 | 17:22:26 | N, E | 1 |
| 12 | 170422 | 13:52:43 | N, E | 1 |
| 13 | 170422 | 16:51:52 | N, E | 2 |
The next step of the analysis is an event by event study of the temporal and spatial dynamics of the signal. This analyses is aimed to search for typical signatures of an EAS taking into account the characteristic temporal parameters, signal amplitudes and image structure discussed above. The latter one is mainly determined by the PSF, which is sufficiently larger than a pixel size and may differ in various parts of the FOV. The preflight measurements of the PSF showed that is has a diameter of 27-30 mm (70% of energy) on the edge of the FOV, which twice larger than the size of a pixel [29]. Simple estimations show that it can increase the signal duration in 1.5–2 times in comparison with an ideal optical system. For a more accurate determination of the temporal parameters of a signal (duration in a separate channel and the total duration of the light curve), their evaluation was made by means of the FDHM.
As was shown in Section 3, it is expedient for the subsequent analysis to formulate two different sets of the second level criteria, separately for horizontal and vertical events.
Horizontal EAS criteria:
-
1.
Linearity of the image: alignment of 5 or more active pixels in a line (“track”).
-
2.
The characteristic duration of the signal in one pixel: 20–50 s.
-
3.
The characteristic total duration of the signal: more than 50 s.
Vertical EAS criteria:
-
1.
Spot-like image: the signal is confined to 2–4 neighboring channels.
-
2.
The characteristic duration of the signal in one channel: more than 40 s.
-
3.
The characteristic total duration of the signal: less than 50 s.
-
4.
Presence of the Cherenkov peak at the end of the light curve during one time step and not later than in 10–30 s after the maximum of the EAS fluorescence.
As a result of this event by event analysis based on the second stage criteria, the preliminary EAS candidates were classified as follows:
-
•
4 events do not meet both sets of criteria and represent either electronics effects or atmospheric phenomena.
-
•
2 events have very special spatial or temporal structure, both cases are non-determinant due to our criteria.
-
•
4 events meet horizontal criteria.
-
•
3 events meet vertical criteria.
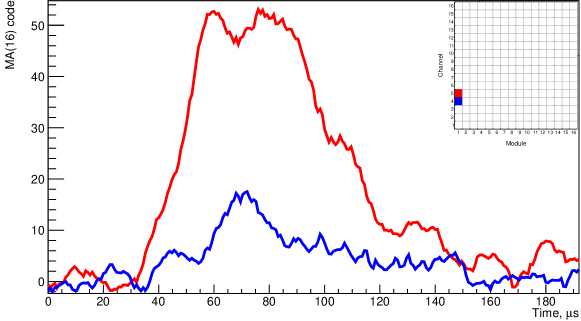
An example of the first type of events is presented in Fig. 5. Shown are values of the moving average (MA) of ADC counts calculated for 16 time samples in the brightest pixels. Here and below, the MA curves in the figures are adjusted to have the same base level of the signal. For the event shown, all twelve active pixels are located in the same PDM module and are hit simultaneously. This cannot be a vertical shower because of a large area of the illumination. For a horizontal EAS, they should have a continuous signal producing track which is not seen as well. This makes us conclude that this event is more probably an effect of some cross-talk in the PDM.

An example of the second type of events is provided by events #2 and #6, see Fig. 6, but active pixels are located at the very edge of the FOV, and it is difficult to make a definite conclusion about a possible origin of the signal since the PSF is largest in this area, so a source of the signal can be outside the FOV.
One of the “horizontal EAS” candidates (event #3) is presented in Fig. 7. It has the most interesting spatial-temporal dynamics similar to what is expected for an EAS. Active pixels are grouped in an oblong spot, the shape of which might be a “convolution” of two factors–the mirror PSF and a linear track.
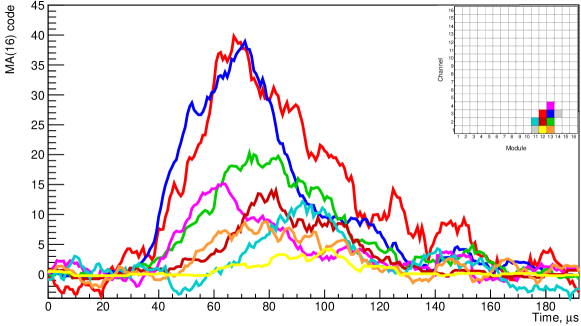
Main information about active pixels and temporal characteristics of the signal are listed in Table 3. It can be seen from the waveforms that characteristic duration of the signal is 70–100 s which is more that one can expect from a vertical EAS. The moment of the maximum of the signal in each pixel has some shift from one pixel to another. This is an argument in favor of a horizontal (inclined) EAS origin for this event.
| md/ch | s | s | ||
|---|---|---|---|---|
| 13/4 | 5.7 | 15 | 63 | 36 |
| 12/3 | 7.2 | 40 | 67.5 | 47 |
| 13/3 | 0.9 | 38 | 71.5 | 41 |
| 13/2 | 1.7 | 20 | 73.0 | 49 |
| 13/1 | 4.5 | 8.6 | 78 | 42 |
| 12/2 | 0.8 | 14 | 81 | 41 |
| 11/2 | 10.8 | 12.2 | 92 | 29 |
| 12/1 | 0.2 | 4.2 | 100 | 27 |
It is important to mention that a possible thunderstorm activity was studied in the region of this event measurements. The Vaisala GLD360 ground based lightning location network [30, 31] did not register any lightning strikes in a region with radius of 930 km and during 10 s period around the time of the TUS event. This provides a strong support for a non-thunderstorm origin of the event.
Other EAS candidates of the horizontal type are events #7, #9 and #10.
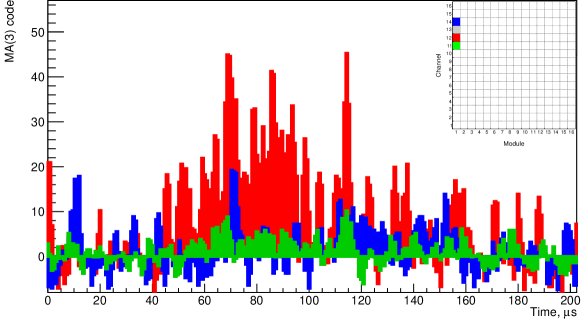
An example of an event that meets the criteria for a vertical EAS is shown in Fig. 8. Here in order to identify “fine” temporal structure we represent the moving average calculated for 3 time samples, i.e., a moving average with time window s only. The main part of the signal is located in one pixel, the other active pixels are likely to be due to the PSF effects. This signal has s, and it is very tempting to interpret the peak with a time delay from the signal maximum equal to 25–30 s as a Cherenkov point. Other EAS candidates of the vertical type are events #5 and #13.
5 Discussion
TUS, the first orbital detector of extreme energy cosmic rays, is operating for approximately a year on board the Lomonosov satellite. In a search for an EAS, generated by an EECR, it observes a large number of background events of various origin that take place in the nocturnal atmosphere of the Earth but they do not exclude a possibility to detect a true EAS events at energies EeV. A multi-level algorithm for the search of EAS-like events was developed and applied to the TUS data set. As a result, 13 preliminary EAS candidates were selected and analysed on the event by event basis according to the spatial-temporal criteria for horizontal and vertical EASs. Six of these candidates are eliminated from the further analysis because they do not meet the empirical criteria. Other 7 events are considered as horizontal (4 events) or vertical (3 events) EAS candidates. The most interesting for the further analyses are four candidates for horizontal EASs, which demonstrate a movement of the image in the FOV. An analysis of their temporal parameters is complicated by the large PSF and different sensitivity of pixels, and needs more detailed and accurate simulations. An influence of possible anthropogenic sources of illumination and weather conditions must also be taken into account. A more detailed analysis of EAS candidate events found in the TUS detector data is in progress, and its results will be reported elsewhere.
Acknowledgments
The authors wish to thank Vaisala Inc. company for providing the data on lightning strikes employed in the present study. The TUS experiment on board the Lomonosov satellite was realized within the Federal Space Program of Russia with funding by the Russian Space Agency. The data analysis is supported by RFBR grants No. 16-29-13065 and No. 15-02-05498. The Korean work is supported by the National Research Foundation grants (No. 2015R1A2A1A01006870 and No. 2015R1A2A1A15055344).
References
- [1] B. R. Dawson, M. Fukushima, and P. Sokolsky. Past, present and future of UHECR observations. ArXiv e-prints, 2017, 1703.07897.
- [2] J. Linsley, L. Scarsi, and B. Rossi. Extremely Energetic Cosmic-Ray Event. Physical Review Letters, 6:485–487, May 1961.
- [3] K. Greisen. End to the cosmic-ray spectrum? Phys. Rev. Lett., 16:748–750, Apr 1966.
- [4] G. T. Zatsepin and V. A. Kuz’min. Upper limit of the spectrum of cosmic rays. Soviet Journal of Experimental and Theoretical Physics Letters, 4:78, August 1966.
- [5] V. Berezinsky. Extragalactic cosmic rays and their signatures. Astroparticle Physics, 53:120–129, January 2014, 1301.0914.
- [6] A. Aab et al. Searches for Anisotropies in the Arrival Directions of the Highest Energy Cosmic Rays Detected by the Pierre Auger Observatory. Astrophys. J., 804(1):15, 2015, 1411.6111.
- [7] R. U. Abbasi et al. Indications of Intermediate-Scale Anisotropy of Cosmic Rays with Energy Greater Than 57 EeV in the Northern Sky Measured with the Surface Detector of the Telescope Array Experiment. Astrophys. J., 790:L21, 2014, 1404.5890.
- [8] B. A. Khrenov, M. I. Panasyuk, V. V. Alexandrov, et al. Space Program KOSMOTEPETL (project KLYPVE and TUS) for the study of extremely high energy cosmic rays. In H. Salazar, L. Villasenor, and A. Zepeda, editors, Observing Ultrahigh Energy Cosmic Rays from Space and Earth, volume 566 of American Institute of Physics Conference Series, pages 57–75, May 2001.
- [9] R. Benson and J. Linsley. Satellite Observation of Cosmic-Ray Air Showers. In Bulletin of the American Astronomical Society, volume 12 of Bulletin of the American Astronomical Society, page 818, September 1980.
- [10] R. Benson and J. Linsley. Satellite observation of cosmic ray air showers. In 17th International Cosmic Ray Conference, Paris, France, volume 8, pages 145–148, 1981.
- [11] M. I. Panasyuk, M. Casolino, G. K. Garipov, et al. The current status of orbital experiments for UHECR studies. Journal of Physics Conference Series, 632(1):012097, August 2015, 1501.06368.
- [12] G. K. Garipov, M. Yu. Zotov, P. A. Klimov, et al. The KLYPVE Ultra High Energy Cosmic Ray Detector on Board the ISS. Bull. Rus. Acad. Sci. Physics, 79(3):326–328, 2015.
- [13] T. Ebisuzaki, G. Medina-Tanco, and A. Santangelo. The JEM-EUSO mission. Advances in Space Research, 53:1499–1505, May 2014.
- [14] B. A. Khrenov. Design and development of space experiments KLYPVE and TUS for study of UHECR. Nuclear Physics B Proceedings Supplements, 113:115–122, 2002.
- [15] B. A. Khrenov, V. V. Alexandrov, D. I. Bugrov, et al. KLYPVE/TUS space experiments for study of ultrahigh-energy cosmic rays. Physics of Atomic Nuclei, 67:2058–2061, November 2004.
- [16] V. Abrashkin, V. Alexandrov, Y. Arakcheev, et al. The TUS space fluorescence detector for study of UHECR and other phenomena of variable fluorescence light in the atmosphere. Advances in Space Research, 37:1876–1883, 2006.
- [17] B. A. Khrenov, M. I. Panasyuk, G. K. Garipov, et al. Pioneering space based detector for study of cosmic rays beyond GZK Limit. In European Physical Journal Web of Conferences, volume 53 of European Physical Journal Web of Conferences, page 09006, June 2013.
- [18] J. H. Adams, S. Ahmad, J.-N. Albert, et al. Space experiment TUS on board the Lomonosov satellite as pathfinder of JEM-EUSO. Experimental Astronomy, 40:315–326, November 2015.
- [19] P. A. Klimov, M. I. Panasyuk, B. A. Krenov, and Lomonosov–UHECR/TLE Collaboration. The TUS detector of extreme energy cosmic rays on board the Lomonosov satellite. ArXiv e-prints, 2017, 1706.04976.
- [20] P. Klimov, B. Khrenov, S. Sharakin, et al. First results on transient atmospheric events from Tracking Ultraviolet Setup (TUS) on board the Lomonosov satellite. In A. Chilingarian, editor, Proc. of Int. Symposium TEPA-2016, pages 122–127, 2017.
- [21] M. Zotov and Lomonosov–UHECR/TLE Collaboration. Early results from TUS, the first orbital detector of extreme energy cosmic rays. ArXiv e-prints, March 2017, 1703.09484.
- [22] B. A. Khrenov, P. A. Klimov, M. I. Panasyuk, and Lomonosov–UHECR/TLE Collaboration. First results from the TUS orbital detector in the extensive air shower mode. ArXiv e-prints, April 2017, 1704.07704.
- [23] A. A. Grinyuk, A. V. Tkachenko, L. G. Tkachev, and TUS Collaboration. The TUS orbital detector optical system and trigger simulation. Journal of Physics Conference Series, 409(1):012105, February 2013.
- [24] A. Grinyuk, V. Grebenyuk, B. Khrenov, et al. The orbital TUS detector simulation. Astroparticle Physics, 90:93–97, 2017.
- [25] S. V. Biktemerova and M. O. Gonchar. Geant4 tool for simulation of arbitrarily defined Fresnel lenses. Physics of Particles and Nuclei Letters, 8:789–793, December 2011.
- [26] L. Tkachev, A. Grinyuk, M. Lavrova, and A. Tkachenko. The TUS orbital detector simulation. Proceedings of Science, page 610, 2015.
- [27] C. Berat, S. Bottai, D. De Marco, et al. Full simulation of space-based extensive air showers detectors with ESAF. Astroparticle Physics, 33:221–247, May 2010, 0907.5275.
- [28] N. P. Ilina, N. N. Kalmykov, and V. V. Prosin. Cherenkov radiation and parameters of extensive air showers. Sov. J. Nucl. Phys., 55:1540–1547, 1992. [Yad. Fiz.55,2756(1992)].
- [29] A. Grinyuk, M. Slunecka, A. Tkachenko, L. Tkachev, P. Klimov, and S. Sharakin. The method and results of measurement of the optical parameters of the UHECR detector for the TUS space experiment. Nuclear Instruments and Methods in Physics Research A, 763:604–609, November 2014.
- [30] R. K. Said, U. S. Inan, and K. L. Cummins. Long-range lightning geolocation using a VLF radio atmospheric waveform bank. Journal of Geophysical Research (Atmospheres), 115(D14):D23108, December 2010.
- [31] R. K. Said, M. B. Cohen, and U. S. Inan. Highly intense lightning over the oceans: Estimated peak currents from global GLD360 observations. Journal of Geophysical Research (Atmospheres), 118:6905–6915, July 2013.