Quasicontinuum -decay of 91,92Zr:
benchmarking indirect ()
cross section measurements for the -process
Abstract
Nuclear level densities (NLDs) and -ray strength functions (SFs) have been extracted from particle- coincidences of the 92Zr()92Zr and 92Zr()91Zr reactions using the Oslo method. The new 91,92Zr SF data, combined with photonuclear cross sections, cover the whole energy range from MeV up to the giant dipole resonance at MeV. The wide-range SF data display structures at MeV, compatible with a superposition of the spin-flip resonance and a pygmy resonance. Furthermore, the SF shows a minimum at MeV and an increase at lower -ray energies. The experimentally constrained NLDs and SFs are shown to reproduce known () and Maxwellian-averaged cross sections for 91,92Zr using the TALYS reaction code, thus serving as a benchmark for this indirect method of estimating () cross sections for Zr isotopes.
I Introduction
The interplay of the microscopic, quantum-mechanical regime and the macroscopic world is crucial for many physical systems. In nuclear astrophysics, various stellar environments and extreme cosmic events represent the playground for the nucleosynthesis, for which nuclear properties determine the outcome together with the astrophysical conditions.
For elements heavier than iron, two neutron capture processes BBFH57 ; Cameron57 dominate their creation. These two processes are characterized by the timescale, rapid () and slow (), in comparison with the -decay rates. Typically, the neutron energies are in the MeV range, corresponding to stellar temperatures of GK. The -process, although the astrophysical site is not yet firmly established Arnould2007 , takes place at such high neutron densities ( cm-3) that the neutron capture process totally dominates the competing decay until the neutron flux is exhausted. The -process ( GK and neutron density cm-3) operates at much longer time scales allowing for decay prior to the next neutron capture BBFH57 ; Cameron57 ; Arnould2007 .
The weak -process is believed to take place in massive stars ( kappeler2011 ) and produces most of the -abundances in the mass region between Fe and Zr, while the main -process operates in Asymptotic Giant Branch (AGB) stars and produces the heavier -process isotopes up to the lead/bismuth region kappeler2011 .
The neutron capture cross section is small for isotopes with magic neutron numbers. This results in bottlenecks for the reaction flow, giving rise to the buildup of sharp abundance maxima. This is reflected in the solar-system abundances: we find -process peaks at mass numbers and corresponding to the magic neutron numbers and , respectively Arnould2007 .
A crucial question is whether the nuclear system after neutron absorption will keep the neutron and emit rays to dissipate the energy, or rather eject the neutron or other particles/fragments and thereby produce other elements. For the -process, this may happen at the so-called branch points, where the -decay rate is comparable with the rate. The relative probability to keep the neutron depends strongly on the nucleus’ ability to emit rays, which is governed by the -ray strength function (SF) and the nuclear level density (NLD) of the compound system.
For zirconium isotopes, with semimagic proton number , and at/close to the closed shell, neutron-capture cross sections are typically low and one could question whether statistical approaches such as the Hauser-Feshbach framework hauser1952 is applicable. Further, this is the meeting point of the weak and main -process, and although 96Zr traditionally has been considered an -process isotope, it could be significantly produced Lugaro2003 through neutron capture on the branch point nucleus 95Zr, depending on its cross section and the neutron flux at the -process site.
However, since 95Zr is unstable with a half-life of 64 days, no direct cross-section measurement has been performed to date, and so only theoretical estimates are available. Recent work has discovered unexpected enhancements in the SF of several zirconium isotopes, such as the pygmy dipole resonance as well as strong transitions close to neutron threshold utsunomiya2008 ; Iwamoto2012 . The presence of such enhanced -decay probabilities in 95Zr could boost its neutron-capture rate.
Several applications may take advantage of better knowledge of the NLDs and SFs in the mass region. The production and destruction rates of 93Zr is interesting for the interpretation of the relative abundance of the radioactive 93Nb and 93Zr pair, which can be used to estimate the -process temperature and also, together with the 99Tc-99Ru pair, act as a chronometer to determine the time elapsed since the start of the -process Neyskens2015 . The 93Zr cross section has been measured up to 8 keV tagliente2013 , but contributions to the Maxwellian-averaged cross section at higher energies are based on theoretical calculations and would benefit from experimental constraints lugaro2014 .
In this work, we report on the NLDs and SFs for the 91,92Zr isotopes with neutron number and 52, respectively, and use our data as input for calculating the 90,91Zr cross sections with the reaction code TALYS Koning12 . As there exist direct measurements for these isotopes, we use these cases as a benchmark for our indirect method of determining the cross section in this mass region. These investigations are part of a larger campaign to study the branch-point neutron capture rates at the -process peak.
The outline of the present manuscript is as follows. In Sect. II the experiment and results are described. The NLDs and SFs are extracted by means of the Oslo method and compared with model calculations in Sects. III and IV, respectively. In Sect. V radiative neutron capture cross sections using the TALYS code and experimental NLDs and SFs as inputs are compared with known cross sections. A summary and an outlook are given in Sect. VI.
II Experimental results
The experiments were performed at the Oslo Cyclotron Laboratory (OCL) with 17-MeV and 28-MeV proton beams for the 92Zr()92Zr and 92Zr()91Zr reactions, respectively. The target was a 2 mg/cm2 thick metallic foil enriched to 95% in 92Zr.
The charged outgoing particles were measured with the SiRi system of 64 silicon telescopes with thicknesses of 130 and 1550 m, respectively siri . The Si detectors were placed in forward direction covering to relative to the beam. The typical energy resolutions measured with the telescopes were 75 and 95 keV full-width half maximum for the ()92Zr and ()91Zr reactions, respectively. By setting 2-dimensional gates on the two ( matrices, the outgoing charged ejectiles for the desired reactions were selected. Coincident rays for the residual 91,92Zr were measured with the CACTUS array CACTUS consisting of 28 collimated NaI(Tl) detectors with a total efficiency of % at MeV.
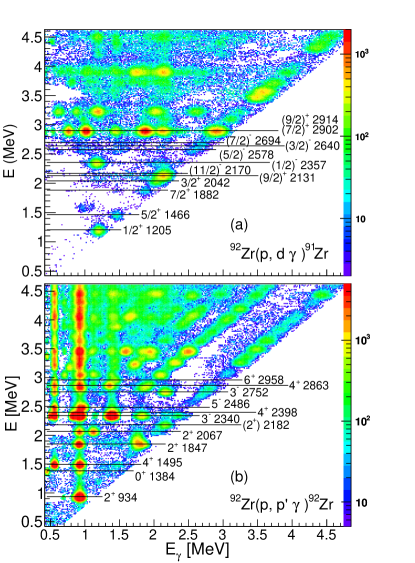
The first step in the analysis is to sort the -ray spectra as function of excitation energy. Knowing the details of the reaction kinematics, the excitation energy is given by the energy of the outgoing charged particle. Figure 1 shows the discrete part of the particle- matrices for the residual 91,92Zr with prompt coincidence requirements. The -ray spectra for each excitation energy has been unfolded with new NaI-response functions. The unfolding procedure Gut96 has proven to work very well also for continuum -ray spectra.
The -ray multiplicity as function of initial excitation energy can be calculated by the energy () and area () methods Gut87 :
| (1) | |||||
| (2) |
where is the average energy of the total -ray spectrum, is the intensity (area) of that spectrum, and is the intensity of the primary -ray spectrum.
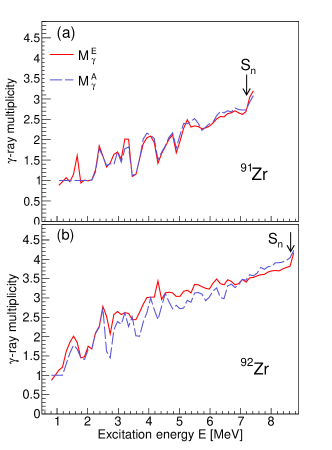
Figure 2 shows the -ray multiplicities and for the two reactions. There are practically no statistical errors in the data points due to the high number of counts in the -ray spectra. Since represents the most direct and transparent method, we use this quantity as the measure for the multiplicity, and as an indicator for systematical errors. We find significant deviation between the two methods only at a few excitation energies. For example a 60% deviation is found at MeV in 91Zr, which is due to a weak contamination peak of MeV located where no levels are expected for 91Zr.
The discrete part of the -ray matrices in Fig. 1 are characterized by isolated peaks in the two-dimensional landscape spanned by the initial excitation energy and the -ray energy . Several peaks tend to fall onto diagonals in the matrices. The diagonal with represents decay directly to the ground state with a -ray multiplicity of . We also recognize vertical and horisontal lines in the matrices. The vertical lines correspond to yrast transitions from the last steps in the -ray cascades. The horizontal lines appear when levels have high -ray multiplicity or several levels are bunched together in excitation energy.
For excitations below MeV, most of the levels and transitions are easily recognized by comparing with known data from literature NNDC . For 91Zr, we see that levels with spin/parity from up to () or even () are populated in the () reaction, as also reported by Blok et al. blok76 . The population of the latter two high-spin states are due to and transfer, probably involving the and neutron orbitals. A peculiar situation is seen for the (1/2)- 2357 keV level, which shows only one peak at MeV. The peak is actually the composition of two transitions with almost the same energies (1152 keV and 1205 keV). This is consistent with the -ray multiplicity of shown in Fig. 2.
Figure 1 (b) shows that the inelastic proton reaction on 92Zr populates a broad spin window ranging from to . Since the ground state spins of 91,92Zr are and , Fig. 2 reveals about one unit more of multiplicity for 92Zr compared to 91Zr. Only levels of the lowest part of the spin distribution of 92Zr can directly decay to the ground state. This is manifested by the dominant feeding into the diagonals of the first excited and states in Fig. 1 . We also observe the vertical lines corresponding to the transitions (561 keV) and (934 keV). As an example, the multiplicity spectrum of 92Zr has a peak with at MeV. This is mainly due to the first state that decay via the state into the ground state, giving . At about the same excitation energy, Fig. 1 (b) shows the decay path of the first state, which also goes via the state giving multiplicity .
The energy distribution of first-generation or primary rays can be extracted from the unfolded total -ray spectra of Figs. 1 (a) and (b). Let be the unfolded -ray spectrum at a certain initial excitation energy . Then the primary spectrum can be obtained by a subtraction of a weighted sum of spectra for below :
| (3) |
The weighting coefficients are determined by iterations as described in Ref. Gut87 . After a few iterations, the multiplicity of the primary spectrum should be , where the multiplicity of the total spectrum is determined by from Eq. (1). The obtained primary spectra are organized into a matrix that is normalized according to .
The next step of the Oslo method, is the factorization
| (4) |
where we assume that the decay probability is proportional to the NLD at the final energy according to Fermi’s golden rule dirac ; fermi . The decay is also proportional to the -ray transmission coefficient , which is assumed to be independent of excitation energy according to the Brink hypothesis brink ; guttormsen2016 .
The relation (4) makes it possible to simultaneously extract the two one-dimensional vectors and from the two-dimensional landscape . We use the iteration procedure of Schiller et al. Schiller00 to determine and by a least fit using relation (4). For this extraction, we have chosen the following part of the matrix: For 91Zr the excitation energy region is 5.0 MeV 7.2 MeV with MeV, and for 92Zr we choose 4.5 MeV 8.6 MeV with MeV.
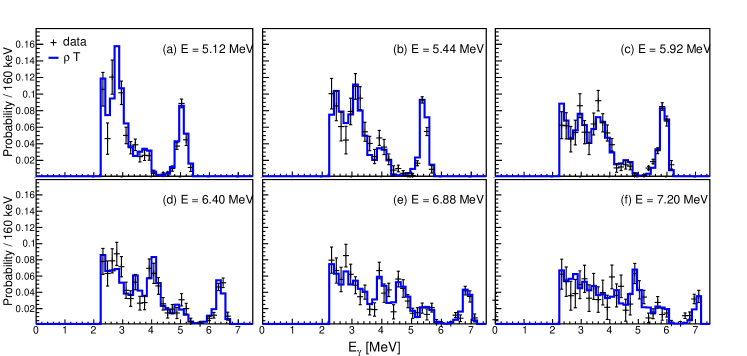
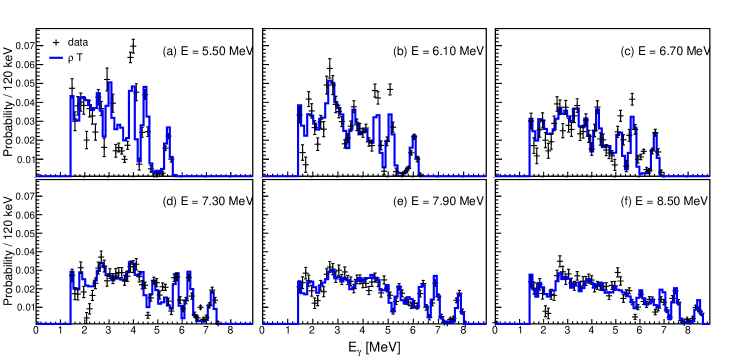
The applicability of relation (4) and the quality of the fitting procedure are demonstrated in Figs. 3 and 4 for 91,92Zr, respectively. The agreement is satisfactory when one keeps in mind that the -decay pattern fluctuates from level to level. With the rather narrow excitation energy bins of 160 and 120 keV for 91,92Zr, respectively, each -ray spectrum will be subject to significant Porter-Thomas fluctuations PT responsible for local deviations for individual primary spectra compared to the global average given by . It should be mentioned that only the spectra from a few excitation energy bins are shown, however, all spectra show the same agreement with . Further tests and justification of the Oslo method have been discussed in Ref. Lars11 .
III The nuclear level density
The functional form of and are uniquely identified through the fit, but the scale and slope of these functions are still undetermined. It is shown in Ref. Schiller00 that functions generated by the transformations:
| (5) | |||||
| (6) |
give identical fits to the primary -ray spectra, as the examples shown in Figs. 3 and 4. In the following, we will estimate the parameters and from systematics and other experimental data. The normalization of by the constant , only concerns the SF that will be discussed in the next subsection.
| Nucleus | [MeV] | [eV] | [meV] | [meV] | [meV] | [meV] |
|---|---|---|---|---|---|---|
| Ref. | Tagliente2008a ; Tagliente2008b | MugAtlas | Capote09 | Tagliente2008a ; Tagliente2008b ; MugAtlas | adopted | |
| 91Zr | 7.195 | 7179(233) | 170(20) | 130(20) | 180(137) | 130(40) |
| 92Zr | 8.635 | 514(15) | 140(40) | 134(16) | 131(56) | 140(40) |
The normalization of the NLD is determined by known levels at low excitation energies and the NLD at the neutron separation energy which can be estimated from the -wave resonance spacing Tagliente2008a ; Tagliente2008b , as listed in Table 1. However, such an extraction requires knowledge of the spin and parity distributions of the NLD at the neutron separation energy and is consequently model-dependent. For these reasons, two different NLD formulations are considered, namely the constant-temperature (CT) formula Koning08 ; Capote09 and the Hartree-Fock-Bogolyubov (HFB) plus combinatorial model Goriely08 (with ptable and ctable TALYS parameters), which give two quite different descriptions of the energy, spin and parity dependences of the NLD. In the case of the HFB plus combinatorial model, the NLD is tabulated and its spin and parity distributions determined by the underlying effective interaction. The total NLD deduced from the -wave resonance spacings are given in Table 2. Note that the HFB plus combinatorial model predicts that the NLD equiparity is achieved only above the neutron separation energy, at typically 9 MeV, in both 91,92Zr.
| Nucleus | |||
|---|---|---|---|
| [MeV-1] | [MeV-1] | [MeV-1] | |
| 91Zr | 7200 | 7440 | 7700 |
| 92Zr | 19560 | 20120 | 20700 |
In contrast, the CT formula is bound to assume an equiparity distribution and to follow a spin distribution given by Ericson
| (7) |
where at the neutron binding energy, is the spin and the energy-dependent spin cutoff parameter, which turns out to be the main contributor to the uncertainties in the estimate of the total NLD. The spin cutoff parameter is traditionally determined by a close-to rigid moment of inertia. Since Ericson and the nuclear temperature is assumed to be approximately constant for luciano2014 ; CT2015 , follows the energy dependence of the moment of inertia . We assume that is proportional to the number of quasiparticles, which again is proportional to . Thus, we write
| (8) |
which goes through two anchor points. The first point is determined from known discrete levels at excitation energy . The second point at is estimated assuming a rigid moment of inertia egidy2005 :
| (9) |
where is the mass number, and is the intrinsic excitation energy. The level NLD parameter and the energy shift parameter is determined according to Ref. egidy2005 .
In order to obtain a systematic error band, we multiply the rigid moment of inertia of Eq. (9) with a factor , which takes the values , 0.8 and 1.0 for the low (L), recommended (R) and high (H) values, respectively. The corresponding spin cutoff parameters and NLDs are listed in Table 3.
Comparing Tables 2 and 3, the HFB plus combinatorial model predicts significantly higher total NLD at that can hardly be taken into account by the parameter uncertainties in the CT approach. Both approaches will consequently be considered in the present analysis, not only for determining the NLD, but also the corresponding -ray strength function, as detailed below.
| Nucleus | a | |||||||||||
|---|---|---|---|---|---|---|---|---|---|---|---|---|
| [MeV-1] | [MeV] | [MeV] | [MeV-1] | [MeV-1] | [MeV-1] | [MeV] | [MeV] | |||||
| 91Zr | 9.84 | -0.03 | 2.5 | 3.1(2) | 3.83 | 4.42 | 4.95 | 4230(140) | 5590(180) | 6950(230) | 0.88(5) | -0.29(48) |
| 92Zr | 10.44 | 0.66 | 3.0 | 3.0(2) | 3.89 | 4.50 | 5.03 | 13500(390) | 16640(490) | 19840(580) | 0.90(2) | -0.02(21) |
When is estimated, we still need to bridge the energy gap between our data points and the estimated value. To do so, we use the corresponding NLD formula, i.e. the HFB plus combinatorial model in the first case and the CT formula in the second case Ericson
| (10) |
where the temperature and energy shift are free parameters adjusted to the data and given in Table 3 for the two Zr isotopes.
The experimental NLDs for 91,92Zr are shown in Fig. 5 for the CT approach and the HFB plus combinatorial model. In both cases, a rather CT pattern is found for the total NLD above typically 3 MeV, though their respective slopes are different following different predictions of the total NLD at .
IV The -ray strength function
The standard way to determine the remaining normalization coefficient of Eq. (6) is to constrain the data to the known total radiative width at Schiller00 ; voin1 , defined as
| (11) | |||||
where the summation and integration run over all final levels with spin that are accessible by or transitions with energy . This procedure is known to work well when the individual widths are centered around a common average value.
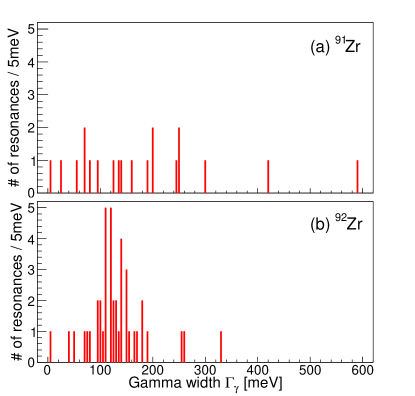
Columns 4 and 5 in Table 1 list the experimental values from literature MugAtlas ; Capote09 . However, Fig. 6 shows that the individual widths scatter much more than the experimental uncertainties for the individual widths, which are usually below meV. For 91Zr, we can hardly locate a common average as the data scatter from 5.5 to 590 meV. Thus, the standard method of calculating weighted average and uncertainties give unrealistic small errors in the case of 91Zr.
Therefore, we calculate instead the mean average of the widths and the standard deviation of these values by
| (12) | |||||
| (13) |
where is the number of resonances. The index indicates that these values are relevant for the determination of the coefficient . For 92Zr, we find reasonably consistent values of the average widths in columns 4, 5 and 6 of Table 1, and adopt the value meV. As expected, the uncertainty in the average width for 91Zr is very large.
To constrain the 91Zr data further, we use the photonuclear reaction data utsunomiya2008 ; berman1967 around to determine the value. The transformation from photonuclear cross section to SF is performed by Capote09 :
| (14) |
Note that the photoneutron cross section in the direct vicinity of the neutron threshold is not considered to estimate the corresponding SF, since in this region it remains also sensitive to the neutron channel and the SF can consequently not be deduced from the cross section in an unambiguous way.
In turn, the dipole SF, including both the and contributions, can be calculated from our measured transmission coefficient Capote09 through
| (15) |
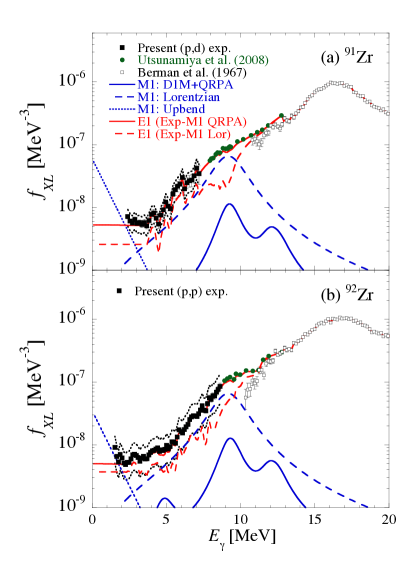
The corresponding experimental SFs for 91,92Zr are displayed as solid squares in Fig. 7. The figure also includes the SFs derived from 91,92Zr(, n) cross section data by Utsunomiya et al. utsunomiya2008 and Berman et al. berman1967 . As mentioned above, we have normalized our 91Zr data points to match the data at , as shown in Fig. 7. The adopted values used to normalize the SF and estimate the uncertainies are given in column 7 of Table 1.
Since our dipole strength includes both the and contributions, for estimating the average radiative width as well as the radiative neutron capture cross section of 90Zr, they need to be disentangled, especially in view of the non-equiparity of the NLD predicted within the HFB plus combinatorial approach Goriely08 . For this purpose, we have estimated the spin-flip resonance from two different approaches, namely the HFB plus Quasi-Particle Random Phase Approximation (QRPA) based on the Gogny D1M interaction Goriely16 and a Lorentzian function, both guided by a previous experimental analysis of photoneutron measurements utsunomiya2008 as well as () scattering data on 90Zr close to degrees Iwamoto2012 . Such experiments revealed an resonance located at a centroid energy MeV with a width MeV. At almost the same energies, an pygmy resonance with MeV and MeV has been found. Such structures at around 9.5 MeV have been reported also for the 92,94,96Zr isotopes Tamii2015 . For our sensitivity analysis, we consider both options, i.e. possible representations, including a strong Lorentzian with a peak cross section mb utsunomiya2008 as well as the D1M+QRPA strength, as shown in Fig. 7. The D1M+QRPA strength is seen to be significantly less than the phenomenological Lorentzian strength inferred in Ref. utsunomiya2008 giving rise to a stronger possible counterpart.
Finally, our measurements at the lowest energies (i.e. around 2 MeV) also suggest the presence of a low-energy enhancement (the so-called upbend) that has been suggested by shell model calculations to be of nature Brown14 ; schwengner2013 . For nuclei studied in this mass region with the Oslo method, we find a low-energy enhancement (upbend) of the SF Guttormsen2005 ; Spyrou2014 ; Larsen2016 ; Renstrom2016 ; Tveten2016 . The upbend has also been verified for 96Mo using another technique Wiedeking2012 .
To describe the low-energy enhancement, it is therefore important to include below 2 MeV an upbend that may influence not only the estimate of the total radiative width , but also the radiative neutron capture cross section. The upbend structure is described by the exponential function schwengner2013 ; spyrou2014
| (16) |
The adopted parameters and MeV for modelling the upbend of 91Zr and and MeV for 92Zr.
With this procedure, it is possible to disentangle from experimental data, the and components together with their relative model uncertainties for a sensitivity analysis. The resulting strengths deduced from the experimental strength by subtracting the D1M+QRPA or Lorentzian spin-flip contribution as well as the low-energy upbend, are shown in Fig. 7 for both Zr isotopes. Note that a constant strength function is assumed for energies , as indicated by shell model calculations Sieja17 and empirically described by the generalized Lorentzian approach Kopecky90 .
With these resulting and strengths and NLD (as detailed in Sect. III), we obtain for 91Zr a meV, after normalizing our 91Zr data points to match the data at . As mention above for 92Zr, we adopt meV to constrain the experimental dipole strength.
V The radiative neutron capture cross sections
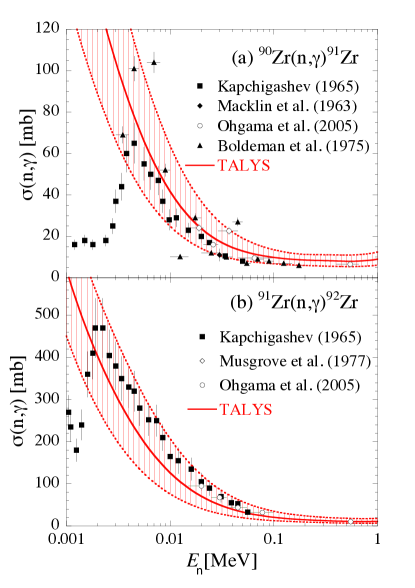
The NLD and SF derived in the previous sections can now be tested on the additional experimental data relative to the radiative neutron capture cross sections 90Zr()91Zr and 91Zr()92Zr. These cross sections essentially depend on the photon transmission coefficient of the final compound nucleus, hence to the NLD and SF obtained from the present experiments. We compare in Fig. 8 the experimentally known () cross sections with the theoretical calculations obtained with the TALYS reaction code Koning12 . Both cross section calculations use directly the and strength functions derived in the Sect. IV, assuming that the spin-flip resonance is given either by the D1M+QRPA or the Lorentzian strength and including an additional upbend. In all cases, the SF is firmly constrained by our dipole strength, with its lower and upper value determined on the basis of the uncertaintites affecting not only the - decomposition, but also the average radiative width and s-wave resonance spacing . Similarly, the NLD as derived in Sect. III are modelled either by the HFB plus combinatorial model or the CT formula, and in each case constrained on the experimental value with its upper and lower values. It should be mentioned that the upper (lower) limit for the NLD (i.e. lower (upper) value of the experimental ) is directly correlated to the upper (lower) limit for the derived dipole SF, as constrained by the . The careful account of all these uncertainties is translated into the hashed area displayed in Fig. 8.
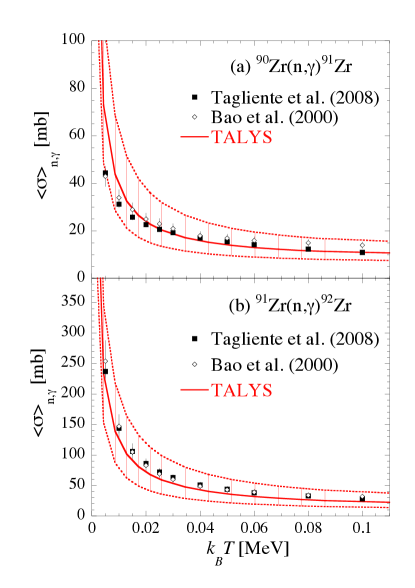
A similar comparison is made for the Maxwellian-averaged cross sections in Fig. 9. The upper cross sections are found with the upper value of the SF obtained with the D1M+QRPA model of the strength, while the lower cross section corresponds to the lower value based on the Lorentzian representation.
The main uncertainties in the present analysis stem from the 1–1 decomposition as well as the normalization of the experimental SF. Note that the intrinsic model uncertainties, using all available NLD and SF models in TALYS, yield a factor between the minimum and maximum cross sections in this mass region larsen-yttrium . Thus, although our indirect method gives a rather large error band, it is still a significant improvement compared to the range of possible values from the unconstrained model predictions. This analysis shows that the NLD and SF derived in the present work are fully compatible with the experimental radiative neutron capture cross sections and can therefore be expected to be a good representation of the statistical properties of the de-exciting compound nuclei 91Zr and 92Zr.
VI Summary and outlook
NLDs and SFs of 91,92Zr have been extracted from particle- coincidence data using the Oslo method. The data are normalized to neutron-resonance data and cross section data, taking into account systematic errors due to uncertain nuclear spin distributions as well as uncertainties in the extraction procedure and the external normalization data. Moreover, the SFs are decomposed into their and components based on state-of-the-art microscopic calculations of the strength, as well as a phenomenological description of the spin-flip resonance guided by previous measurements.
Our data, including all the possible normalization uncertainties, have been used as input for calculating 90,91Zr cross sections and MACS of relevance for the -process peak. We found that our indirect method of determining the MACS is fully compatible with direct measurements, giving confidence that this approach is capable of providing reasonable cross sections for cases where direct measurements are not available, such as the branch-point nucleus 95Zr. In the future, we will perform experiments at OCL to measure the 96Zr NLD and SF to deduce a first experimentally constrained 95Zr cross section and MACS.
Acknowledgements.
The authors wish to thank E. A. Olsen, A. Semchenkov and J. Wikne at the Oslo Cyclotron Laboratory for providing excellent experimental conditions. We are deeply grateful to A. Bürger for his significant contribution to this work. S. S. gratefully acknowlegde funding by the Research Council of Norway (NFR), project grant no. 210007. A. C. L. gratefully acknowledges financial support from the Research Council of Norway, project grant no. 205528 and from the ERC-STG-2014 under grant agreement no. 637686. S. G. acknowledges the support from the F.R.S.-FNRS. A. V. acknowledges the grant from Deparment of Energy no. DE-NA0002905.References
- (1) E. M. Burbidge, G. R. Burbidge, W. A. Fowler, and F. Hoyle, Rev. Mod. Phys. 29, 547 (1957).
- (2) A. G. W. Cameron, Pub. Astron. Soc. Pac. 69, 201 (1957).
- (3) M. Arnould, S. Goriely, and K. Takahashi, Phys. Rep. 450, 97 (2007).
- (4) F. Käppeler, R. Gallino, S. Bisterzo and Wako Aoki, Rev. Mod. Phys. 83, 157 (2011) and references therein.
- (5) W. Hauser and H. Feshbach, Phys. Rev. 87, 366 (1952).
- (6) M. Lugaro, F. Herwig, J. C. Lattanzio, R. Gallino, and O. Straniero, Astrophys. J. 586, 1305 (2003).
- (7) H. Utsunomiya et al., Phys. Rev. Lett. 100, 162502 (2008).
- (8) C. Iwamoto et al., Phys. Rev. Lett. 108, 262501 (2012).
- (9) P. Neyskens, S. Van Eck, A. Jorissen, S. Goriely, L. Siess, and B. Plez, Nature 517 174 (2015).
- (10) G. Tagliente et al., Phys. Rev. C 87, 014622 (2013).
- (11) M. Lugaro, G. Tagliente, A. I. Karakas, P. M. Milazzo, F. Käppeler, A. M. Davis, and M. R. Savina, Astrophys. J. 780, 95 (2014).
- (12) A. J. Koning, D. Rochman, Nuclear Data Sheets 113, 2841 (2012).
- (13) M. Guttormsen, A. Bürger, T. E. Hansen, and N. Lietaer, Nucl. Instrum. Methods Phys. Res. A 648, 168 (2011).
- (14) M. Guttormsen, A. Atac, G. Løvhøiden, S. Messelt, T. Ramsøy, J. Rekstad, T. F. Thorsteinsen, T.S. Tveter, and Z. Zelazny, Phys. Scr. T 32, 54 (1990).
- (15) M. Guttormsen, T. S. Tveter, L. Bergholt, F. Ingebretsen, and J. Rekstad, Nucl. Instrum. Methods Phys. Res. A 374, 371 (1996).
- (16) M. Guttormsen, T. Ramsøy, and J. Rekstad, Nucl. Instrum. Methods Phys. Res. A 255, 518 (1987).
- (17) Data from the NNDC On-Line Data Service database; available at http://www.nndc.bnl.gov/nudat2/.
- (18) H. P. Blok, L. Hulstman, E. J. Kaptein, and J. Blok, Nucl. Phys. A273, 142 (1976).
- (19) P. A. M. Dirac, ”The Quantum Theory of Emission and Absortion of Radiation”. Proc. R. Soc. Lond. A 1927 114, 243-265.
- (20) E. Fermi, Nuclear Physics. University of Chicago Press (1950).
- (21) D. M. Brink, doctorial thesis, Oxford University, 1955.
- (22) M. Guttormsen, A. C. Larsen, A. Görgen, T. Renstrøm, S. Siem, T. G. Tornyi and G. M. Tveten, Phys. Rev. Lett. 116, 012502 (2016).
- (23) A. Schiller, L. Bergholt, M. Guttormsen, E. Melby, J. Rekstad, and S. Siem, Nucl. Instrum. Methods Phys. Res. A 447 494 (2000).
- (24) T. Porter and R. G. Thomas, Phys. Rev. 104, 483 (1956).
- (25) A. C. Larsen et al., Phys. Rev. C 83, 034315 (2011).
- (26) G. Tagliente et al., Phys. Rev. C 77, 035802 (2008).
- (27) G. Tagliente et al., Phys. Rev. C 78, 045804 (2008).
- (28) S. F. Mughabghab, Atlas of Neutron Resonances (Elsevier Science, Amsterdam, 2006). 5th ed.
- (29) R. Capote, M. Herman, P. Oblozinsky, et al., Nuclear Data Sheets 110, 3107 (2009). Reference Input Library RIPL-3 available online at http://www-nds.iaea.org/RIPL-3/
- (30) A. J. Koning, S. Hilaire, S. Goriely, Nucl. Phys. A 810, 13 (2008).
- (31) S. Goriely, S. Hilaire, and A.J. Koning, Phys. Rev. C 78, 064307 (2008).
- (32) T. Ericson, Nucl. Phys. A 11, 481 (1959).
- (33) L. G. Moretto, A. C. Larsen, F. Giacoppo, M. Guttormsen, S. Siem, and A. V. Voinov, arXiv:1406.2642 [nucl-th] (2014).
- (34) M. Guttormsen et al., Eur. Phys. J. A 51, 170 (2015).
- (35) T. von Egidy and D. Bucurescu, Phys. Rev. C 72, 044311 (2005);73, 049901(E)(2006).
- (36) A. Voinov, M. Guttormsen, E. Melby, J. Rekstad, A. Schiller, and S. Siem, Phys. Rev. C 63, 044313 (2001).
- (37) B. L. Berman et al., Phys. Rev. 162, 1098 (1967).
- (38) S. Goriely et al., Phys. Rev. C 94, 034306 (2016).
- (39) A. Tamii, COMEX5 2015, available online at http://comex5.ifj.edu.pl/slides/tamii.pdf
- (40) B. A. Brown and A. C. Larsen, Phys. Rev. Lett. 113, 252502 (2014).
- (41) R. Schwengner, S. Frauendorf, and A. C. Larsen, Phys. Rev. Lett. 111, 232504 (2013).
- (42) M. Guttormsen, R. Chankova, U. Agvaanluvsan, E. Algin, L. A. Bernstein, F. Ingebretsen, T. Lönnroth, S. Messelt, G. E. Mitchell, J. Rekstad, A. Schiller, S. Siem, A. C. Sunde, A. Voinov, and S. Ødegård, Phys. Rev. C 71, 044307 (2005).
- (43) A. C. Larsen et al., Phys. Rev. C 93, 045810 (2016).
- (44) A. Spyrou, S. N. Liddick, A. C. Larsen, M. Guttormsen, K. Cooper, A. C. Dombos, D. J. Morrissey, F. Naqvi, G. Perdikakis, S. J. Quinn, T. Renstrøm, J. A. Rodriguez, A. Simon, C. S. Sumithrarachchi, and R. G. T. Zegers, Phys. Rev. Lett. 113, 232502 (2014).
- (45) T. Renstrøm et al., Phys. Rev. C 93, 064302 (2016).
- (46) G. M. Tveten et al., Phys. Rev. C 94, 025804 (2016).
- (47) M. Wiedeking, L. A. Bernstein, M. Krticka, D. L. Bleuel, J. M. Allmond, M. S. Basunia, J. T. Burke, P. Fallon, R. B. Firestone, B. L. Goldblum, R. Hatarik, P. T. Lake, I.-Y. Lee, S. R. Lesher, S. Paschalis, M. Petri, L. Phair, and N. D. Scielzo, Phys. Rev. Lett. 108, 162503 (2012).
- (48) A. Spyrou, S. N. Liddick, A. C. Larsen, M. Guttormsen, K. Cooper, A. C. Dombos, D. J. Morrissey, F. Naqvi, G. Perdikakis, S. J. Quinn, T. Renstrøm, J. A. Rodriguez, A. Simon, C. S. Sumithrarachchi, and R. G. T. Zegers, Phys. Rev. Lett. 113, 232502 (2014).
- (49) K. Sieja, private communication (2017).
- (50) J. Kopecky and M. Uhl, Phys. Rev. C 41, 1941 (1990).
- (51) S. P. Kapchigashev, Atomnaya Energiya 19, 294 (1965)
- (52) R. L. Macklin, T. Inada, J. H. Gibbons, Bulletin of the American Physical Society 8, 81(1963)
- (53) K. Ohgama, M. Igashira, T. Ohsaki, In Symp. on Capt. Gamma Ray Spectroscopy (Notre Dame), p. 3733 (2005)
- (54) A. R. DeL. Musgrove, J. W. Boldeman, B. J. Allen, J. A. Harvey, R. L. Macklin, Australian Journal of Physics 30, 391 (1977).
- (55) Z. Y. Bao et al., Atomic Data and Nuclear Data Tables 76, 70 (2000).
- (56) A. C. Larsen et al., Phys. Rev. C 93, 045810 (2016).