OMEGA – OSIRIS Mapping of Emission-line Galaxies in A901/2: III. – Galaxy Properties Across Projected Phase Space in A901/2
Abstract
We conduct a comprehensive projected phase-space analysis of the A901/2 multi-cluster system at . Aggregating redshifts from spectroscopy, tunable-filter imaging, and prism techniques, we assemble a sample of 856 cluster galaxies reaching in stellar mass. We look for variations in cluster galaxy properties between virialised and non-virialised regions of projected phase-space (PPS). Our main conclusions point to relatively gentle environmental effects, expressed mainly on galaxy gas reservoirs. (1) Stacking the four subclusters in A901/2, we find galaxies in the virialised region are more massive, redder, and have marginally higher Sèrsic indices, but their half-light radii and Hubble types are not significantly different. (2) After accounting for trends in stellar mass, there is a remaining change in rest-frame colour across PPS. Primarily, the colour difference is due to an absence in the virialised region of galaxies with rest-frame and moderate-to-high ( ) stellar mass. (3) There is an infalling population of lower-mass ( ), relatively blue () elliptical or spheroidal galaxies that is strikingly absent in the virialised region. (4) The number of bona-fide star-forming and AGN galaxies in the PPS regions is strongly dictated by stellar mass. However, there remains a reduced fraction of star-forming galaxies in the centres of the clusters at fixed stellar mass, consistent with the star-formation-density relation in galaxy clusters. (5) There is no change in specific H-derived star-formation rates of star-forming galaxies at fixed mass across the cluster environment. This suggests that preprocessing of galaxies during infall plays a prominent role in quenching star formation.
keywords:
galaxies: distances and redshifts – galaxies: clusters – astronomical instrumentation: interferometers1 Introduction
In hierarchical models of galaxy evolution, observable properties of galaxies, such as structure and star formation history, are determined by different mass assembly mechanisms, secular processes, and environment. In particular, hierarchical growth proceeds through gas and stars assembled via major (e.g., Toomre 1977; Barnes 1988; Khochfar & Silk 2006, 2009; Hopkins et al. 2009) and minor (e.g., Hopkins et al. 2009; Oser et al. 2012; Hilz et al. 2013) mergers with other galaxies, as well as gas accretion from the halo and cold streams (e.g., Birnboim & Dekel 2003; Dekel & Birnboim 2006; Kereš et al. 2005; Ocvirk et al. 2008). Bar-driven gas inflows can efficiently redistribute angular momentum and mass, and drive internal secular evolution (e.g., Kormendy 1993; Kormendy & Kennicutt 2004; Jogee et al. 2005). In high-density environments (e.g., rich galaxy clusters), physical processes such as ram-pressure stripping (Gunn & Gott 1972; Fujita & Nagashima 1999), galaxy harassment (Barnes & Hernquist 1991; Moore et al. 1996; Hashimoto et al. 1998; Gnedin 2003), and strangulation (Larson et al. 1980) can alter star formation history and galaxy stellar structure.
Yet, after over a century of exploring galaxies, we are still grappling with questions of how galaxies form and evolve in different environments across cosmic time. It is well known that strong observational differences exist between the morphology, colour, and star formation of galaxies in field-like environments and in rich clusters, particularly at low () redshifts (e.g., Dressler 1980; Butcher & Oemler 1984; Poggianti et al. 2001, 2008; Postman et al. 2005; Tran et al. 2005; Cooper 2007, 2008; Lidman et al. 2008; Patel et al. 2009; Bauer et al. 2011). For instance, present-day clusters are dominated by galaxies with elliptical or S0 morphologies, while spirals dominate low-density, field-like environments (e.g., Dressler 1980; Postman & Geller 1984; Norberg et al. 2002; Goto et al. 2003; Blanton et al. 2005; Postman et al. 2005; Desai et al. 2007; Wolf et al. 2007; Ball, Loveday & Brunner 2008).
Most previous studies of galaxy environment are two-dimensional and subject to large uncertainties from projection effects, particularly in clusters where environmental effects are expected to be strongest. Truly understanding the role of galaxy environment on galaxy evolution requires a three-dimensional analysis that considers location in the “projected” phase-space (PPS) of cluster-centric radius and line-of-sight velocity.
Recent simulations (e.g., Mahajan, Mamon & Raychaudhury 2011; Oman, Hudson & Behroozi 2013) have demonstrated that a galaxy’s orbital history is predictive of the region in phase-space that it occupies. In particular, infalling galaxies can be distinguished from galaxies in the virialised cluster core. Thus, it is possible to infer the assembly history of galaxy clusters by correlating phase-space to other observable galaxy properties.
In the last few years, galaxy phase-space has been exploited by several authors in efforts to understand galaxy properties like star formation and gas stripping (Hernández-Fernández et al. 2014), quenching timescales (Muzzin et al. 2014; Taranu et al. 2014), HI stripping in galaxies (Jaffé et al. 2015), and galaxy dust temperatures (Noble et al. 2016).
Here, we present our own study of phase-space in the A901/2 multi-cluster system at . This study jointly exploits two complementary observing campaigns focused on A901/2, the OSIRIS Mapping of Emission-line Galaxies in A901/2 (OMEGA) survey (Chies-Santos et al. 2015; Rodríguez del Pino et al. 2017), which measured redshifts from the H and [Nii] emission lines of galaxies in A901/2, and the Space Telescope A901/2 Galaxy Evolution Survey (STAGES, Gray et al. 2009). These surveys yield complementary information about galaxy structure and star formation history.
In Section 2, we combine multiple galaxy redshift surveys to assemble a representative sample of 856 galaxies complete in stellar mass down to . In Section 3 we outline our phase-space analysis. In Section 4, we investigate how galaxy properties vary across phase-space and stellar mass. By comparing galaxy properties in regions of the PPS that statistically separate the infalling population from the population of the virialised region, we can attempt to disentangle which physical processes are influencing galaxies at various points during their accretion history onto the clusters. We discuss the broader implications of our results in Section 5, and in Section 6 we summarise our findings.
We adopt a flat cold dark matter cosmology with and = 70 km s-1 Mpc-1. We use Vega magnitudes throughout the paper.
2 Data and Sample Selection
The multi-wavelength STAGES survey covers the A901/2 system of four subclusters at . The available photometry includes the 17-band Classifying Objects by Medium-Band Observations survey (COMBO-17; Wolf et al. 2003), covering arcmin2 (Mpc2). Additionally, (-band)Hubble Space Telescope (HST) Advanced Camera for Surveys imaging was obtained by Gray et al. (2009) covering % of the COMBO-17 footprint, with gaps only at the outer edge (see geometric coverage in Figure 2 of Gray et al. 2009). 24 m photometric coverage from Spitzer (Bell et al. 2007), and X-ray data from XMM-Newton (Gilmour et al. 2007) are also available. Hubble morphological types were derived by Wolf et al. (2009) from visual classification of the HST images.
Photometric redshifts (Wolf et al. 2003) and stellar masses (Borch et al. 2006) have been calculated from the COMBO-17 spectral energy distributions (SEDs). Galaxies have been grouped into one of three SED categories (“Blue Cloud”, “Dusty Red”, or “Old Red”) by Wolf, Gray, & Meisenheimer (2005) based on application of a red sequence cut suggested by Bell et al. (2004) for COMBO-17. “Blue Cloud” galaxies are the star-forming galaxies on the blue side of the cut. “Old Red” galaxies are dust-free red sequence galaxies with . “Dusty Red” galaxies are red sequence galaxies with .
The SED type naming convention is somewhat misleading as “Dusty Red” galaxies do not contain more dust than “Blue Cloud” galaxies, but their ongoing star formation is confined to more dust obscured regions. Wolf, Gray & Meinenheimer (2005) and Wolf et al. (2009) demonstrated the “Dusty Red” galaxies are actively forming stars at rates times lower than “Blue Cloud” galaxies at fixed mass. See Rodríguez del Pino et al. (2017) for additional discussion of these SED types.
Our cluster dataset further includes redshifts derived from spectroscopic, prism, and narrow-band imaging techniques. These redshifts are discussed below in detail.
2.1 Spectroscopic Redshifts
Spectroscopic follow-up of targeted galaxies was carried out with the 2 degree Field (2dF) spectrograph on the Anglo-Australian Telescope and the Very Large Telescope (VLT) VIsible MultiObject Spectrograph (VIMOS) instrument.
The 2dF observations (Gray et al. 2009) prioritised galaxies in the multi-cluster photometric redshift space having -band magnitude and ultimately yielded redshifts for 356 galaxies. The 2dF redshifts () were measured from the Ca H and K absorption features and cross-correlation of the spectra with templates. The VIMOS campaign (Bösch et al. 2013) provides spectra for 200 galaxies having visually confirmed disk components in the images, a star-forming SED, and an inclination angle ∘. VIMOS Redshifts () were measured from emission lines in 188 cases and absorption lines in the other 12 cases.
Gray et al. (2009) report a redshift accuracy for 2dF of . Bösch et al. (2013) find a VIMOS redshift accuracy of , based on 16 galaxies included in more than one mask. For the 39 galaxies with redshifts from both surveys, the average of the 2dF and VIMOS redshifts is adopted.
2.2 Prism Redshifts
Additional optical spectra were acquired with the Inamori Magellan Areal Camera and Spectrograph (IMACS) on the Baade I 6.5 m telescope at Las Campanas following the prism spectroscopy method devised by the PRIsm MUlti-object Survey (PRIMUS, Coil et al. 2011) team. IMACS can observe objects simultaneously in an 0.18 deg2 field of view, yielding more simultaneous spectra than traditional spectroscopic methods but at lower spectral resolving power (). The galaxies for which successful redshifts are observed with this approach are disproportionately red, massive, and have early Hubble types.
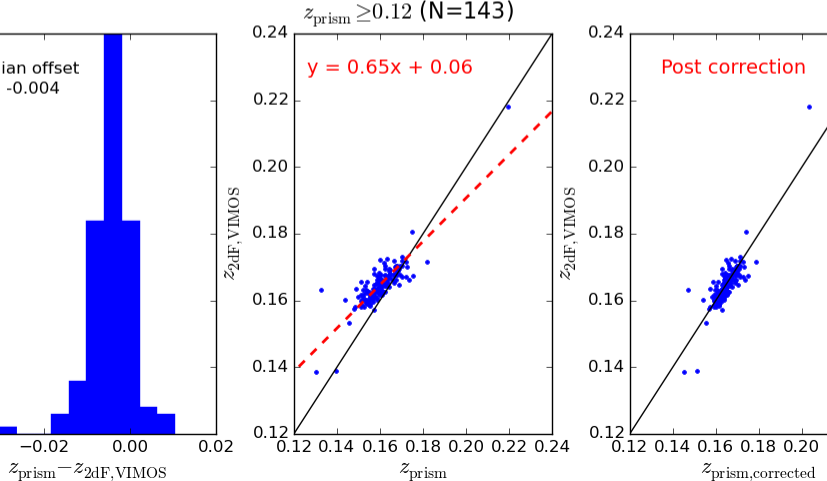
The accuracy of the prism redshifts () is evaluated with the subset of 143 sources with spectroscopic redshifts and (note, the prism redshifts catastrophically disagree with the spectroscopic redshifts for ). The left panel of Figure 1 shows the prism redshifts are systematically lower than the spectroscopic redshifts by a median shift of 0.004. The middle panel indicates this offset has a redshift dependence that can be modelled as a straight line. Corrections derived from a linear model are applied to all prism redshifts so they better match the spectroscopic redshifts. The post-correction redshift scatter is for this subset.
2.3 Emission-Line Redshifts From OMEGA
OMEGA is based on a 90 h ESO Large Programme survey with the Optical System for Imaging and low Resolution Integrated Spectroscopy (OSIRIS) instrument (Cepa et al. 2013) on the 10.4 m Gran Telescopio Canarias (GTC) telescope. The survey was designed to yield deep, spatially resolved emission-line images covering the H and [Nii] lines (–Å) for galaxies in the STAGES multi-cluster. OMEGA covers arcmin2, % of the COMBO-17 footprint. Furthermore, 95% of the OMEGA survey area is also covered by STAGES HST imaging (see Figure 1 of Chies Santos et al. 2015 for a detailed description of the survey geometry).
Low-resolution, Å full width at half maximum (FWHM) emission-line spectra containing 36 to 48 data points each were generated from the Fabry-Pérot narrow-band imaging using two different apertures. The radius of the aperture corresponds to 2.5 times the second central moment of the light distribution in the STAGES catalogue. The diameter of the second, smaller aperture matches the 1.2 arcsec FWHM point spread function (PSF) of the OSIRIS tunable filter imaging. The spectra have an absolute wavelength calibration of Å, equal to of the instrumental resolution (Weinzirl et al. 2015). From the OMEGA spectra, redshifts, H fluxes (), [Nii] fluxes (if detected), and H equivalent widths () are measured via Bayesian Markov Chain Monte Carlo (MCMC) techniques. Chies-Santos et al. (2015) and Rodríguez del Pino et al. (2017) provide details on the survey implementation and spectral fitting.
The OMEGA sample of emission-line galaxies is defined with cuts in H flux ( erg/s/cm2), H equivalent width (Å), and photometric redshift. All sources in OMEGA that meet the cuts in flux and equivalent width, including contaminants and spurious detections, have emission-line redshifts () in the narrow range [0.150, 0.176]. A cut in photometric redshift is necessary to isolate the true members of A901/2. We choose to restrict photometric redshift to the range [0.126, 0.200], which was derived by widening the [0.150, 0.176] range by the 3 uncertainty (0.024) in photometric redshift for a source with -band magnitude 20.5, the median brightness of OMEGA detections (see also Rodríguez del Pino et al. 2017).
Galaxy spectra meeting the cuts in , , and photometric redshift are visually inspected for quality. Each spectrum is reviewed independently by three classifiers. Spectra flagged two or more times for poor quality are removed from further consideration. After visual classification, there are 439 large-aperture galaxy spectra in which H is detected (321 of these also show [Nii]) and 360 PSF-aperture spectra containing both H and [Nii].
Among galaxies with existing redshifts from 2dF/VIMOS, OMEGA detects all galaxies having rest-frame . More importantly, the majority (270) of the OMEGA detections did not previously have spectroscopic or prism redshifts. The new redshifts are an important addition because OMEGA preferentially selects a population of blue star-forming galaxies that is under-represented in the 2dF and prism redshifts (note, the VIMOS redshift sample was selected based on a star-forming SED type).
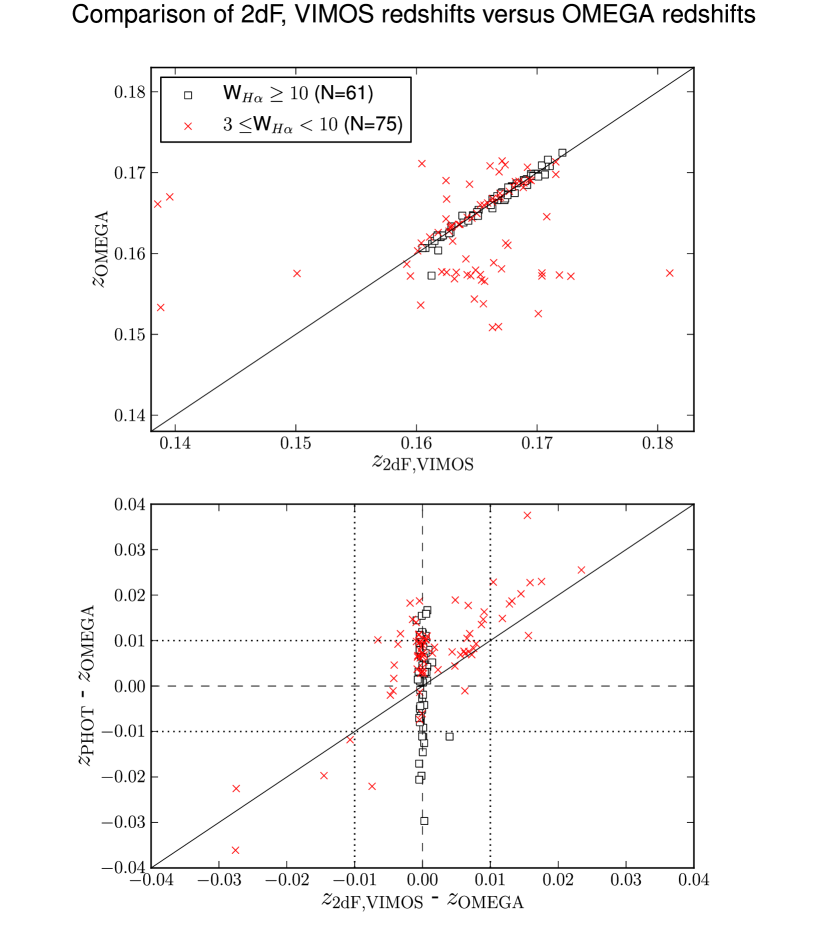
The top panel of Figure 2 compares the OMEGA redshifts to the spectroscopic redshifts for the 136 galaxies in OMEGA meeting the cuts in , , and photometric redshift. The agreement is almost perfect for sources with Å and some additional sources with lower equivalent width. There are 44 sources of low equivalent width (Å) having OMEGA redshifts offset by from the spectroscopic measurement, compared to just two at Å.
The bottom panel of Figure 2 compares the offsets of the OMEGA redshifts from the photometric and spectroscopic redshifts ( versus ). Data points on the line of equality in the top panel are now on the dashed line. The problematic OMEGA redshifts are generally offset from the spectroscopic and photometric redshifts in the same diagonal direction (i.e., they are smaller), suggesting the OMEGA redshifts are inaccurate because of spurious detections or inaccurate emission-line identification.
The standard deviation of the residuals between the spectroscopic and OMEGA redshifts is for and for . Among the 439 galaxy spectra passing visual inspection, there are 120 with and 319 with , so the average weighted error in the OMEGA redshifts is .
2.4 Definition of Parent and Redshift Samples
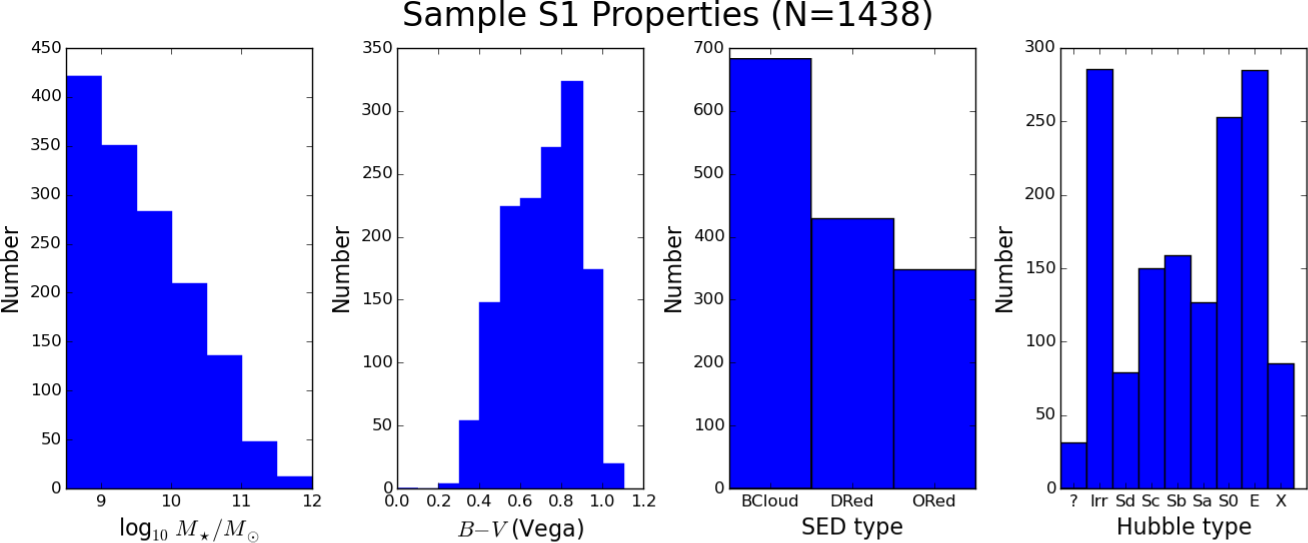
The sample of galaxies used for the PPS analysis is presented here. We first define a parent sample S1 of 1438 STAGES galaxies from cuts in stellar mass ( ) and photometric redshift [0.126, 0.200] to match the OMEGA sample (Section 2.3). We further define selection criteria using STAGES catalogue flags from Gray et al. (2009) to require galaxies be in the COMBO-17 footprint () and to have been detected in the imaging (). Most () of S1 galaxies are “cluster member” galaxies having STAGES catalogue flag . This selects all galaxies according to the definition of “cluster” in Figure 13 of Gray et al. (2009). Figure 3 shows histogram distributions for stellar mass, colour, SED type, morphology of S1. The mass function of S1 does not turn over above . Gray et al. (2009) show STAGES is complete for , which corresponds to (Maltby et al. 2010). The completeness of our sample should be somewhat less than given our choice of mass cut.
Some of the OMEGA detections (Section 2.3) are excluded from S1 because they either fall below the stellar mass limit or they have . S1 contains 397/439 OMEGA galaxies with large-aperture spectra and 329/360 galaxies with PSF-aperture spectra.
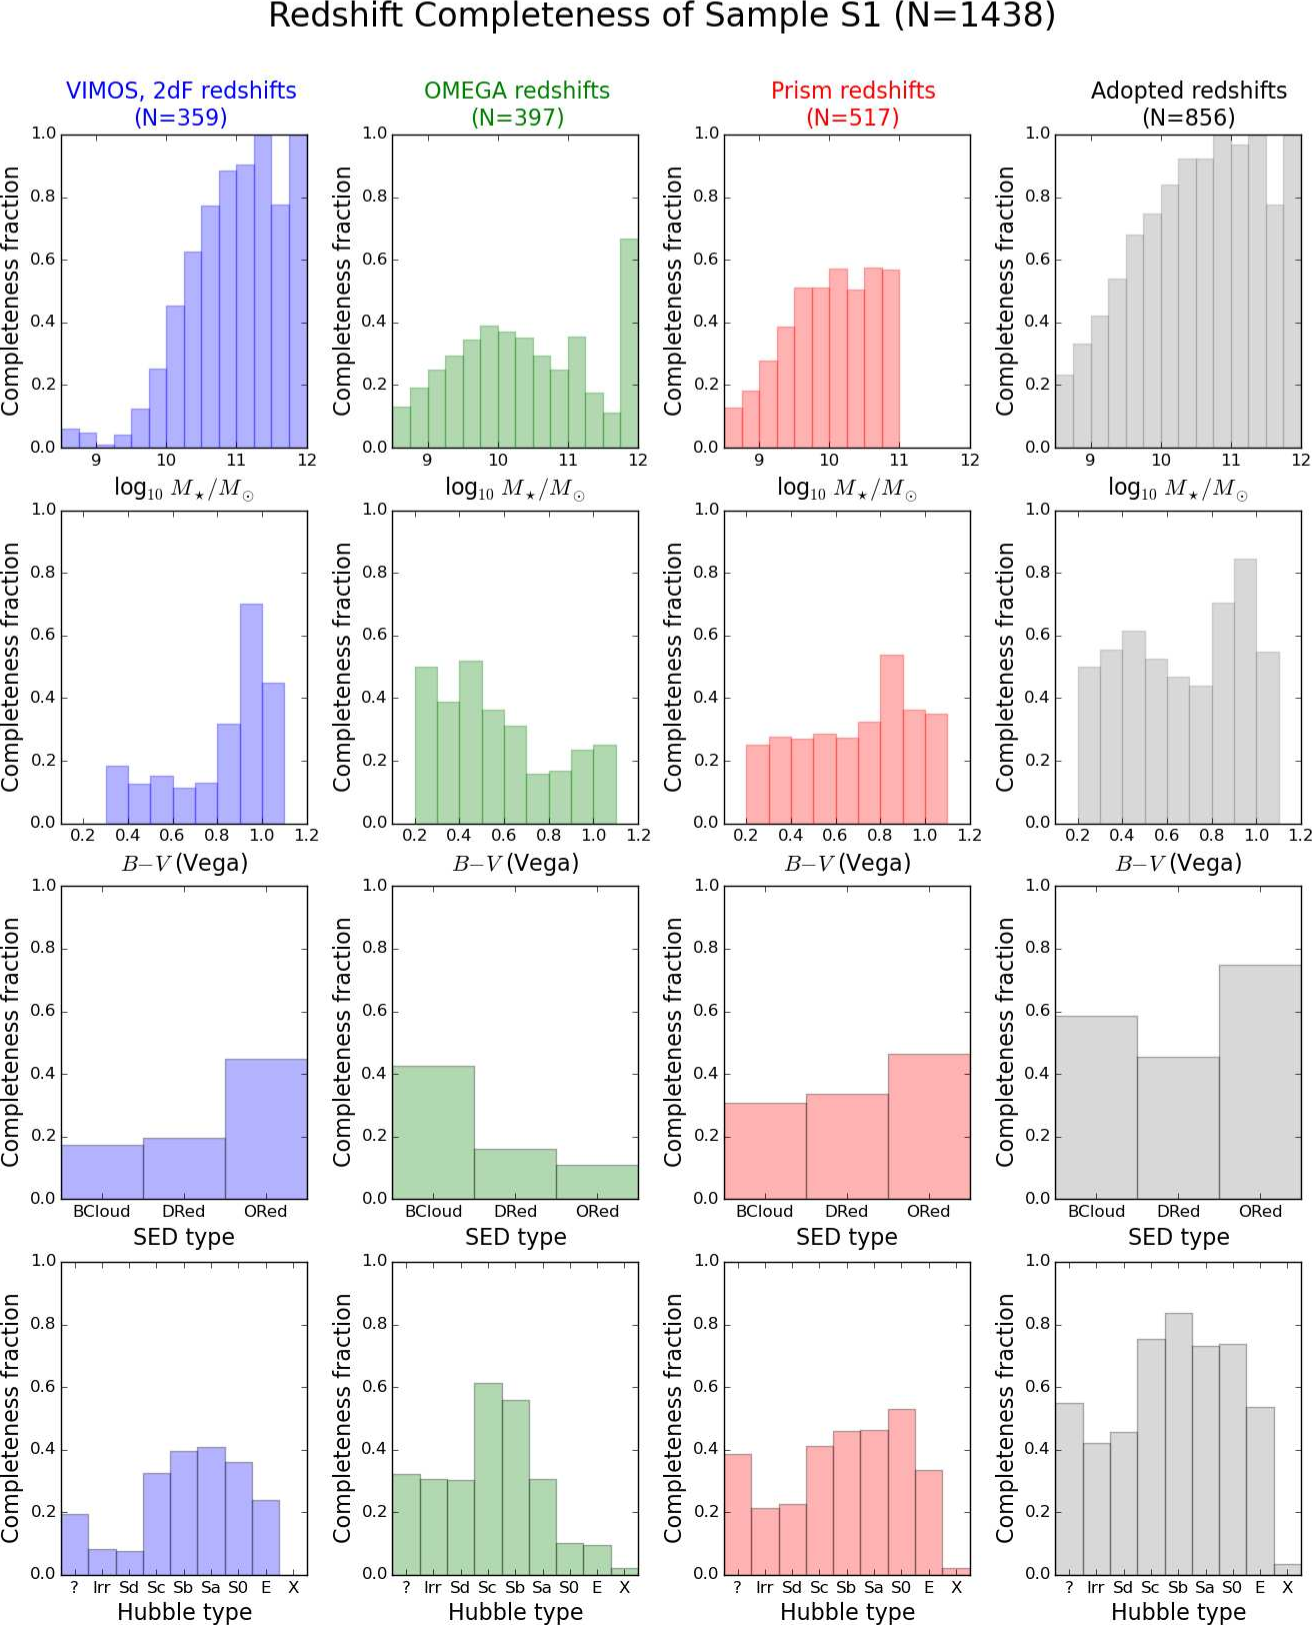
Figure 4 shows the redshift completeness fractions for sample S1 in terms of stellar mass, colour, SED type, and morphology for the different redshift measures. The inherent selection bias of each redshift technique is apparent in columns 1–3. The spectroscopic and prism redshift samples have relatively few blue, star-forming galaxies, which is the dominant population detected by OMEGA.
Sample S2 is constructed from the 856 galaxies with redshift measurements. The best available redshift, in descending order of spectral resolution (2dF/VIMOS, OMEGA, and prism spectroscopy) is chosen for each galaxy. Column 4 of Figure 4 represents sample S2. The redshift completeness in stellar mass is for , is across colour, and is for Hubble types E to Sc. Including galaxies uniquely detected by OMEGA in this analysis increases the number of redshifts by over what just VIMOS/2dF and prism spectroscopy provide alone.
Sample S2, while limited in completeness, benefits from combining the sensitivities of each of the three redshift surveys it was built from. The result is a sample covering a much better range of galaxy properties (colour, SED type, morphology). We will use this sample throughout the rest of the paper. Sample S2 contains 856 galaxies, of which 359 have redshifts based on 2dF/VIMOS spectroscopy, 273 based on OMEGA data, and 224 based on prism observations.
3 Phase Space
For the purposes of the dynamical analysis in this paper we subdivide the field into regions surrounding four main subclusters. Here we are guided by the luminosity-weighted maps of photometrically selected cluster members and peaks in the gravitational lensing mass maps (Gray et al. 2002; Heymans et al. 2008).
For sample S2, the positions of galaxies in PPS are calculated relative to the nearest subcluster in A901/2. Specifically, we use the subcluster-centric radius normalised by the subcluster virial radius () and the peculiar line-of-sight rest-frame velocity normalised by the subcluster galaxy velocity dispersion (). We adopt the subcluster centres and from the “one-halo” models fitted by Heymans et al. (2008). We use the definition
| (1) |
where is the speed of light and is the subcluster redshift.
Mean subcluster redshifts and velocity dispersions are calculated with the biweight estimators of location and scale (Beers et al. 1990) following the procedure employed by Bösch et al. (2013) in their previous calculations for A901/2. These calculations warrant repeating because there are now significantly more galaxy redshifts (856) than the 200 VIMOS redshifts used in Bösch et al. (2013). Galaxies are initially assumed to be members of the nearest subcluster in terms of projected distance. Subsequent iterations use clipping to filter outliers until convergence where all remaining galaxies fall into the velocity-dispersion interval of their subcluster.
At this point it is important to consider how the relatively large uncertainties of the OMEGA and prism redshifts ( or km s-1) may affect the velocity dispersion determination and our subsequent analysis. Reassuringly, the values we obtain agree very well with the ones published by Bösch et al. (2013): three out of the four values agree within error, and the fourth is away. Moreover, we detect no bias between our measurements and theirs. For additional peace of mind, we have also calculated using the more accurate 2dF and VIMOS redshifts only. We find that the subcluster redshifts change by less than in all cases, and changes by less than 10% in 3 out of 4 cases (the exception is the SW group, where the uncertainty in the 2dF/VIMOS value is very large due to small number statistics, and the different values agree well within the errors). We are therefore satisfied that using the complete set of redshifts does not bias the measured redshifts or velocity dispersions. Because the formal errors are smaller when using the larger galaxy sample, we have carried our analysis using the and values we calculated. However, our conclusions would not change had we used the compatible values estimated by Bösch et al. (2013).
Table 1 lists the resulting subcluster redshifts and velocity dispersions along with the adopted centres and dark halo parameters (, ) from Heymans et al. (2008). Note that the derived physical parameters of the clusters (cluster centres, , ) were not determined from the velocity dispersion measurements but from the lensing work of Heymans et al. (2008). Velocity dispersions are affected by the dynamical state of the structures, and determining subcluster masses and radii from is very uncertain and potentially biased for non-virialised clusters and/or in the presence of substructure.
| Subcluster | RA (Degrees) | DEC (Degrees) | (km/s) | (Mpc) | (1014 ) | |
|---|---|---|---|---|---|---|
| A901a | 149.1099 | 9.9561 | 0.1631 | 878 | 0.84 | 1.3 |
| A901b | 148.9889 | 9.9841 | 0.1641 | 937 | 0.83 | 1.3 |
| A902 | 149.1424 | 10.1666 | 0.1656 | 808 | 0.56 | 0.4 |
| SW Group | 148.9101 | 10.1719 | 0.1693 | 585 | 0.63 | 0.6 |
| Table notes: | ||||||
| The cluster redshifts and velocity dispersions (, ) are determined in Section 3. | ||||||
| The cluster centres and dark halo parameters (, ) come from Heymans et al. (2008), and are not | ||||||
| based on the values of the subclusters velocity dispersions (see text for details). | ||||||
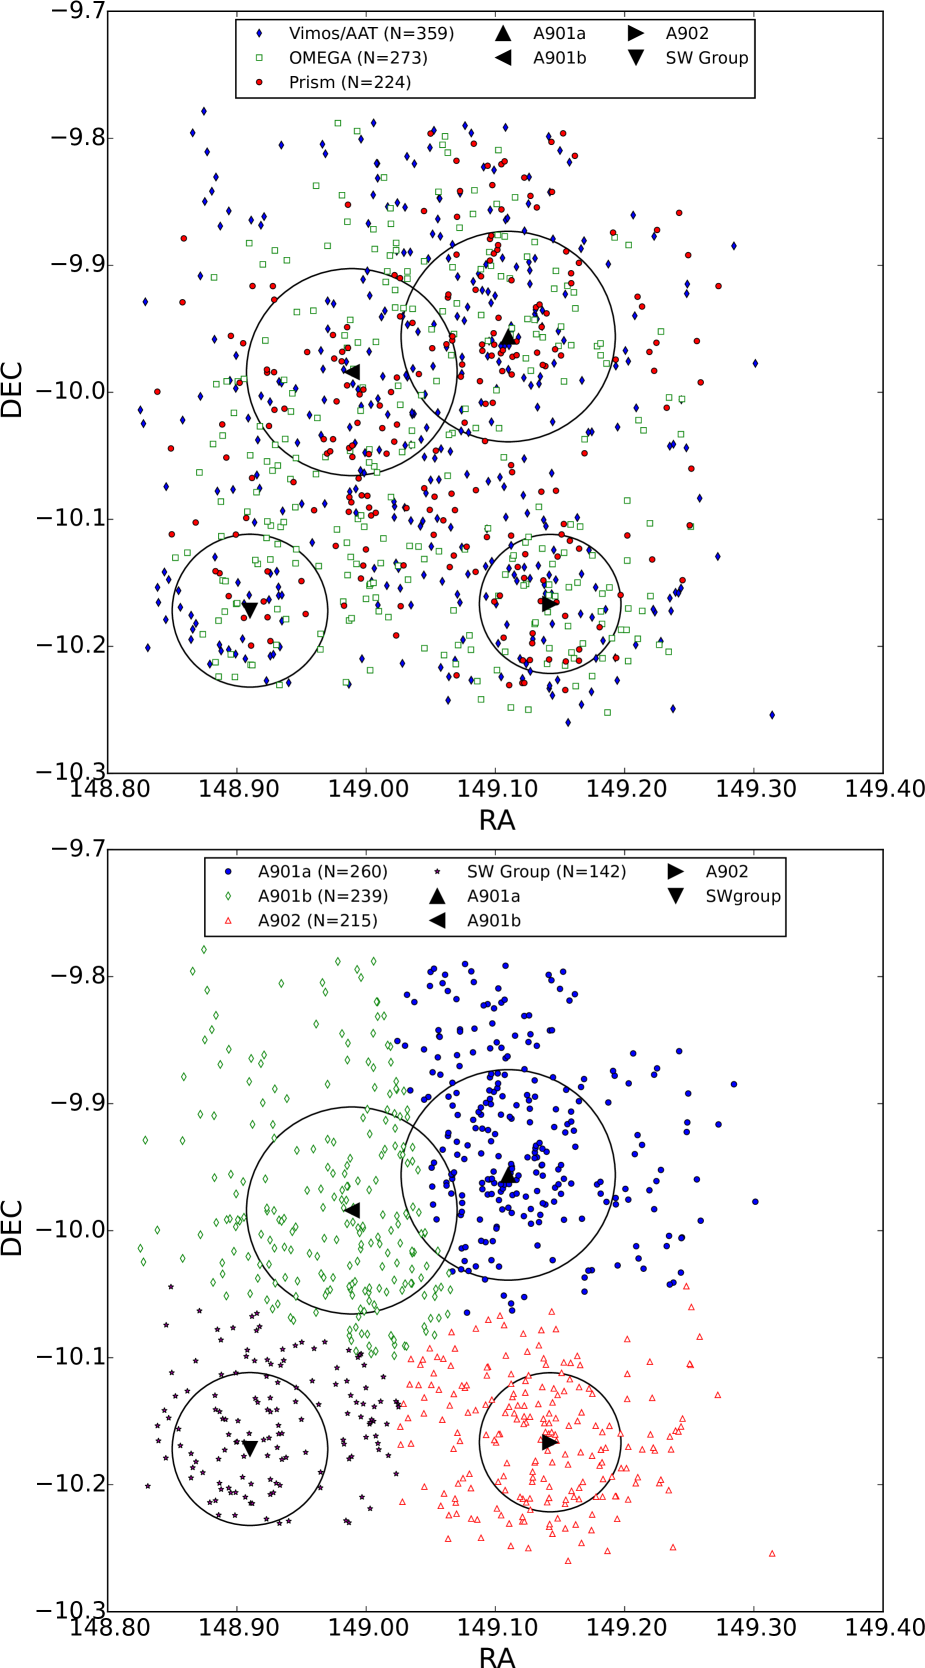
Figure 5 shows the spatial distribution of sample S2 in relation to the subcluster centres. In the top panel, galaxies are coded by the adopted redshift source. In the bottom panel, galaxies are coded by the nearest cluster centre. Phase space parameters (, ) are calculated relative to the halo parameters of the nearest cluster, a strategy that maximises the number of galaxies in the central virialised region. Potential concerns with this strategy are the effects of overlapping , cluster centring errors, and contamination between clusters. The overlap for A901a and A901b, causing 20 galaxies to fall inside both radii. Our cluster membership scheme equally divides the overlapping galaxies between A901a and A901b. The close proximity of A901a and A901b should not seriously bias the phase space analysis because their halo parameters are similar; their agree to within 0.01 Mpc, and their differ only by 10% (Table 1).
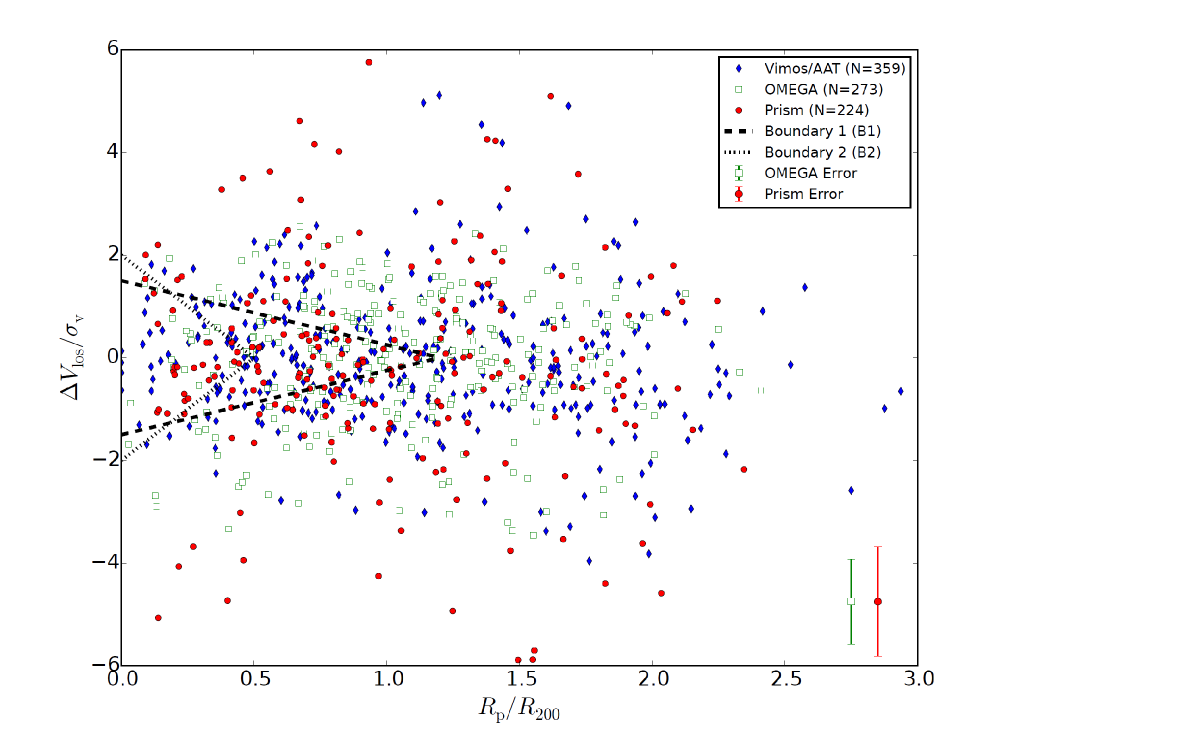
We use the PPS to distinguish cluster galaxies in the virialised region from infalling galaxies with the aim of constraining which environmental processes are relevant in A901/2. Following Mahajan, Mamon & Raychaudhury (2011) and Jaffé et al. (2015), we use triangular regions to represent the inner virialised region. Our fiducial boundary (B1), and , is used by Jaffé et al. (2015) in the study of a cluster that is comparable in mass ( ) to A901a and at a comparable redshift (). The second boundary (B2), and , extends to higher . While B2 is set somewhat arbitrarily, it defines a virialised region 45% smaller in area than B1; its purpose is to provide an estimate of how sensitive the phase-space analysis is on the definition of the virialised region.
Figure 6 is a PPS diagram with these boundaries overlaid, stacking together the four subclusters in A901/2. B1 and B2 are represented with dashed and dotted lines, respectively. Galaxies are again coded by adopted redshift source. B1 encloses 210 galaxies while B2 encloses 70 galaxies.
An important caveat to keep in mind is the potential effect of spatial incompleteness on the stacked PPS diagram. Sources of spatial incompleteness include, for example, the finite OMEGA footprint and 2dF fibre collisions in crowded virialised regions. While Figure 5 shows all clusters are well populated within , spatial incompleteness is evident beyond , particularly for A902 and the SW Group. Given the narrow redshift range covered by the system, possible incompleteness in the redshift sampling are not expected to be a significant concern.
Visual inspection of Figure 6 reveals that the PPS diagram of the A901/902 system does not show the clear “trumpet shape” expected for spherically collapsing systems (e.g., Regos & Geller 1989; Diaferio & Geller 1997). This could be due (at least in part) to the relatively large redshift uncertainties affecting a significant fraction of the galaxy sample, but it could also be the consequence of the complex nature and dynamical state of the whole system and each individual subsystem. If each individual subcluster could be considered as not disturbed, we should be able to see a “trumpet shape” when stacking the four distributions, provided we are able to cleanly separate members of each structure (which is clearly not the case due to complex spatial and redshift projection effects). Because it is highly likely that the four subclusters are interacting and possibly merging with each other, it is hard to believe that they are individually unperturbed. Redshift uncertainties would, no doubt, contribute to blurring any putative underlying “trumpet shape”, but we think the complexity of the system, which compounds dynamical and projection effects, is the dominant reason why we do not see such a shape. The distribution on this diagram of the galaxies with 2dF/VIMOS spectroscopy (for which the redshift uncertainties are much smaller) is not significantly different from that of the galaxies with prism or OMEGA redshifts. This suggests that even if we had perfect redshifts for the whole sample, a clear “trumpet shape” would not arise.
4 Environmental Effects Across Projected Phase Space
4.1 Imaging Properties
For sample S2, we look for differences in imaging-derived galaxy properties (stellar mass, rest-frame colour, structure, Hubble type, and SED type) between the virialised and non-virialised regions of the PPS. The stellar masses, colours, and SED types were derived from the COMBO-17 photometry, and Hubble types were derived from the images (Section 2). The structural parameters include galaxy-wide Sérsic (1963) indices and half-light radii measured from the images by Gray et al. (2009). Sérsic index is interesting because it broadly distinguishes dynamically cold, disky stellar structures from dynamically hot ones (Andredakis, Peletier, & Balcells 1995, de Jong 1996, Khosroshahi, Wadadekar, & Kembhavi 2000, and more recently e.g., Weinzirl et al. 2011, 2014).
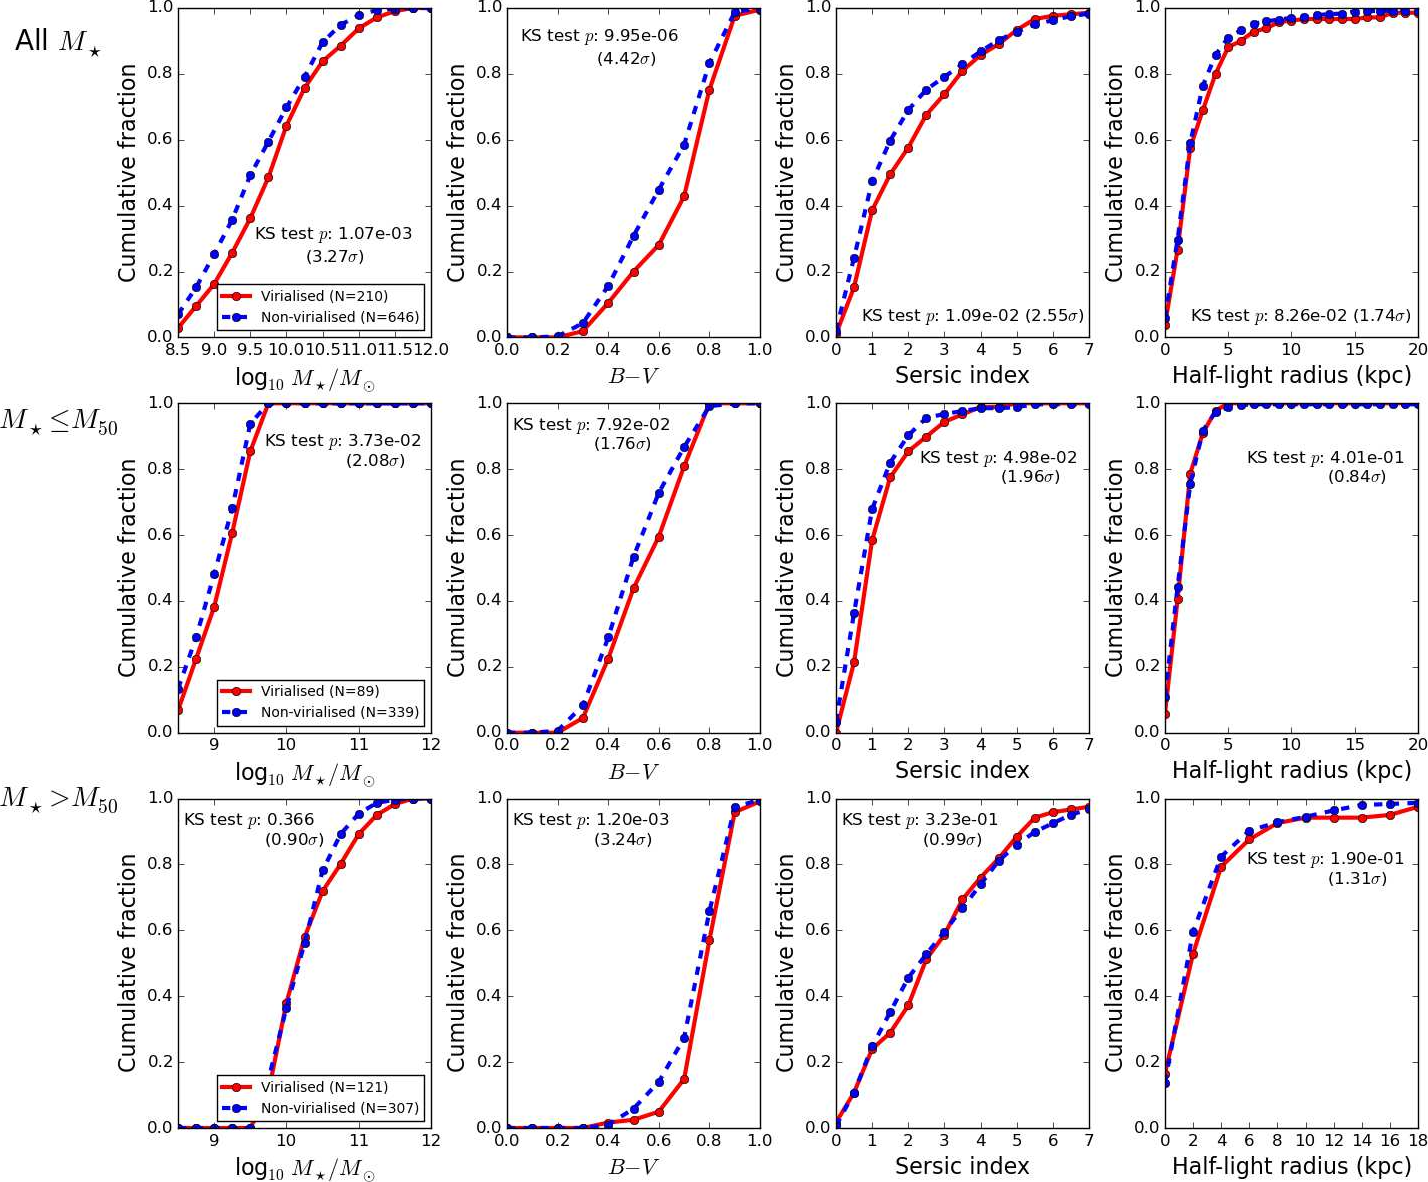
The top row of Figure 7 shows the cumulative distributions of stellar mass, rest-frame colour, Sérsic index, and half-light radius inside and outside the virialised regions, as defined by our fiducial boundary B1 (Section 3, Figure 6). Kolmogorov-Smirnov (KS) tests are used to compare the statistical significance of apparent disparities across phase-space. For stellar mass, there is a 3.3 difference () such that the galaxies in the virialised region are more massive. There is a significantly stronger (4.4, ) disparity in colour implying these central galaxies are redder overall. Sérsic index and half-light radius show less significant differences. At the 2.6-level, virialised-region galaxies tend to have higher Sérsic indices (i.e., they are less disky) than galaxies outside the virialised region. Virialised-region galaxies may also be slightly larger in half-light radius (1.7).
Galaxy colour (e.g., Bell et al. 2004), galaxy size (e.g., Lange et al. 2015), and Sérsic index (e.g., Graham & Guzmán 2003, Kormendy et al. 2009) all scale with galaxy luminosity (i.e., stellar mass). Since galaxies in the virialised region are more massive (the median stellar mass is in the virialised region versus in the non-virialised region), it is important to consider if it is mass, rather than environmental effects, driving the differences in the other three properties.
The middle and bottom rows of Figure 7 repeat the KS tests of the virialised and non-virialised regions for the sample after subdivision into bins above and below the 50th percentile in stellar mass ( ) within sample S2. For the lower-mass bin (), and Sérsic index show differences across the PPS at marginal significance that can probably be accounted for by stellar mass. For the higher-mass bin (), there is no evidence for changes in stellar mass, Sérsic index, or half-light radius. This distributions of , however, differ very significantly ().
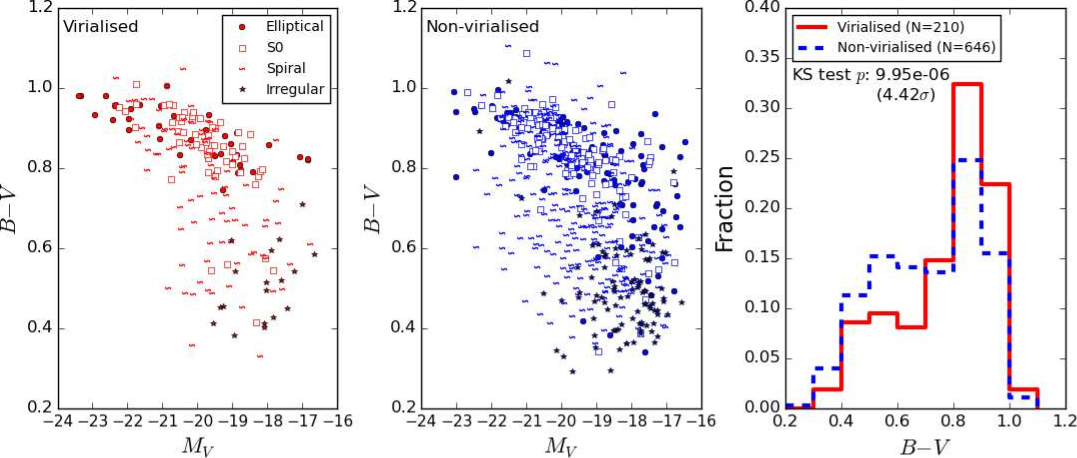
The change in but not stellar mass in the row of Figure 7 suggests the 4.4 result in the top row for is not driven entirely by mass. Figure 8 shows the colour magnitude diagrams and distributions of colour in the two phase-space bins. The colour-magnitude diagrams (left and middle panels) show proportionately fewer galaxies with at fixed in the virialised region (left) compared to the non-virialised region (middle). Across all luminosities, the non-virialised region contains a factor of 1.6 more galaxies with than the virialised region. Noteworthy in the non-virialised region is a population of spirals with (i.e., ) that is absent in the virialised region. Thus, the strong colour difference in Figure 7 arises from a deficit of blue (), high-mass ( ) galaxies (mostly spirals) in the virialised region.
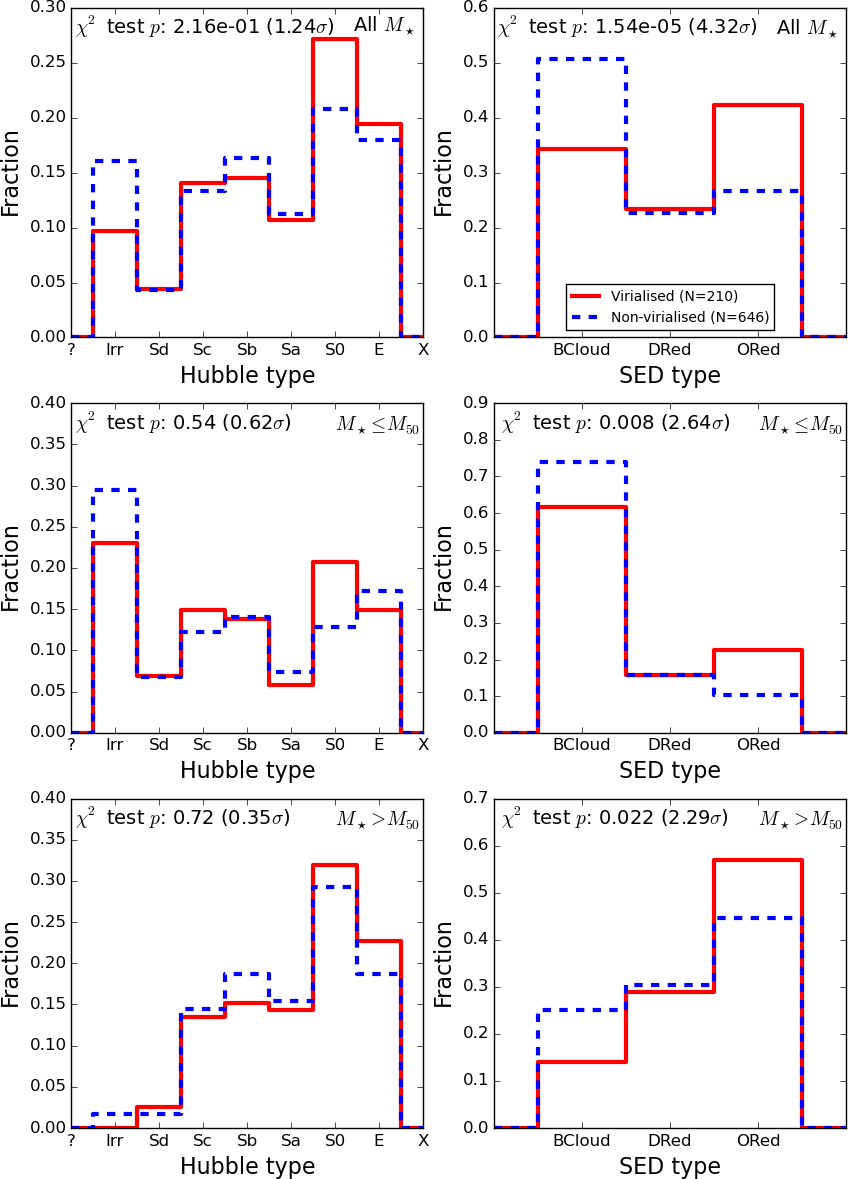
A similar analysis is conducted to assess the influence of stellar mass on morphology and SED type. The left column of Figure 9 shows the histograms of Hubble type in three different stellar mass bins (all masses, , ). Visual inspection of the histogram for all masses shows irregular galaxies are less common in the virialised region and that S0s are more common. A test (rather than KS, since these are discrete quantities) for Hubble types E to Irr, however, gives a -value of 0.216 (1.2), indicating these differences are not statistically meaningful. The middle and bottom panels show Hubble type has even less variation across the PPS once isolated into low and high mass bins.
The right column of Figure 9 addresses SED type. Across all stellar masses, there is a 4.3 difference between “Blue Cloud” and “Old Red” SED types, such that there are () more (fewer) “Blue Cloud” (“Old Red”) galaxies in the non-virialised region. This result is stronger than the result for stellar mass (3.3) and comparable to the one for rest-frame (4.4) in Figure 7. In the mass bin, this difference drops to 2.6 but is still more significant than the change in stellar mass across the PPS in the low-mass bin (2.1). In the mass bin, the difference for SED type is 2.3, much higher than the 0.90 found for stellar mass. Thus, SED type evolves across the PPS similarly to rest-frame .
The KS and tests presented in this section have focused on the fiducial boundary B1. The test statistics are summarised in columns of Table 2. Similar and qualitatively consistent results are found for alternate boundary B2, which defines a more conservative virialised region (Section 3). Column 6 lists the test statistics when applying instead boundary B2 without binning by stellar mass.
| Property | Method | PPS, B1a | PPS, B1a () | PPS, B1a () | PPS, B2b |
|---|---|---|---|---|---|
| (1) | (2) | (3) | (4) | (5) | (6) |
| Stellar mass | KS test | 1.07 (3.27) | 3.73 (2.08) | 3.66 (0.90) | 1.17 (2.52) |
| Colour () | KS test | 9.95 (4.42) | 7.92 (1.76) | 1.20 (3.24) | 9.33 (4.91) |
| Sérsic index | KS test | 1.09 (2.55) | 4.98 (1.96) | 3.23 (0.99) | 4.71 (2.83) |
| Half-light radius | KS test | 8.26 (1.74) | 4.01 (0.84) | 1.90 (1.31) | 3.71 (0.89) |
| Hubble type | test | 2.16 (1.24) | 5.38 (0.62) | 7.25 (0.35) | 3.14 (2.15) |
| SED type | test | 1.54 (4.32) | 8.34 (2.64) | 2.20 (2.29) | 1.39 (5.67) |
-
•
Table notes:
is the 50th-percentile in stellar mass. -
•
aTests the change in galaxy property inside and outside the virialised region in phase-space defined by boundary B1, / and /.
-
•
bTests the change in galaxy property inside and outside a smaller virialised region in phase-space defined by boundary B2, / and /.
4.2 Emission-Line Derived Properties
In this section, we explore how emission-line properties derived from the OMEGA spectra (gas-phase metallicity, star formation, and AGN emission) vary across the PPS.
4.2.1 Star-Formation and AGN Activity
Cid Fernandes et al. (2010, 2011) demonstrate the utility of using the WHAN diagram ([Nii]/H versus ) to discriminate star formation and black hole activity as sources of gas ionisation. Figure 10 shows the WHAN diagram, assuming the standard boundaries from Cid Fernandes et al. (2010), for the subset of 329 OMEGA galaxies in sample S2 whose PSF-aperture spectra have both the H and [Nii] within the wavelengths probed. There are 198/329 () galaxies on the “Star forming” side of the diagram, 93/329 () in the “Seyfert” area, and 38/329 () in the “LINER” area.
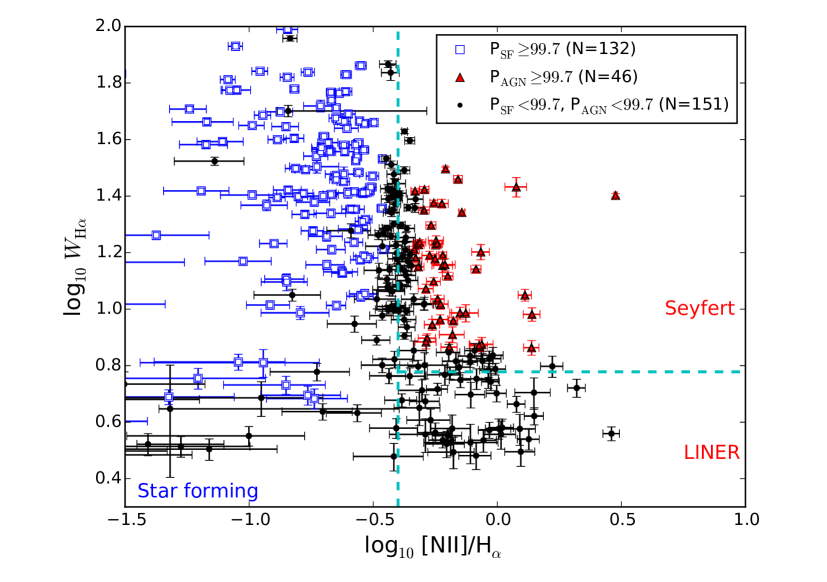
The significance of the “Star forming” versus “AGN” classifications in the WHAN diagram can be quantified using the probability distributions for [Nii]/H and arising from our Bayesian spectral fitting (Section 2.3). The probability that a galaxy is dominated by star formation or AGN emission is calculated based on its position relative to the boundaries in Figure 10. Galaxies with () probability of being in the star-forming or AGN categories are distinguished in Figure 10. There are 132 bona-fide such star-forming galaxies and 46 such AGN-dominated galaxies.
Table 3 lists the number counts of star-forming and AGN galaxies in different regions of the PPS, as well as in the two stellar mass bins and . The majority of star-forming (105/132 for B1 and 125/132 for B2) and AGN galaxies (29/46 for B1 and 39/46 for B2) are outside the virialised region. Most star-forming galaxies (108/132) are in the low mass bin, while the majority (31/46) of AGN are in the high mass bin.
A test for the numbers of star-forming and AGN galaxies across the PPS using the B1 boundary gives a -value of 0.025 (). The same test for B2 gives a similar -value, 0.031 (2.2). The test across mass bins gives a highly significant -value of 5.0 (6.2). Change in the numbers of star-forming and AGN galaxies across phase-space is quite weak compared to the change in number counts due to stellar mass.
| Condition | Star forming | AGN |
| Virialised region (B1a) | 27 | 17 |
| Non-virialised region (B1 | 105 | 29 |
| Virialised region (B2b) | 7 | 7 |
| Non-virialised region (B2b) | 125 | 39 |
| 108 | 15 | |
| 24 | 31 |
-
•
Table notes:
-
•
aThe virialised region in phase-space is defined by boundary B1, / and /.
-
•
b The virialised region in phase-space defined by boundary B2, / and /.
-
•
c is the 50th-percentile in stellar mass.
4.2.2 Metallicity in Star-Forming Galaxies
The [Nii]/H ratio has been shown (e.g., Denicoló, Terlevich, & Terlevich 2002; Pettini & Pagel 2004) to be a robust calibrator of gas-phase metallicity [] for star-forming galaxies. The relation of [Nii]/H to metallicity is monotonic, and the [Nii] and H lines can be measured in our moderate-resolution OMEGA spectra. The downside of [Nii]/H is that its sensitivity to ionisation variations (e.g., Nagao, Maiolino, & Marconi 2006) means it is only suitable for measuring integrated galaxy abundances. Here, we consider the galaxy-wide [Nii]/H metallicities of the star-forming galaxies identified from PSF-aperture OMEGA spectra in Section 4.2.1 and Figure 10 (details of the photometry are in Rodríguez del Pino et al. 2017).
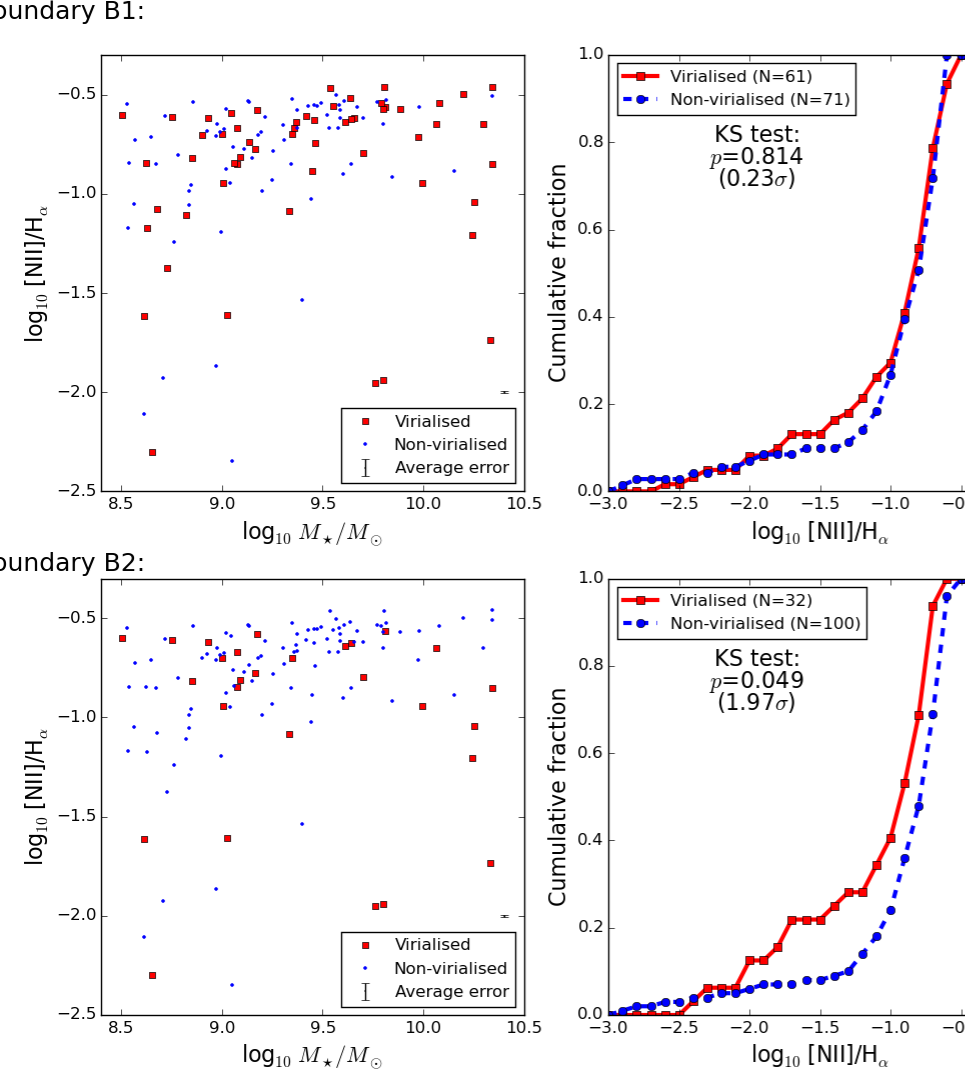
The top left panel of Figure 11 shows the [Nii]/H ratio versus stellar mass, colour-coded by position in the PPS, with respect to boundary B1. There is a weak trend in [Nii]/H across stellar mass present for both PPS bins. Moreover, the full range of line ratio is present in the virialised and non-virialised regions. The top right panel of Figure 11 compares the cumulative distributions for the two PPS bins. A KS test gives a -value 0.81 (0.23). There is no evidence that the distribution of [Nii]/H differs between the two regions.
The bottom row of Figure 11 repeats the same analysis for the more central PPS boundary B2. The results appear to be more significant for B2 (, ), and the cumulative line ratio distributions suggest there are more galaxies with low metallicities () in the virialised region. However, the significance of the KS test is still only marginal with just 32 bona-fide star-forming galaxies in the more conservative virialised region. We conclude that in our dataset we do not detect any significant difference in metallicity as traced by [Nii]/H across the PPS.
4.2.3 H Specific Star Formation Rate Deficit
Using H star-formation rates () derived from the large-aperture OMEGA spectra of galaxies in sample S2 (Section 2.4), we look for a change in the way specific (or ) scales with stellar mass in the intra-cluster environment. As in Rodríguez del Pino et al. (2017), we convert H luminosity to star-formation rate using the Kennicutt (1998) relation with an additional mass-dependent dust attenuation correction estimated from Figure 6 of Brinchmann et al. (2004). The conversion is
| (2) |
where is the dust attenuation term.
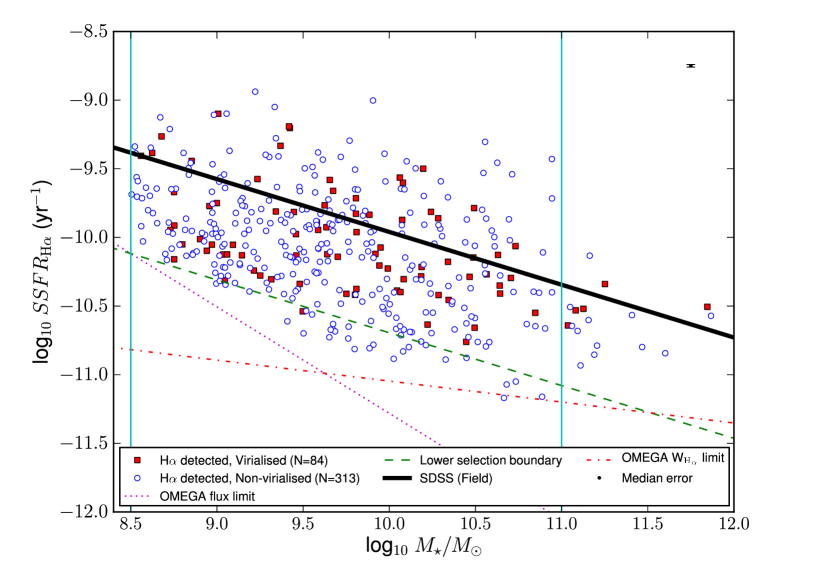
We define deficit as the offset relative to the – relation for field galaxies in SDSS (Abazajian et al. 2009); at a given mass, a galaxy with a lower than the SDSS relation has a positive deficit. Figure 12 shows the – relation for the field (black line) and for our sample (points) of 397 galaxies from S2 with large-aperture OMEGA spectra.
To compare the star-formation deficit of the galaxies in different PPS regions we require an unbiased sample that is not affected by H flux and equivalent-with selection effects. Following the detailed analysis of Rodríguez del Pino et al. (2017), for this comparison we use sample S3, which comprises the 351 OMEGA galaxies lying above the dashed line shown in Figure 12. This line is parallel to the – relation in the field and defines a region where the H-detected galaxies are above the flux and equivalent-width detection limits of the survey (see Figure 12 and its caption for more details). While we are only concerned here with the relative offset from the field line shown in Figure 12 for galaxies in different regions of the PPS, it is clear that there is an overall reduction in for the complete OMEGA sample relative to the field. This is a result discussed in detail by Rodríguez del Pino et al. (2017) for a similar sample drawn from the OMEGA survey.
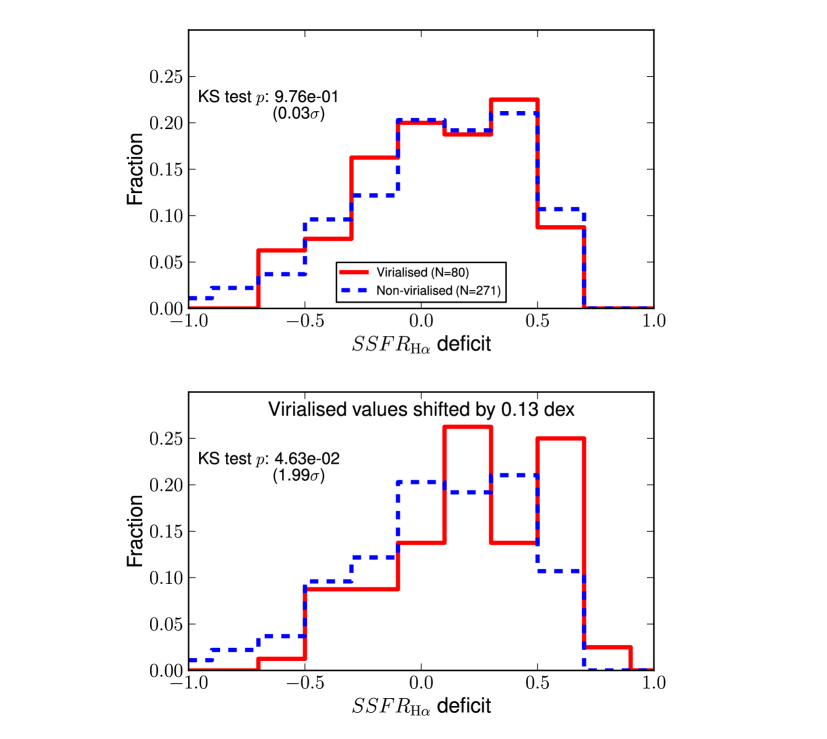
The top panel of Figure 13 shows histograms of the deficit in the virialised and non-virialised regions as defined by boundary B1. A KS test shows no probable difference (, ) between these distributions. In order to estimate the upper limit on the difference in average between the two regions that our data are able to rule out, we repeat the KS test for a range of relative offsets. The bottom panel of Figure 13 indicates a difference would be detectable at the () level if the deficits in the virialised region were increased by dex or more. Using boundary B2 instead shows that an even larger shift (0.18 dex or more) is required for a result. Thus, we rule out changes in deficit across PPS diagram regions larger than 40%–50%.
5 Discussion
5.1 Disentangling the Effects of Stellar Mass and Environment
Table 2 summarises the significance of changes in the imaging-derived properties across PPS and stellar mass. An important point to note is that the galaxy properties considered here (, Sérsic index, half-light radius, Hubble type, and SED type) have trends with stellar mass that are much more significant () than their trends across virialised and non-virialised PPS bins (Columns 3 through 6). The effect of mass on these galaxy properties is far stronger than the environmental effects revealed by the PPS.
Columns 4 and 5 of Table 2 summarise the results of repeating the PPS analysis (Figures 7 and 9) for boundary B1 after binning by stellar mass. The significance of the -values is reduced, in part because of the reduced sample sizes. However, as noted in Section 4.1, the variations of colour and SED type across the PPS at are more significant ( and ) than the change in stellar mass (). The changes in colour and SED in the higher mass bin cannot be explained by stellar mass alone and must be a result of environment. To test to what extent mass differences within each bin could affect this conclusion, we have repeated the analysis using narrower mass bins (4 bins instead of 2, which is as far as we can go given the sample size). We are still able to detect environmentally driven colour changes at the – level in 3 out of the 4 bins, and the results are inconclusive in the other one. This new test supports the conclusions that environmentally driven colour changes are present at fix stellar mass.
Column 6 further shows the comparison using the alternate, more conservative PPS boundary B2. The -values for boundary B2 are qualitatively similar to those for boundary B1, with the significance for changes in colour, Sérsic index, and especially SED type being higher in Column 6 due to the more conservative virialised region boundary. The disparity in colour (SED type) across all masses is () more significant than the change in stellar mass. Conducting the PPS analysis with boundary B2 after binning by stellar mass likewise yields results consistent with Columns 4 and 5. That the same qualitative results are seen with the alternative PPS boundary indicates the phase-space analysis is robust to the choice of the virialised region boundary.
Table 2 shows that Sérsic index has a somewhat more significant, although still somewhat marginal, change across PPS than Hubble type. This may seem puzzling at first sight since Sérsic index usually correlates with Hubble type, albeit with large scatter. We must not forget that the visually-determined Hubble type reflects multiple criteria, including bulge-to-disk ratio and the presence and tightness/smoothness of the spiral arms, while Sérsic index reflects only the relative dominance of the bulge or the disk component in a galaxy (e.g., Kormendy & Bender 2012). Since Sérsic index and morphology are not the same, finding differences in environmental behaviour should not be surprising. Furthermore, considering that the significance of the environmental differences detected in the Sérsic index distribution is small (always ), and given the indirect connection between Sérsic index and visual morphology, this apparent discrepancy is not that surprising.
Thus, we find in A901/902 that colour appears to be changing independently of morphology and structure, with the “Dusty Red” spirals being the prime examples of this effect in A901/902. This result is in agreement with previous studies concluding that the environment can drive changes in colour without changing morphology (e.g., Bamford et al. 2009; Skibba et al. 2009; Masters et al. 2010).
5.2 Properties of Star-Forming Galaxies
We find multiple indications that the star-formation properties of star-forming galaxies do not differ significantly across the PPS in A901/2. First, the proportion of star-forming galaxies (Section 4.2.1, Table 3) changes only at the level across the PPS, less significant than the change with stellar mass (). Likewise, there is little evidence () for changes in the [Nii]/H metallicity (Section 4.2.2) and deficit (Section 4.2.3).
Wolf, Gray & Meinenheimer (2005) and Wolf et al. (2009) find “Dusty Red” galaxies in A901/2 make up a significant fraction of the star-forming galaxies. These “Dusty Red” galaxies constitute over half of star-forming galaxies at stellar masses in the range – , and they form stars times slower at fixed mass than blue galaxies in A901/2. The fact that many star-forming galaxies are red explains why rest-frame colours and SED types vary more strongly (Table 2) across the PPS than star formation properties.
Wolf et al. (2009) report an overall reduction in of star-forming galaxies relative to the field, and a subtle change in across local density. Rodríguez del Pino et al. (2017) report at fixed mass a reduction in of star-forming galaxies relative to the field. We see this offset too (Figure 12), but we do not see a difference in deficit within bins of the PPS (Figure 13). A reduction in relative to the field, but not across broad bins of the PPS, suggests the cluster galaxies are all being preprocessed (e.g., Zabludoff & Mulchaey 1998, Moran et al. 2007, Kautsch et al. 2008, Dressler et al. 2013, Haines et al. 2013, Lopes et al. 2014, Cybulski et al. 2014) in a similar manner during infall, and much of the reduction in star-formation activity has already happened by the time the galaxies enter the broad cluster environment sampled by the OMEGA survey.
We find in Table 3 and Section 4.2.1 that the vast majority of star-forming galaxies are outside the virialised region (i.e., at large projected radius). The paucity of star-forming galaxies in the dense virialised region is consistent with studies of other galaxy clusters. Many authors have reported a star-formation-density relation at in which the fraction of star-forming galaxies declines from the cluster outskirts () to the cluster core (Kodama et al. 2004, Finn et al. 2005, Rines et al. 2005, Koyama et al. 2010, Muzzin et al. 2012, Webb et al. 2013, Wegner et al. 2015). For example, Kodama et al. (2004) find that the fraction of galaxies detected in H strongly decreases with local density at . Finn et al. (2005) find no radial trend in star-formation rates within three clusters at . They do find, however, that the fraction of star-forming galaxies increases (decreases) with projected distance (local density) in 2/3 clusters, which is consistent with our study.
Our results here showing rather small intra-cluster differences in star formation may, at first, seem to be in conflict with our demonstration in Figures 7 and 8 of intra-cluster changes in galaxy colour. This is not a contradiction because these two results were obtained with different samples. The analysis on galaxy colour and other imaging properties involves all 856 galaxies in S2, whereas the analysis of H-based star formation properties was conducted with the significantly reduced subset of 351 emission-line (primarily star-forming) galaxies in S3 (Figure 12). In other words, the environmental changes we have found in the colour distributions refer to the overall galaxy population, while any putative changes in star-formation properties are only relevant to star-forming galaxies.
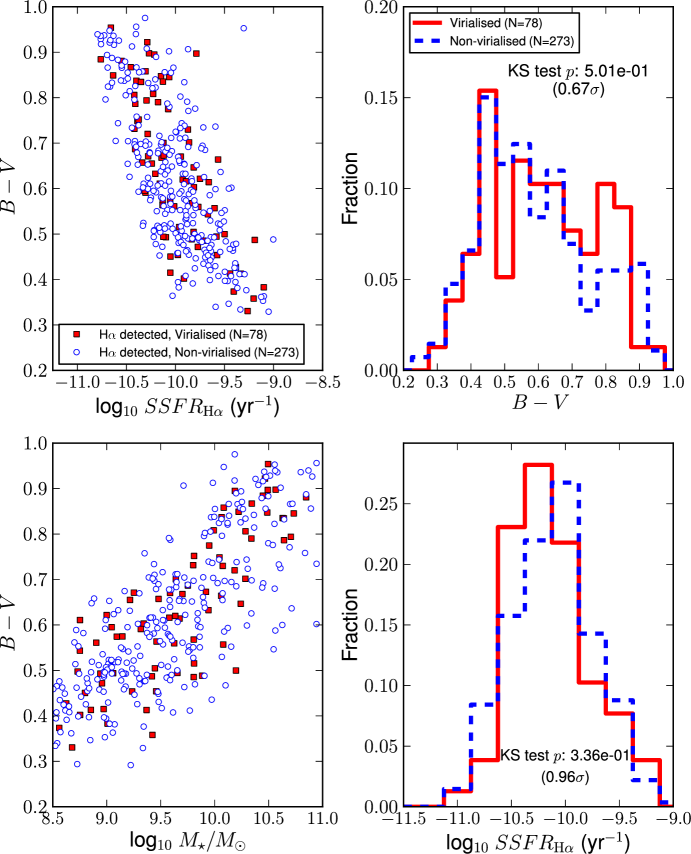
This is made explicit in Figure 14, where we compare , , and stellar mass for the smaller S3 sample of H-selected galaxies. The left column shows colour is very similar at both fixed and mass. The right column shows the histograms of colour and are not significantly different for the virialised and non-virialised H-emitting galaxies.
5.3 Properties of Visually Classified Elliptical Galaxies
It is well known that elliptical and early type galaxies are relatively more abundant in dense environments than spiral galaxies (e.g., Dressler 1980; Postman & Geller 1984; Norberg et al. 2002; Goto et al. 2003; Blanton et al. 2005; Postman et al. 2005; Wolf et al. 2007; Ball, Loveday & Brunner 2008). Figure 7 and Table 2, though, show no variation in Hubble type across the PPS within A901/2. Furthermore, at fixed Hubble type (E, S0, Spirals, Irr), we have checked for differences in galaxy stellar mass, rest-frame colour, and Sérsic index across the PPS. Visually classified elliptical galaxies are the only population showing marginally significant () changes in colour and stellar mass. No Hubble type shows a substantial change in Sérsic index across the PPS.
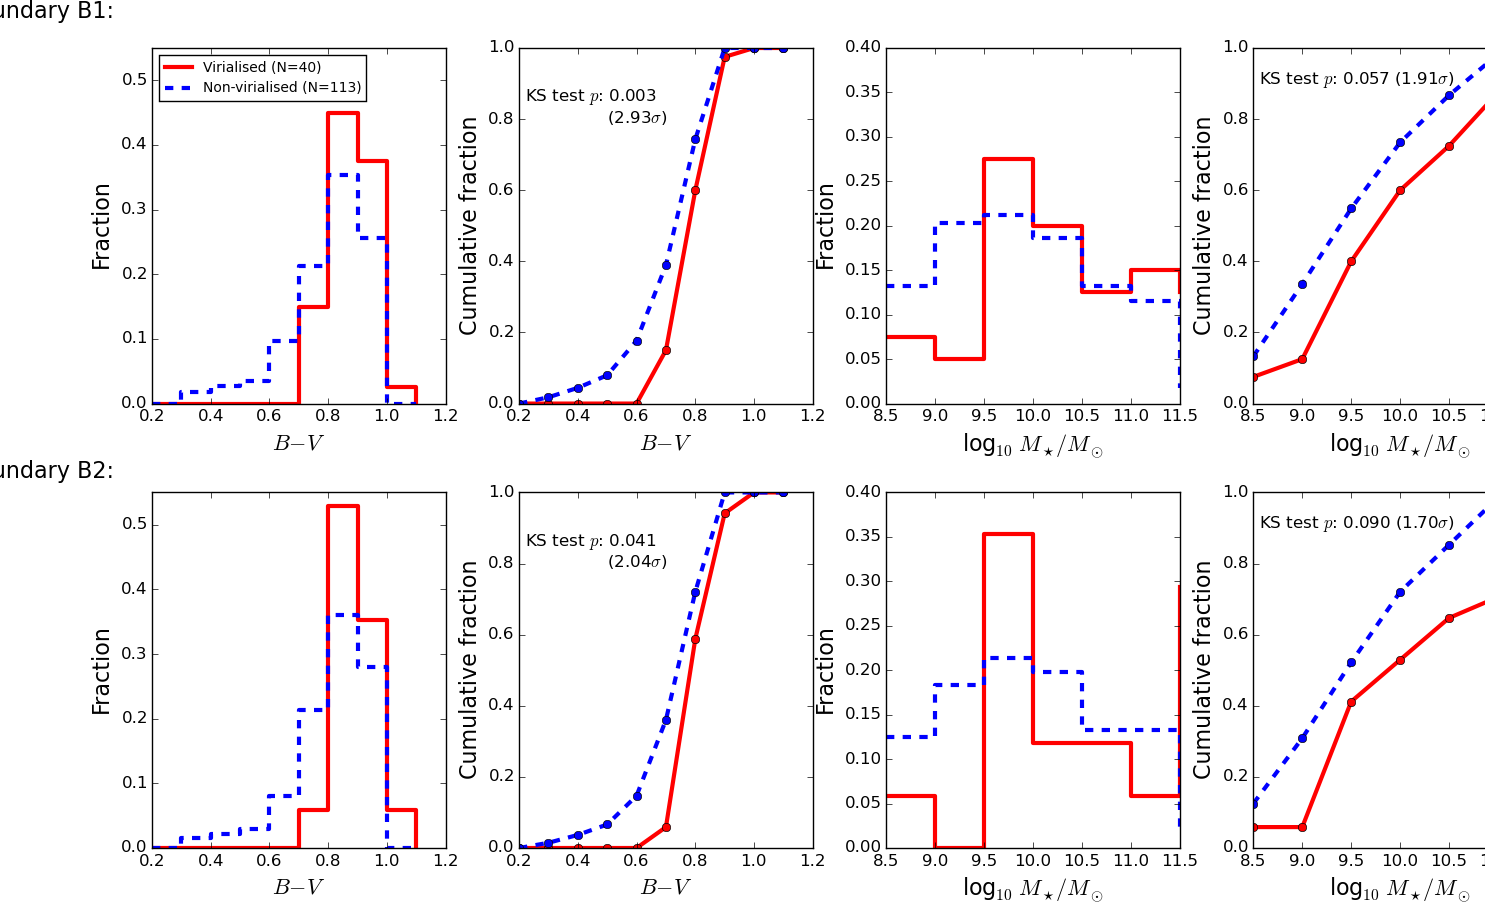
Figure 15 shows the distributions of colour and stellar mass for the elliptical galaxies. The colour distributions of ellipticals are different between the PPS bins at the level. This is true for either definition of the virialised region, although the difference is more significant for boundary B1 than B2 ( versus ). The offset is driven by a population of infalling elliptical galaxies with that is absent in the virialised region. The difference in stellar mass due to the PPS, by comparison, is weaker ( for B1 and for B2), indicating the change in colour cannot be explained only by the difference in stellar mass.
A possible caveat with the Hubble types used in this study is that some galaxies called “elliptical” may not be true elliptical galaxies. Studies in the Virgo cluster show that most true elliptical galaxies are brighter than (e.g., Kormendy et al. 2009). In our Figure 8, however, most of the ellipticals with are fainter than . Based on visual inspection, we are confident these objects are not dwarf irregulars. Many of them could instead be spheroidal galaxies, defunct late-types transformed by environment (e.g., Kormendy et al. 2009, Kormendy & Bender 2012). The median Sérsic index () of the blue (), visually classified ellipticals is compatible with this idea. The redder () ellipticals, in comparison, have higher median Sérsic index ().
5.4 Differences Between the A901/2 Subclusters
It is interesting to consider how galaxy properties differ across the PPS within the four A901/2 subclusters (Table 1). Table 4 summarises the effect of the PPS on galaxy properties for each subcluster. Comparing Table 1 and Table 4 shows no correlation between subcluster halo properties and the contrast of galaxy properties across phase-space. It is possible that spatial incompleteness (Figure 5), especially for A902 and the SW Group, is a limiting factor in the comparison of individual subclusters.
For the PPS boundary B1, colour and SED type are the only properties consistently varying more strongly than stellar mass across the PPS in Table 4. Stellar mass changes by only for the two more massive subclusters A901a and A901b. These two subclusters are apparently driving the stronger change found for stellar mass in Figure 7 and Table 2. The individual subclusters show changes in colour at the level. Except for the SW Group, the subclusters all show environmental changes in SED type at the level.
A similar contrast in galaxy properties across phase-space is found for the more conservative PPS boundary B2. This again highlights the robustness of our conclusions to the particular choice of boundary for the virialised region. Colour changes in all subclusters more strongly than stellar mass. This is true for SED type in only 3/4 subclusters, with A902 being the exception.
| Cluster | Stellar Mass | Colour () | Sérsic index | Half-light radius | Hubble type | SED type |
|---|---|---|---|---|---|---|
| Boundary B1a | ||||||
| A901a | 3.28 (2.13) | 1.59 (2.41) | 1.98 (2.33) | 1.09 (1.60) | 1.13 (1.58) | 2.65 (2.22) |
| A901b | 2.01 (2.32) | 1.37 (3.20) | 7.18 (1.80) | 4.98 (0.68) | 8.18 (2.64) | 4.54 (2.84) |
| A902 | 4.96 (0.68) | 4.16 (2.87) | 7.54 (0.31) | 9.66 (0.04) | 9.58 (0.05) | 6.36 (2.73) |
| SW Group | 2.08 (1.26) | 6.50 (1.85) | 2.59 (1.13) | 1.30 (1.52) | 1.20 (1.56) | 4.10 (0.82) |
| Boundary B2b | ||||||
| A901a | 7.70 (1.77) | 3.12 (2.96) | 2.78 (1.09) | 4.22 (0.80) | 5.25 (0.64) | 2.99 (4.17) |
| A901b | 2.40 (1.18) | 3.00 (2.17) | 4.89 (1.97) | 8.79 (0.15) | 2.92 (1.05) | 9.07 (2.61) |
| A902 | 3.68 (2.09) | 4.16 (2.87) | 2.33 (1.19) | 2.70 (1.10) | 5.36 (0.62) | 7.75 (1.77) |
| SW Group | 5.89 (0.54) | 1.02 (1.63) | 2.45 (2.25) | 5.89 (0.54) | 2.18 (1.23) | 8.94 (1.70) |
-
•
Table notes:
-
•
aTests the change in galaxy property inside and outside the virialised region in phase-space defined by boundary B1, / and /.
-
•
bTests the change in galaxy property inside and outside a smaller virialised region in phase-space defined by boundary B2, / and /.
6 Summary
In this paper, we have conducted a comprehensive, intra-cluster analysis of the A901/2 multi-cluster system at . Aggregating redshifts from traditional spectroscopy, tunable-filter imaging, and prism techniques, we have assembled redshifts for a sample of 856 cluster galaxies that reaches in stellar mass down to . This unique dataset facilitates a more nuanced study of environment that goes beyond common field-versus-cluster comparisons. We have looked for variations in cluster galaxy properties between the virialised and non-virialised regions of projected phase-space, using two different boundaries for the virialised region. Our main results, summarised below, highlight that A901/2 exhibits only relatively gentle environmental effects that act mainly on galaxy gas reservoirs.
-
1.
Stacking the four subclusters (Table 1) in A901/2 together, we find some significant changes across the PPS between the virialised and non-virialised regions for imaging-derived galaxy properties (Table 2, Figure 7, and Figure 9). With our fiducial definition of the virialised region (Boundary B1), stellar mass, rest-frame colour, and SED type all differ between regions with significance such that galaxies in the virialised region are more massive, have redder colours, and have predominantly passive SED types. Additionally, Sérsic indices are larger, implying dynamically hotter stellar structures in the virialised region, at the 2.6 level. Half-light radius and Hubble type variations across the PPS are less significant. Similar results are found with a smaller, more conservative boundary (B2) for the virialised region.
-
2.
Since stellar mass varies across phase-space in conjunction with other galaxy properties, it is important to consider whether the apparent variation of these galaxy properties with phase-space is just a mass effect. Indeed, KS test -value significances for galaxy properties binned in stellar mass are tens of orders of magnitude stronger than the corresponding test statistics for galaxy properties binned just in PPS (Table 2, Column 3).
-
3.
The role of stellar mass is disentangled by conducting the PPS analysis in bins of stellar mass. At , the 50th-percentile in stellar mass, the change in rest-frame colour across the PPS is stronger ( versus ) than the change in stellar mass across the PPS (Figure 7 and Table 2). This is due to a population of relatively blue () galaxies with mostly spiral Hubble types in the higher mass bin that exists in the non-virialised region but not the virialised region. The prominence of the colour disparity relative to the stellar mass change is even apparent in the individual subclusters (Table 4). This suggests the changes seen in rest-frame colour and SED type are driven to some degree by environmental processes.
-
4.
While Hubble type does not change significantly across the PPS, visually classified elliptical galaxies as a group are slightly bluer with significance in the non-virialised region (Figure 15). This is due to an infalling population of lower-mass ( ) ellipticals with that is absent in the virialised region. It is important to note that some of the low-luminosity (), blue () galaxies responsible for this result could be spheroidal galaxies rather than true ellipticals.
-
5.
The proportions of bona-fide star-forming and AGN galaxies change much less in the PPS than with stellar mass. Still, there is a reduction in the frequency of star-forming galaxies in the virialised region (Table 3) that is consistent with the star-formation-density relation observed in other clusters.
-
6.
The [Nii]/H metallicity and deficit differ at significance across the PPS. We do, however, see at fixed mass an overall reduction in relative to the field (Figure 12), a result found in parallel by Rodríguez del Pino et al. (2017). These observations suggest that preprocessing of galaxies during infall plays a prominent role in quenching star formation.
Our study of galaxy properties across projected phase-space in A901/2 provides compelling evidence for the action of environmental processes. Since the strongest observable changes in galaxy properties pertain to colour and SED type, the environmental processes must be gentle and manifest primarily on the gas reservoirs rather than the underlying stellar structures. Similar conclusions have been reached for A901/2 previously by (e.g., Bösch et al. 2013; Maltby et al. 2015) and most recently by Rodríguez del Pino et al. (2017) through a complementary analysis.
Additional progress in disentangling galaxy environment effects is possible with spatially resolved measures of star formation and kinematics from integral field units. This will allow a study in which the spatial distributions and kinematics of young/old stars and ionised gas can be compared consistently for galaxies spanning a wide range of environment, stellar mass, star formation, and morphology. Studies of this nature are already possible with data from the Sydney-AAO Multi-Object Integral Field Spectrograph (SAMI, Croom et al. 2012) and Mapping Nearby Galaxies at Apache Point Observatory (MaNGA, Bundy et al. 2015) galaxy surveys.
Acknowledgements
Based on observations made with the Gran Telescopio Canarias, installed in the Observatorio del Roque de los Muchachos of the Instituto de Astrofísica de Canarias, in the island of La Palma. The GTC reference for this programme is GTC2002-12ESO. Access to GTC was obtained through ESO Large Programme 188.A-2002. Partly based on observations from the European Southern Observatory Very Large Telescope (ESO-VLT), observing run ID 384.A-0813. B.R.P acknowledges financial support from the Spanish Ministry of Economy and Competitiveness through grant ESP2015-68964. C.W. was supported by Australian Research Council Laureate Grant FL0992131.
References
- Abazajian et al. (2009) Abazajian, K. N., Adelman-McCarthy, J. K., Agüeros, M. A., et al. 2009, ApJS, 182, 543-558
- Andredakis et al. (1995) Andredakis, Y. C., Peletier, R. F., & Balcells, M. 1995, MNRAS, 275, 874
- Ball et al. (2008) Ball, N. M., Loveday, J., & Brunner, R. J. 2008, MNRAS, 383, 907
- Bamford et al. (2009) Bamford, S. P., Nichol, R. C., Baldry, I. K., et al. 2009, MNRAS, 393, 1324
- Barnes (1988) Barnes, J. E. 1988, ApJ, 331, 699
- Barnes & Hernquist (1991) Barnes, J. E., & Hernquist, L. E. 1991, ApJL, 370, L65
- Bauer et al. (2011) Bauer, A. E., Grützbauch, R., Jørgensen, I., Varela, J., & Bergmann, M. 2011, MNRAS, 411, 2009
- Beers et al. (1990) Beers, T. C., Flynn, K., & Gebhardt, K. 1990, AJ, 100, 32
- Bell et al. (2004) Bell, E. F., Wolf, C., Meisenheimer, K., et al. 2004, ApJ, 608, 752
- Bell et al. (2007) Bell, E. F., Zheng, X. Z., Papovich, C., et al. 2007, ApJ, 663, 834
- Birnboim & Dekel (2003) Birnboim, Y., & Dekel, A. 2003, MNRAS, 345, 349
- Blanton et al. (2005) Blanton, M. R., Eisenstein, D., Hogg, D. W., Schlegel, D. J., & Brinkmann, J. 2005, ApJ, 629, 143
- Borch et al. (2006) Borch, A., Meisenheimer, K., Bell, E. F., et al. 2006, A&A, 453, 869
- Bösch et al. (2013) Bösch, B., Böhm, A., Wolf, C., et al. 2013, A&A, 549, A142
- Brinchmann et al. (2004) Brinchmann, J., Charlot, S., White, S. D. M., et al. 2004, MNRAS, 351, 1151
- Bundy et al. (2015) Bundy, K., Bershady, M. A., Law, D. R., et al. 2015, ApJ, 798, 7
- Butcher & Oemler (1984) Butcher, H., & Oemler, A., Jr. 1984, ApJ, 285, 426
- Cepa (2013) Cepa, J. 2013, Revista Mexicana de Astronomia y Astrofisica Conference Series, 42, 77
- Chies-Santos et al. (2015) Chies-Santos, A. L., Rodríguez del Pino, B., Aragón-Salamanca, A., et al. 2015, MNRAS, 450, 4458
- Cooper et al. (2007) Cooper, M. C., Newman, J. A., Coil, A. L., et al. 2007, MNRAS, 376, 1445
- Cooper et al. (2008) Cooper, M. C., Newman, J. A., Weiner, B. J., et al. 2008, MNRAS, 383, 1058
- Croom et al. (2012) Croom, S. M., Lawrence, J. S., Bland-Hawthorn, J., et al. 2012, MNRAS, 421, 872
- Cybulski et al. (2014) Cybulski, R., Yun, M. S., Fazio, G. G., & Gutermuth, R. A. 2014, MNRAS, 439, 3564
- de Jong (1996) de Jong, R. S. 1996, A&A Suppl., 118, 557
- Dekel & Birnboim (2006) Dekel, A., & Birnboim, Y. 2006, MNRAS, 368, 2
- Denicoló et al. (2002) Denicoló, G., Terlevich, R., & Terlevich, E. 2002, MNRAS, 330, 69
- Desai et al. (2007) Desai, V., Dalcanton, J. J., Aragón-Salamanca, A., et al. 2007, ApJ, 660, 1151
- Diaferio & Geller (1997) Diaferio, A., & Geller, M. J. 1997, ApJ, 481, 633
- Dressler (1980) Dressler, A. 1980, ApJ, 236, 351
- Dressler et al. (2013) Dressler, A., Oemler, A., Jr., Poggianti, B. M., et al. 2013, ApJ, 770, 62
- Finn et al. (2005) Finn, R. A., Zaritsky, D., McCarthy, D. W., Jr., et al. 2005, ApJ, 630, 206
- Fujita & Nagashima (1999) Fujita, Y., & Nagashima, M. 1999, ApJ, 516, 619
- Gilmour et al. (2007) Gilmour, R., Gray, M. E., Almaini, O., et al. 2007, MNRAS, 380, 1467
- Gnedin (2003) Gnedin, O. Y. 2003, ApJ, 589, 752
- Goto et al. (2003) Goto, T., Yamauchi, C., Fujita, Y., et al. 2003, MNRAS, 346, 601
- Graham & Guzmán (2003) Graham, A. W., & Guzmán, R. 2003, AJ, 125, 2936
- Gray et al. (2009) Gray, M. E., Wolf, C., Barden, M., et al. 2009, MNRAS, 393, 1275
- Gunn & Gott (1972) Gunn, J. E., & Gott, J. R., III 1972, ApJ, 176, 1
- Haines et al. (2013) Haines, C. P., Pereira, M. J., Smith, G. P., et al. 2013, ApJ, 775, 126
- Hashimoto et al. (1998) Hashimoto, Y., Oemler, A., Jr., Lin, H., & Tucker, D. L. 1998, ApJ, 499, 589
- Hernández-Fernández et al. (2014) Hernández-Fernández, J. D., Haines, C. P., Diaferio, A., et al. 2014, MNRAS, 438, 2186
- Heymans et al. (2008) Heymans, C., Gray, M. E., Peng, C. Y., et al. 2008, MNRAS, 385, 1431
- Hilz et al. (2013) Hilz, M., Naab, T., & Ostriker, J. P. 2013, MNRAS, 429, 2924
- Hopkins et al. (2009) Hopkins, P. F., Cox, T. J., Younger, J. D., & Hernquist, L. 2009, ApJ, 691, 1168
- Jaffé et al. (2015) Jaffé, Y. L., Smith, R., Candlish, G. N., et al. 2015, MNRAS, 448, 1715
- Jogee et al. (2005) Jogee, S., Scoville, N., & Kenney, J. D. P. 2005, ApJ, 630, 837
- Kautsch et al. (2008) Kautsch, S. J., Gonzalez, A. H., Soto, C. A., et al. 2008, ApJL, 688, L5
- Kennicutt (1998) Kennicutt, R. C., Jr. 1998, ARAA, 36, 189
- Kereš et al. (2005) Kereš, D., Katz, N., Weinberg, D. H., & Davé, R. 2005, MNRAS, 363, 2
- Khochfar & Silk (2006) Khochfar, S., & Silk, J. 2006, MNRAS, 370, 902
- Khochfar & Silk (2009) Khochfar, S., & Silk, J. 2009, MNRAS, 397, 506
- Khosroshahi et al. (2000) Khosroshahi, H. G., Wadadekar, Y., & Kembhavi, A. 2000, ApJ, 533, 162
- Kodama et al. (2004) Kodama, T., Balogh, M. L., Smail, I., Bower, R. G., & Nakata, F. 2004, MNRAS, 354, 1103
- Kormendy (1993) Kormendy J., 1993, in DeJonghe H., Habing H. J., eds, Proc. IAU Symp. 153, Galactic Bulges. Kluwer, Dordrecht, p. 209
- Kormendy & Bender (2012) Kormendy, J., & Bender, R. 2012, ApJS, 198, 2
- Kormendy & Kennicutt (2004) Kormendy, J., & Kennicutt, R. C., Jr. 2004, ARAA, 42, 603
- Kormendy et al. (2009) Kormendy, J., Fisher, D. B., Cornell, M. E., & Bender, R. 2009, ApJS, 182, 216
- Koyama et al. (2010) Koyama, Y., Kodama, T., Shimasaku, K., et al. 2010, MNRAS, 403, 1611
- Lange et al. (2015) Lange, R., Driver, S. P., Robotham, A. S. G., et al. 2015, MNRAS, 447, 2603
- Larson et al. (1980) Larson, R. B., Tinsley, B. M., & Caldwell, C. N. 1980, ApJ, 237, 692
- Lidman et al. (2008) Lidman, C., Rosati, P., Tanaka, M., et al. 2008, A&A, 489, 981
- Lopes et al. (2014) Lopes, P. A. A., Ribeiro, A. L. B., & Rembold, S. B. 2014, MNRAS, 437, 2430
- Maltby et al. (2010) Maltby, D. T., Aragón-Salamanca, A., Gray, M. E., et al. 2010, MNRAS, 402, 282
- Maltby et al. (2015) Maltby, D. T., Aragón-Salamanca, A., Gray, M. E., et al. 2015, MNRAS, 447, 1506
- Mahajan et al. (2011) Mahajan, S., Mamon, G. A., & Raychaudhury, S. 2011, MNRAS, 416, 2882
- Masters et al. (2010) Masters, K. L., Mosleh, M., Romer, A. K., et al. 2010, MNRAS, 405, 783
- Moore et al. (1996) Moore, B., Katz, N., Lake, G., Dressler, A., & Oemler, A. 1996, Nature, 379, 613
- Moran et al. (2007) Moran, S. M., Ellis, R. S., Treu, T., et al. 2007, ApJ, 671, 1503
- Muzzin et al. (2014) Muzzin, A., van der Burg, R. F. J., McGee, S. L., et al. 2014, ApJ, 796, 65
- Muzzin et al. (2012) Muzzin, A., Wilson, G., Yee, H. K. C., et al. 2012, ApJ, 746, 188
- Nagao et al. (2006) Nagao, T., Maiolino, R., & Marconi, A. 2006, A&A, 459, 85
- Noble et al. (2016) Noble, A. G., Webb, T. M. A., Yee, H. K. C., et al. 2016, ApJ, 816, 48
- Norberg et al. (2002) Norberg, P., Baugh, C. M., Hawkins, E., et al. 2002, MNRAS, 332, 827
- Ocvirk et al. (2008) Ocvirk, P., Pichon, C., & Teyssier, R. 2008, MNRAS, 390, 1326
- Oman et al. (2013) Oman, K. A., Hudson, M. J., & Behroozi, P. S. 2013, MNRAS, 431, 2307
- Oser et al. (2012) Oser, L., Naab, T., Ostriker, J. P., & Johansson, P. H. 2012, ApJ, 744, 63
- Patel et al. (2009) Patel, S. G., Holden, B. P., Kelson, D. D., Illingworth, G. D., & Franx, M. 2009, ApJL, 705, L67
- Pettini & Pagel (2004) Pettini, M., & Pagel, B. E. J. 2004, MNRAS, 348, L59
- Poggianti et al. (2001) Poggianti, B. M., Bridges, T. J., Carter, D., et al. 2001, ApJ, 563, 118
- Poggianti et al. (2008) Poggianti, B. M., Desai, V., Finn, R., et al. 2008, ApJ, 684, 888-904
- Postman et al. (2005) Postman, M., Franx, M., Cross, N. J. G., et al. 2005, ApJ, 623, 721
- Postman & Geller (1984) Postman, M., & Geller, M. J. 1984, ApJ, 281, 95
- Regos & Geller (1989) Regos, E., & Geller, M. J. 1989, AJ, 98, 755
- Rodríguez del Pino et al. (2017) Rodríguez del Pino, B., Aragón-Salamanca, A., Chies-Santos, A. L., et al. 2017, MNRAS,
- Rines et al. (2005) Rines, K., Geller, M. J., Kurtz, M. J., & Diaferio, A. 2005, AJ, 130, 1482
- Sérsic (1963) Sérsic, J. L. 1963, Boletin de la Asociacion Argentina de Astronomia La Plata Argentina, 6, 41
- Skibba et al. (2009) Skibba, R. A., Bamford, S. P., Nichol, R. C., et al. 2009, MNRAS, 399, 966
- Taranu et al. (2014) Taranu, D. S., Hudson, M. J., Balogh, M. L., et al. 2014, MNRAS, 440, 1934
- Toomre (1977) Toomre A., 1977, in Tinsley B. M., Larson R. B. G., Campbell D., eds, Evolution of Galaxies and Stellar Populations. Yale Univ. Observatory, New Haven, p. 401
- Tran et al. (2005) Tran, K.-V. H., van Dokkum, P., Illingworth, G. D., et al. 2005, ApJ, 619, 134
- Webb et al. (2013) Webb, T. M. A., O’Donnell, D., Yee, H. K. C., et al. 2013, AJ, 146, 84
- Wegner et al. (2015) Wegner, G. A., Chu, D. S., & Hwang, H. S. 2015, MNRAS, 447, 1126
- Weinzirl et al. (2015) Weinzirl, T., Aragón-Salamanca, A., Bamford, S. P., et al. 2015, MNRAS, 454, 1387
- Weinzirl et al. (2011) Weinzirl, T., Jogee, S., Conselice, C. J., et al. 2011, ApJ, 743, 87
- Weinzirl et al. (2014) Weinzirl, T., Jogee, S., Neistein, E., et al. 2014, MNRAS, 441, 3083
- Wolf et al. (2009) Wolf, C., Aragón-Salamanca, A., Balogh, M., et al. 2009, MNRAS, 393, 1302
- Wolf et al. (2007) Wolf, C., Gray, M. E., Aragón-Salamanca, A., Lane, K. P., & Meisenheimer, K. 2007, MNRAS, 376, L1
- Wolf et al. (2005) Wolf, C., Gray, M. E., & Meisenheimer, K. 2005, A&A, 443, 435
- Wolf et al. (2003) Wolf, C., Meisenheimer, K., Rix, H.-W., et al. 2003, A&A, 401, 73
- Zabludoff & Mulchaey (1998) Zabludoff, A. I., & Mulchaey, J. S. 1998, ApJ, 496, 39