decays from photoproduction of -mesons off protons
Abstract
A study of the partial-wave content of the reaction in the fourth resonance region is presented, which has been prompted by new measurements of polarization observables for that process. Using the Bonn-Gatchina partial-wave formalism, the incorporation of new data indicates that the , , , and are the most significant contributors to the photoproduction process. New results for the branching ratios of the decays of these more prominent resonances to final states are provided; such branches have not been indicated in the most recent edition of the Review of Particle Properties. Based on the analysis performed here, predictions for the helicity asymmetry for the reaction are presented.
keywords:
baryon spectroscopy , meson photoproduction , polarization observables1 Introduction
The cross section for pion-nucleon elastic scattering as a function of center-of-mass energy reveals four distinct but broad energy ranges where enhancements are observed, which are called resonance regions. The first resonance region is principally due to formation, which dominates the cross section at low masses. Somewhat higher in , the second resonance region houses the as the leading resonance, along with contributions from the and excitations. At still higher , several well-known resonances contribute to the third resonance region, in particular the state. At MeV, the fourth resonance region appears as a small peak-like structure in the total cross section, which is largely due to the excitation with substantial contributions from other resonances.
Interestingly, resonance contributions to the fourth resonance region have been difficult to identify, and these contributions are presently under study in a number of experiments. Photoproduction of -mesons offers the chance to search for low-spin high-mass nucleon resonances in the region above MeV. Due to isospin conservation, the reaction receives contributions only from intermediate states, and thus the reaction functions as an “isospin filter” for the nucleon resonance spectrum, helping isolate those states. Furthermore, due to the angular momentum barrier, high-spin resonances are suppressed. Consequently, the photoproduction of mesons can be expected to shed light on the low-spin resonances in the fourth resonance region.
Photoproduction of -mesons was first studied at DESY in a hydrogen bubble chamber [1] and a streamer chamber [2], though only a few events were observed for incident photon energies up to 6.3 GeV. At ELSA in Bonn, the reaction was investigated with the magnetic spectrometer SAPHIR in the energy range from 900 to 2600 MeV; 250 events due to production were reported. The linear forward rise of the angular distribution was assigned to two resonances with [3]. Within the MAID model, the SAPHIR data were described by the interference of a resonance and the exchange of a -channel Regge trajectory [4]. When the new data from CLAS on photoproduction on the proton for 1935 MeV 2249 MeV [5] were included in the fit, four resonances with and were required to achieve a good description [6] of the data. Huang, Haberzettl, and Nakayama [7] included additionally data on the differential cross sections on photoproduction off protons from the CLAS collaboration, which covered the range from the production threshold up to MeV [8], and the CBELSA/TAPS data off protons [9] and off nucleons bound in the deuteron [10] taken from the production threshold up to MeV. The fit required a subthreshold contribution of and three above-threshold resonances with quantum numbers and . Recently, the A2 Collaboration at MAMI studied the reaction and [11]. A strong cusp is observed in the excitation functions in vicinity of the threshold. Within the -MAID isobar model, the cusp is interpreted by production of the nucleon resonance and its significant decay branching ratios to both, to and . Indeed, all analyses agree that the threshold in photoproduction is governed by a resonance with and a mass of about 1900 MeV. In addition, there is evidence for , and contributions from a resonance from a resonance also have been suggested.
Partial-wave analyses benefit tremendously from data on meson photoproduction observables obtained when different relative orientations of the spin of the incident photon or the struck nucleon (or both) are available (so-called “polarization observables”). Such data are now becoming available for the reaction. Recently, the GRAAL collaboration reported a measurement of the linearly-polarized photon beam asymmetry for photoproduction on unpolarized protons near threshold [12]. More recently, the CLAS collaboration [13] also measured over an extended mass range from threshold up to 2092 MeV. These new data on stimulated us to study the partial-wave content of the reaction using a model that also describes simultaneously data for the photoproduction of other mesons as well. Such multi-channel analyses can provide great insight into the nucleon resonance spectrum since the strengths of the decay modes for the various resonances participating in the process vary greatly from one final state to another.
2 Formalism
For the investigation reported here, a partial-wave analysis was performed with the Bonn-Gatchina (BnGa) formalism, described more fully elsewhere [14, 16, 17, 18]. Briefly, this approach uses a modified -matrix in the form
| (1) |
that is defined in the complex plane. On the real axis, . The -matrix elements combine the contributions from resonances and from background through
| (2) |
Here, are coupling constants of the pole to the initial state and the final state . defines the -matrix pole (which differs from the -matrix pole which is listed in the RPP). represents non-resonant background contributions. could be functions of but in practice, a constant term is sufficient to achieve good fits. Only for the wave, a more complicated expression was used:
| (3) |
where are constants determined in the fit.
The multi-channel amplitude with matrix elements defines the transition amplitude from channel to channel . is a diagonal matrix with an imaginary part given by the corresponding phase space volume
| (4) |
where is calculated from the dispersion integral with one subtraction regularization. In addition to this modified -matrix, we have also included a Regge-ized amplitude describing the exchange of vector mesons in the -channel [18]. For the fits of the existing data with this approach, we restricted the mass range to MeV since many nucleon resonances will contribute to the process at high incident photon energies, making it difficult to identify the leading contributions.
In the reaction , the coupling constants in the initial and the final state are weak. In this case, a simplified amplitude can be used
| (5) |
The transition from the initial state to the K-matrix channel is represented by
| (6) |
where are resonance couplings and describes the non-resonant transition.
| (7) |
represents the transition from the channel to the final state ’’. corresponds to a tree diagram for the transition from initial channel ( in the case photoproduction) to the state ’’:
| (8) |
Direct non-resonant transitions to the final state and were set to zero in this analysis and only the decay couplings were fitted as free parameters.
The forward peak in the differential cross section at high energies is described by a Reggeized -meson exchange amplitude [14, 15]. If the photoproduction data are fitted with Eqn. (5) the projection of the t,u-channel amplitude into partial waves only contributes to the term. If the channel is taken into account as a channel, the t,u-channel amplitudes should contribute also to the P-vectors and to the full amplitude due to rescattering via a meson loop diagram. However, such a contribution is very small compare to the other components (e.g. nonresonant transition to channel) and can be neglected in the fit.
With as vertex function and form factor, as trajectory, , as normalization factor, we obtain [14]:
| (9) |
To eliminate the poles at , additional -functions are introduced in (9) by replacing
| (10) |
The trajectory is parametrized as
| (11) |
where is given in GeV2. The amplitude in Eq. (9) is related to the cross section by
| (12) |
3 Fits to the data on
In addition to the data on production, we used further data to constrain the amplitudes. We used the results on the real and imaginary part of the scattering amplitude for the partial waves up to from Ref. [20] and data on pion and photoproduction data with , , , , , and in the final state. A list of the data with references can be found on our web page (pwa.hiskp.uni-bonn.de/). This primary fit was used for a study of [18], [21], [22], and now for decays.
The primary fits for this analysis used all data listed above except those on and . Different primary fits were made, all gave a good description of the data. The fits differed in the number of -matrix poles assumed to contribute to the partial wave (corresponding to resonances at 1720, 1900, 2200, with or without a resonance at 1960 MeV), two or three resonances in the partial wave (at 1680 and 1860 and/or 2100 MeV), different helicity couplings for . Furthermore, resonances above 2 GeV with spin parities up to were added (one by one) in all partial waves. Sometimes a better fit was achieved but the gain in was not sufficient to claim evidence for new resonances.
For most fits which included the data on , all parameters of one of these fits were frozen, and only additional decay were admitted. These fits used different primary fits and resulted in a variation of branching ratios. In final fits, all parameters were varied but they remained stably in the local minimum.
For reaction , the following data were included: The differential cross sections from the CBELSA/ TAPS (CBT) experiment [9] cover the range from threshold to 2360 MeV in invariant mass. The data are divided into 20 mass bins and 10 bins in , where gives the direction in the center-of-mass system. The more recent CLAS publication on the process [8] reported differential cross sections up to =2840 MeV, in 40 mass bins and 20 angular bins with superior statistics. The existence of two different data sets with different systematics allows for valuable cross checks on the results from the two experiments.
The CLAS differential cross sections have a systematic uncertainty of about 12%, which, when used as a scaling factor in the fit, helped increase the compatibility of the
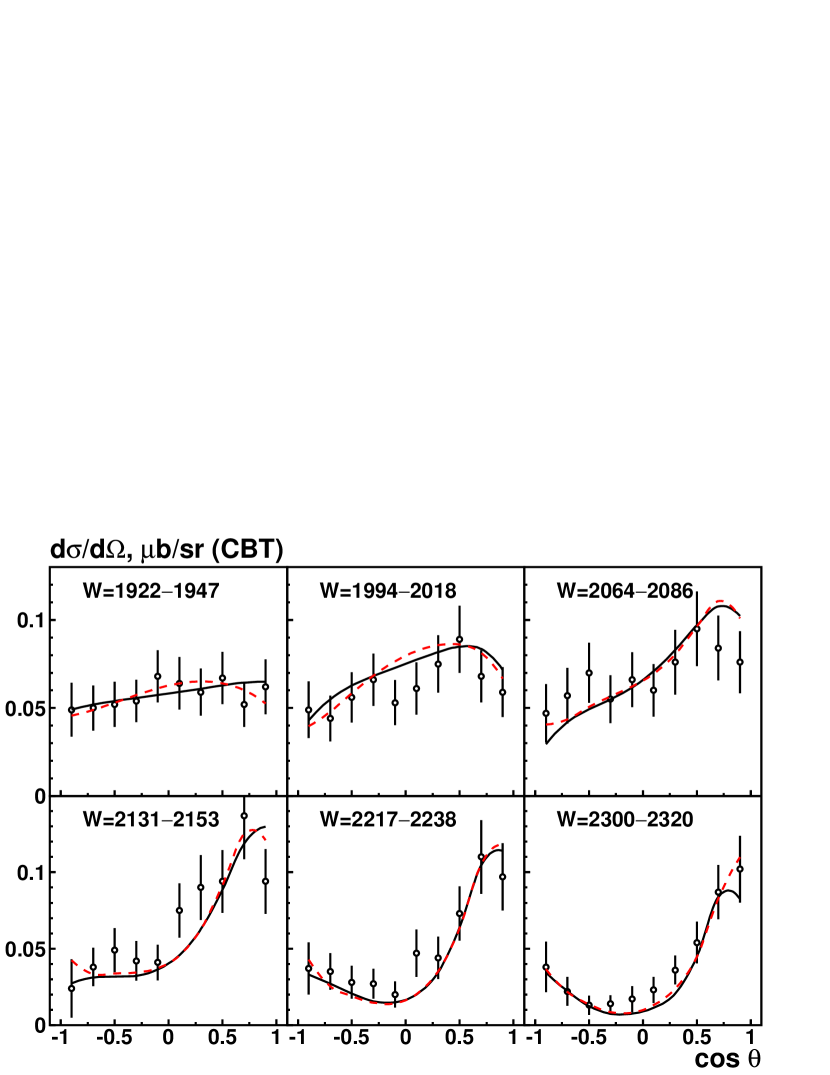
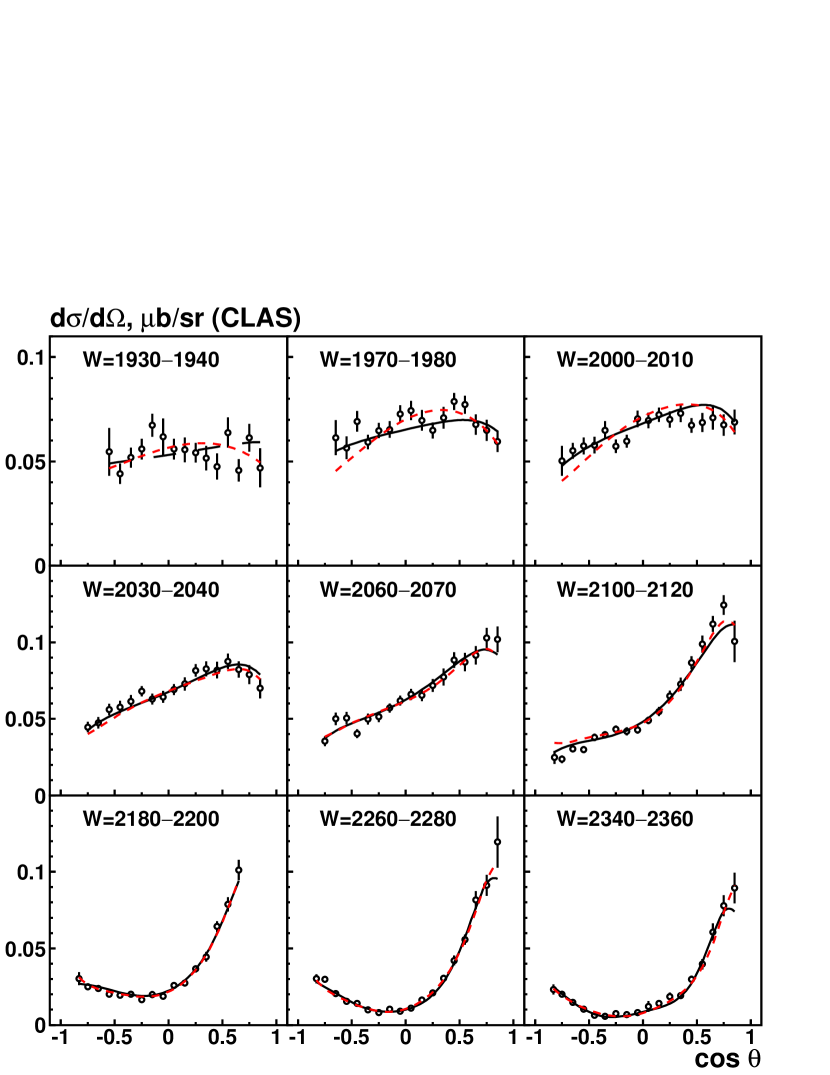
CLAS and CBELSA/TAPS differential cross sections. In the fits, the CLAS differential cross sections were multiplied with a scaling factor ; the fit returned a scaling factor 0.9. Thus, the curves shown for the CLAS differential cross section are multiplied with 0.9. Likewise, the systematic uncertainty of 6% for the beam asymmetry data from CLAS [13] was incorporated, and the predicted beam asymmetry from the fit was found to be larger by 6% than the data. Beyond these three experiments, most existing data on pion- and photo-induced reactions leading to two or three particles in the final state were included in the fit; the dataset is described more fully in Refs. [23, 24, 25].
As might be expected when many parameters are involved, the fits of the formalism to this dataset did not converge to a unique minimum with a single set of parameters. In the fits, we studied the impact of different choices of high-mass resonances. The properties of most resonances remained stable. For the reaction , two distinct classes of minima were found with a very similar fit quality (expressed as a total ). Table 1 gives the number of data points, the total , and the breakdown of the individual contributions. Figure 1 shows the differential cross sections from the CBELSA/TAPS and CLAS experiments for selected mass bins, indicating the general quality of the fit obtained. In general, the description of the data is very good. At high masses, the CBELSA/TAPS differential cross section data are not fully compatible with the CLAS data; instead the former results tend to be larger. Nevertheless, both datasets can be fit simultaneously when the relative normalization is allowed to adjust the data within the stated systematic uncertainties. The resulting fit values are excellent for both datasets.
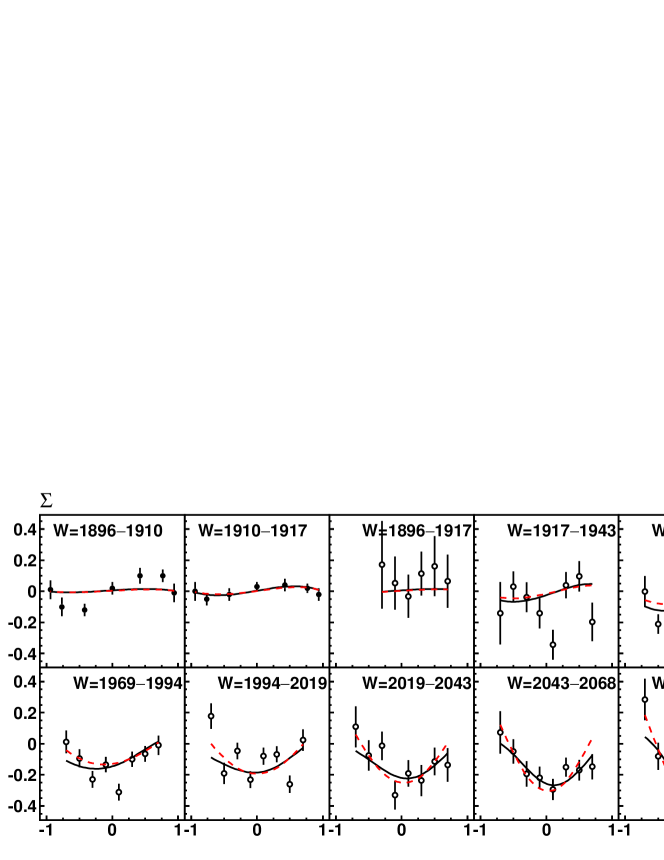
Figure 2 shows data for the beam asymmetry from the GRAAL [12] and the CLAS [13] experiment. GRAAL reported for two mass bins just above the threshold. Surprisingly, the photon beam asymmetry is already considerably strong just 7 MeV above the threshold and then weaker at 16 MeV above the threshold. This rapid change in magnitude points to large interferences among multiple resonances below the production threshold. The GRAAL beam asymmetry data could not be fit, however, unless solutions were accepted where other data were badly described and/or where some had very large coupling constants. In the end, we accepted that the GRAAL data at 1903 MeV could not be fully reproduced.
The CLAS data on the beam asymmetry are also shown in Fig. 2. Overall, the fit obtained is reasonable, though the fit trend is smoother than the data. The disagreement between fit and data is slightly larger than the statistical uncertainties for several points, and, as a result, the per data point is larger than 1 (see Table 1).
| Fit 1 | Fit 2 | ||||
|---|---|---|---|---|---|
| 200 | CBT | [9] | 1.11 | 1.05 | |
| 524 | CLAS | [8] | 1.40 | 1.53 | |
| 14 | GRAAL | [12] | 1.49 | 1.55 | |
| 56 | CLAS | [13] | 1.78 | 1.64 | |
| total | 794 | all | 1.42 | 1.46 |
4 Partial-wave content of the fit to
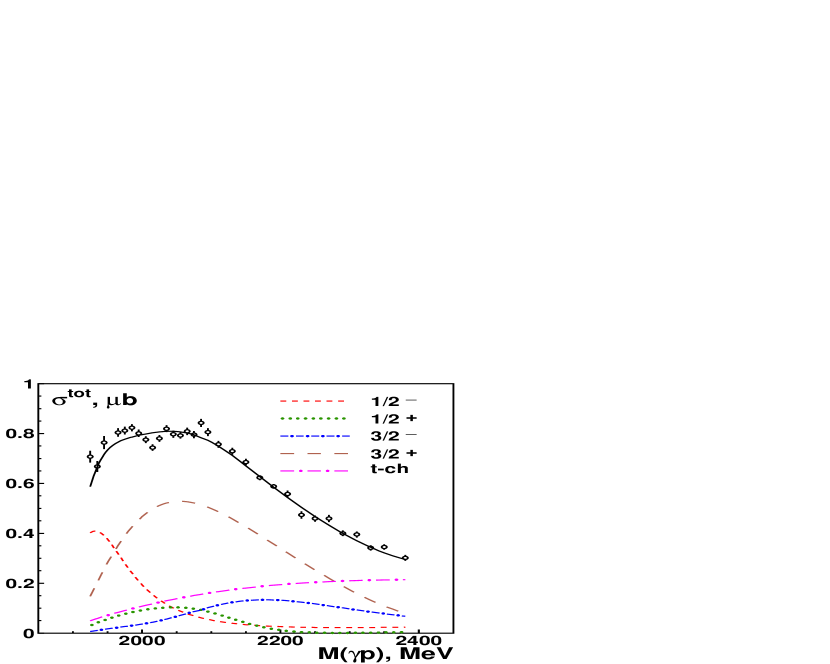
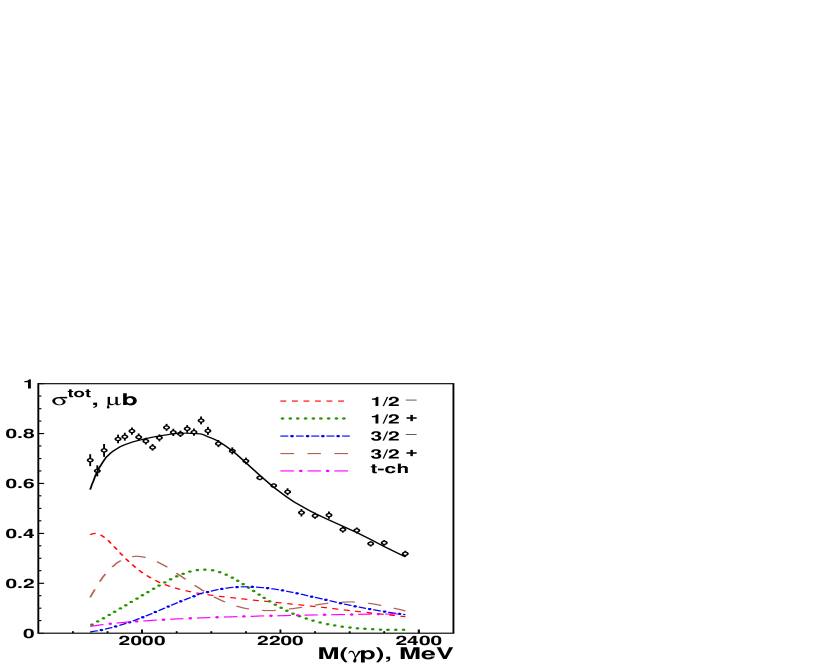
Having arrived at two reasonable descriptions of the differential cross section and photon beam asymmetry data, predictions of those fits for the total cross section can be made and the importance of the contributions to the total cross section from various resonances can be assessed. In comparing the CLAS data to the results of the fit, the total cross section for the reaction can be obtained by summation of the differential cross sections over the solid angle, using the PWA fit result for those regions of solid angle not covered by the CLAS results.
The resulting total cross section predictions from the two fits described above are shown in Fig. 3. Also shown in the figure are the most important partial-wave contributions to the total cross section from both fits. As seen in the figure, at and slightly above the threshold, the resonance is seen to dominate the reaction in both solutions. This resonance matches the characteristic energy, spin, and parity suggested in the previous analyses of the differential cross section data mentioned in the Introduction, where all agreed that the threshold region was governed by a resonance with and a mass of about 1900 MeV. The state is a “two star” resonance in the most recent Review of Particle Physics (RPP) [28]. Also common to both our solutions is the strong contribution of the excited state, a “three-star” resonance in the RPP. With respect to the fits reported here, however, the contributions from and were found to be significantly different in the two fits arrived at here. Small contributions were seen in the fits from the and resonances, but those are not shown in Fig. 3.
To investigate improvements of the fit with additional resonances in the mass region above 2200 MeV, additional poles were added to the -matrix, one-by-one, with the resulting computed. The additional poles had spin-parities of , , , . Although each additional state improved the quality of the fit somewhat based on , no fit with an additional contribution was obviously superior to another. Instead, the variations in the parameters resulting from these additions were used to estimate the model dependence of the results for the fits.
In Table 2, the branching ratios deduced from these fits for decays are presented for the six resonances used in both fits. Two of these resonances have masses very close to the production threshold. Branching ratios are usually defined at the nominal mass of a resonance and vanish identically when the threshold is above the nominal mass. However, due to the finite width of nucleon excitations (typically 100 MeV or more), a resonance with a mass below the threshold may nevertheless still decay into a final state that lies above the threshold. Therefore, we use a different definition:
| (13) |
The Breit-Wigner mass and the parameter are adjusted so that its pole matches the pole position of the full amplitude, is typically in the range . The uncertainties in the branching ratios cover the variations seen in these branching ratios when different primary fits were used.
| Fit 1 | Fit 2 | |||
|---|---|---|---|---|
| Resonance | B.R. | B.R. | ||
| 113 | 74 | 145 | 90 | |
| 82 | 105 | 72 | 150 | |
| 31 | 123 | 42 | 242 | |
| 62 | 137 | 62 | 101 | |
| 1 | 3 | 1 | 6 | |
| 1 | 2 | 21 | 11 | |
Also given in Table 2 are the changes in when one of the resonances is omitted from the fit. The uncertainties in the branching ratios were estimated from the spread of results obtained by adding one of the high-mass resonances. In most cases, the uncertainties have sizes which are similar to the differences between Fit 1 and Fit 2. We therefore combined these differences with the uncertainties in Table 2 and find the final results which are collected in Table 3.
| Branching ratios (in %) for | |||||||||||
|---|---|---|---|---|---|---|---|---|---|---|---|
| phase | phase | ||||||||||
| 190710 | -156 | 135 | 2.51.5 | 105 | 2812 | 74 | - | - | |||
| -(3535)° | |||||||||||
| 210030 | 28035 | -64 | 125 | 83 | 165 | 2510 | 1510 | 104 | 304 | 206 | |
| (1025)° | (7030)° | ||||||||||
| 211540 | 34535 | 13045 | 16060 | 42 | 53 | 32 | 128 | 7023 | 114 | ||
| -(4025)° | -(3015)° | ||||||||||
| 191030 | 28050 | 2614 | -7030 | 62 | 32 | 31 | 159 | 5015 | 158 | 43 | |
| (6035)° | (7050)° | ||||||||||
In Table 3 we also present pole positions, helicity couplings, and other branching ratios which are taken from [25, 18, 27]. The branching ratios for decays into and will be presented in a forthcoming publication. In two cases, the sum of the observed branching ratios exceeds 1 but is still compatible with 1 when the large errors are considered.
The uncertainties in the branching ratios in Table 3 are ranges within which a fit solution is possible. While these uncertainties are relatively large, the four resonances do have statistically significant branches to based on the analysis reported here. The statistical evidence for the decay mode should be judged from the change in when a resonance is removed (see Table 2) and not from the total uncertainties in Table 3.
The most recent RPP does not report any observed branching ratios for decays into . This analysis suggests that statistically significant branches exist for four of the six states indicated in Table 2. If confirmed, these branches represents a useful test for any model for the decays of those states based on, for example, a quark description of the nucleon, especially when combined with similar data for photoproduction on the nucleon.
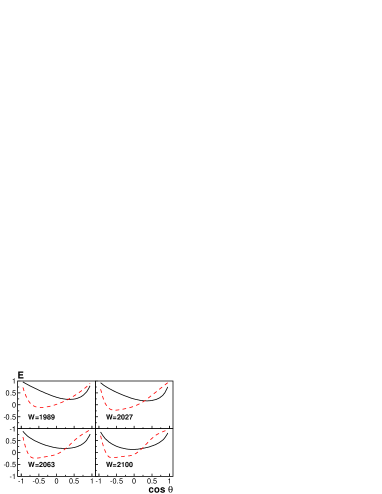
The ambiguities in the parameters and resonances observed in the partial-wave analyses conducted here might be resolved by further data on photoproduction, as well as additional data on spin observables for the photoproduction of other mesons from the nucleon. With respect to , the CBELSA/ TAPS collaboration has presented preliminary results on the helicity difference for the reaction [29]. Since those data are preliminary, those data were not yet included in the present fits. However, when finalized, those results may help to discriminate between the two fit solutions and to better constrain the parameters and branching ratios obtained in this work. With that in mind, Figure 4 shows our prediction for the helicity asymmetry for the reaction based on the two partial-wave solutions found in this work.
5 Conclusion
We have included new data on the reaction in a fit to the BnGa database for meson photoproduction. A partial-wave analysis identifies the leading resonance contributions and provides additional support for the existence of , , , and . When analyzed in terms of these resonances, statistically significant branching ratios for their decays into were determined. In the most recent PDG summary, no such branches are indicated as having been seen. Additional data on spin observables should help pin down the issue of whether these branches to are present for the resonances of Table 2, which, in turn, will help test models of the nucleon.
6 Acknowledgments
This work was supported by the Deutsche Forschungsgemeinschaft (SFB/TR110) and by the RSF grant 16-12-10267. Work at Arizona State University was supported by the U. S. National Science Foundation under award PHY-1306737. This material is in part based upon work supported by the U.S. Department of Energy, Office of Science, Office of Nuclear Physics under contract DE-AC05-06OR23177.
References
- [1] [Aachen-Berlin-Bonn-Hamburg-Heidelberg-Munich Collaboration], Phys. Rev. 175, 1669 (1968).
- [2] W. Struczinski et al. [Aachen-Hamburg-Heidelberg-Munich Collaboration], Nucl. Phys. B 108, 45 (1976).
- [3] R. Plötzke et al. [SAPHIR Collaboration], Phys. Lett. B 444, 555 (1998).
- [4] W. T. Chiang, S. N. Yang, L. Tiator, M. Vanderhaeghen and D. Drechsel, Phys. Rev. C 68, 045202 (2003).
- [5] M. Dugger et al. [CLAS Collaboration], Phys. Rev. Lett. 96, 062001 (2006) Erratum: [Phys. Rev. Lett. 96, 169905 (2006)].
- [6] L. Tiator, Int. J. Mod. Phys. A 22, 297 (2007).
- [7] F. Huang, H. Haberzettl and K. Nakayama, Phys. Rev. C 87, 054004 (2013).
- [8] M. Williams et al. [CLAS Collaboration], Phys. Rev. C 80, 045213 (2009).
- [9] V. Crede et al. [CBELSA/TAPS Collaboration], Phys. Rev. C 80, 055202 (2009).
- [10] I. Jaegle et al. [CBELSA/TAPS Collaboration], Eur. Phys. J. A 47, 11 (2011).
- [11] V. L. Kashevarov et al., Phys. Rev. Lett. 118, no. 21, 212001 (2017).
- [12] P. Levi Sandri et al., Eur. Phys. J. A 51, no. 7, 77 (2015).
- [13] P. Collins et al., “Photon beam asymmetry for and photoproduction from the proton,” arXiv:1703.00433 [nucl-ex].
- [14] A. Anisovich, E. Klempt, A. Sarantsev and U. Thoma, Eur. Phys. J. A 24, 111 (2005).
- [15] A. V. Sarantsev, A. V. Anisovich, V. A. Nikonov and H. Schmieden, Eur. Phys. J. A 39, 61 (2009).
- [16] A. V. Anisovich and A. V. Sarantsev, Eur. Phys. J. A 30, 427 (2006).
- [17] A. V. Anisovich, V. V. Anisovich, E. Klempt, V. A. Nikonov and A. V. Sarantsev, Eur. Phys. J. A 34, 129 (2007).
- [18] I. Denisenko et al., Phys. Lett. B 755, 97 (2016).
- [19] S. U. Chung, J. Brose, R. Hackmann, E. Klempt, S. Spanier and C. Strassburger, Annalen Phys. 4, 404 (1995).
- [20] R. A. Arndt, W. J. Briscoe, I. I. Strakovsky and R. L. Workman, Phys. Rev. C 74, 045205 (2006).
- [21] J. Müller et al. [CBELSA/TAPS Collaboration], submitted to Phys. Lett. (2017).
- [22] A. V. Anisovich et al. [CBELSA/TAPS Collaboration], submitted to Phys. Lett. (2017).
- [23] A. V. Anisovich, R. Beck, E. Klempt, V. A. Nikonov, A. V. Sarantsev and U. Thoma, Eur. Phys. J. A 48, 15 (2012).
- [24] E. Gutz et al. [CBELSA/TAPS Collaboration], Eur. Phys. J. A 50, 74 (2014).
- [25] V. Sokhoyan et al. [CBELSA/TAPS Collaboration], Eur. Phys. J. A 51, no. 8, 95 (2015) Erratum: [Eur. Phys. J. A 51, no. 12, 187 (2015)].
- [26] T. Sekihara, S. Sakai and D. Jido, Phys. Rev. C 94, no. 2, 025203 (2016).
- [27] J. Müller et al. [CBELSA/TAPS Collaboration], New data on with polarized photons and protons and their implications for decays, submitted to Physics Letters B.
- [28] C. Patrignani et al. [Particle Data Group], Chin. Phys. C 40, no. 10, 100001 (2016).
- [29] F. N. Afzal [CBELSA/TAPS Collaboration], EPJ Web Conf. 37, 09001 (2012).