The TUS detector of extreme energy cosmic rays on board the Lomonosov satellite
Abstract
The origin and nature of extreme energy cosmic rays (EECRs), which have energies above the eV, the Greisen–Zatsepin–Kuzmin (GZK) energy limit, is one of the most interesting and complicated problems in modern cosmic-ray physics. Existing ground-based detectors have helped to obtain remarkable results in studying cosmic rays before and after the GZK limit, but have also produced some contradictions in our understanding of cosmic ray mass composition. Moreover, each of these detectors covers only a part of the celestial sphere, which poses problems for studying the arrival directions of EECRs and identifying their sources. As a new generation of EECR space detectors, TUS (Tracking Ultraviolet Set-up), KLYPVE and JEM-EUSO, are intended to study the most energetic cosmic-ray particles, providing larger, uniform exposures of the entire celestial sphere. The TUS detector, launched on board the Lomonosov satellite on April 28, 2016, from Vostochny Cosmodrome in Russia, is the first of these. It employs a single-mirror optical system and a photomultiplier tube matrix as a photo-detector and will test the fluorescent method of measuring EECRs from space. Utilizing the Earth’s atmosphere as a huge calorimeter, it is expected to detect EECRs with energies above eV. It will also be able to register slower atmospheric transient events: atmospheric fluorescence in electrical discharges of various types including precipitating electrons escaping the magnetosphere and from the radiation of meteors passing through the atmosphere. We describe the design of the TUS detector and present results of different ground-based tests and simulations.
1 Introduction
The extremely low flux of extreme energy cosmic rays (EECRs) with energies above eV (the Greisen–Zatsepin–Kuzmin (GZK) energy limit) prevents the collection of sufficiently large amounts of data by existing ground-based experimental arrays. One solution for this problem is the development of new detection methods with exposures of at least an order of magnitude greater than those achieved by the existing approaches. The observation of the ultraviolet (UV) fluorescence of extensive air showers (EAS) from satellites proposed by Benson and Linsley (1981) promises to become such an approach. Such a large-aperture, space-based fluorescence detector situated in an orbit above the atmosphere (–500 km) should provide a field of view (FOV) sufficiently wide to observe area of the atmosphere of km2 in order to collect an adequate sample of fluorescence photons; in comparison, the largest area of the fluorescent ground-based detectors is the 3000 km2 Auger project (Abraham et al., 2010). One technical challenge in the development of an optical system for such a space detector is the development of sufficient precision optics ( km resolution in the atmosphere) and large aperture (2–3 m in diameter) with an FOV of –30 degrees. Two alternative optical systems have been suggested for space fluorescence detectors:
-
1.
Wide-field-of-view optics implemented with complex large-lens optical systems. This approach was chosen for the EUSO (Scarsi, 1997) and JEM-EUSO (Takahashi et al., 2009) projects.
-
2.
Large-mirror optics-based technology from the development of large-area concentrators for solar generators (a Russian initiative of SINP MSU and RCS Energia, see Garipov et al., 1998). Such an optical system was realized in the TUS detector (Abrashkin et al., 2007) and is being implemented with a few improvements for the KLYPVE project (Aleksandrov et al., 2000; Khrenov et al., 2001; Panasyuk et al., 2015). An optical scheme with a huge mirror has also been considered for the OWL project (Stecker et al., 2004; Krizmanic et al., 2013).
Orbital EECR detectors have the following advantages over ground-based experiments:
-
1.
Because of their great distance from the detector and the detector’s high resolution, EECR particle tracks can be observed over huge atmospheric areas. Given the height of the Lomonosov satellite orbit ( km), TUS will survey areas of up to 6400 km2.
-
2.
After several years of in-orbit operation, a single detector will make a uniform observation of the entire celestial sphere. Despite a possible inaccuracy in the determination of primary particle energies, this will allow a study of the distribution of EECR arrival directions. An unavoidable difference in energy response of ground-based arrays causes difference in EECR intensity because sky regions are covered differently by these arrays.
At the same time, a space EECR detector meets a number of technical challenges:
-
•
Observations of EAS from distances approximately 10 times greater than those of the ground-based experiments require higher sensitivity and greater angular resolution. A desirable resolution of the detector (FOV of a pixel) should be equal to the diameter of lateral electron distribution in a shower. For a satellite orbit height of 500 km, the angular resolution of an orbital detector should be 0.4–2 mrad, an order of magnitude greater than the 20 mrad resolution of existing detectors.
-
•
The night atmosphere background in the UV wavelength band (300–400 nm) varies over a satellite route. Data obtained with the Universitetsky-Tatiana and Universitetsky-Tatiana-2 satellites (Tatiana and Tatiana-2 in what follows) (Sadovnichy et al., 2011; Vedenkin et al., 2011; Garipov et al., 2013) assessed the scale of such variations as – photon cm-2 sr-1 s-1 for moonless nights (the lower value above the oceans, the higher above cities and regions of increased nighttime airglow such as those encountered during equatorial arcs). However, the upper limit increases to photon cm-2 sr-1 s-1 during full moon nights and auroral activity. Ground-based arrays operate on moonless nights at specially chosen locations with noise levels not exceeding photon cm-2 sr-1 s-1.
-
•
Impulsive noise from lightning and accompanying high altitude discharges will add to the average noise level and cause higher false triggering rates.
-
•
The technology of orbital fluorescence detectors should satisfy the complex conditions of operation on board satellites.
Bearing such circumstances in mind, a program for a gradual conversion from a ground-based fluorescence detector to space detectors was initiated, with the launch of the TUS detector as a first, comparatively simple instrument in order to prove the suitability of both the optical system design and the photodetector for satellite operation (Khrenov et al., 2001).
The TUS detector will also measure other phenomena of transient atmosphere radiation caused by electrical discharges in the atmosphere, meteorites, and dust grains with high sensitivity and temporal resolution, see Khrenov and Stulov (2006), Morozenko (2014), Panasyuk et al. (2016).
2 Orbital detector TUS
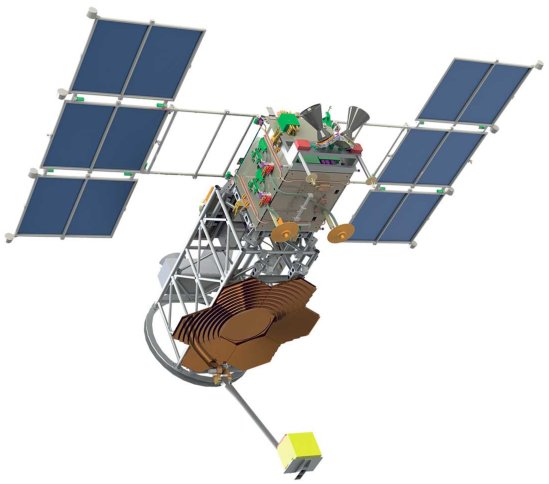
The TUS detector on board the Lomonosov satellite (Fig. 1) consists of the following elements: the segmented mirror-concentrator (SMC), the photodetector (PD), the photodetector moving system (PDMS), the Solar light sensor (SLS). Technical parameters of TUS are presented in Table 1.
| Parameter | Value |
|---|---|
| Mass | 60 kg |
| Power (maximum) | 65 W |
| Data (maximum) | 250 Mbyte/day |
| FOV | degree |
| Number of pixels | 256 (16 clusters of 16 PMTs) |
| Pixel size (FOV) | 10 mrad () |
| Mirror area | 2.0 m2 |
| Focal distance | 1.5 m |
| Duty cycle | 30% |
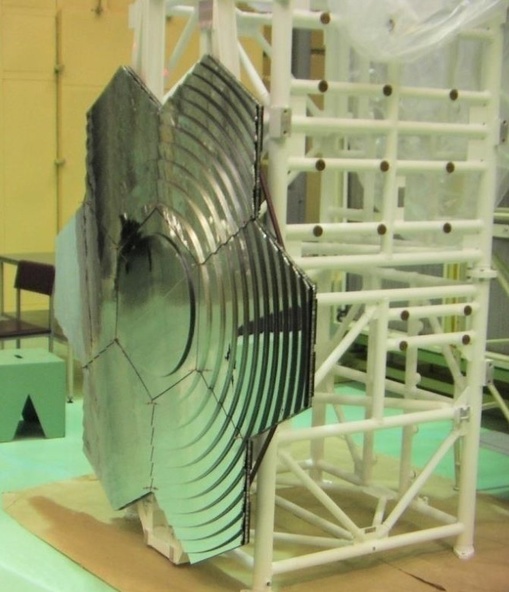
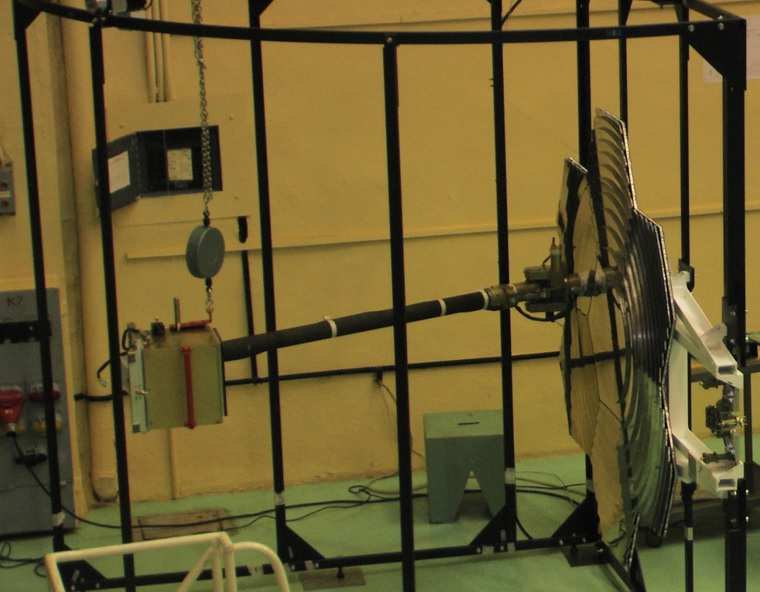
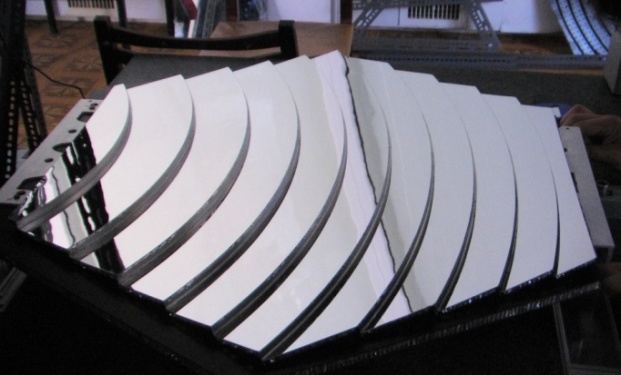
The mirror-concentrator shown in Fig. 2 has an area of 2.0 m2 and is a Fresnel-type parabolic mirror composed of a central parabolic mirror and 11 ring-shaped sections. These sections are distributed across 6 hexagonal segments equivalent in size and surrounding the central segment, which all focus a parallel beam to a single focal point. Thus the mirror, which has a focal length of 1.5 m, consists of 7 hexagonal segments, each with a diagonal of 63 cm (Fig. 3, left). These segments consist of carbon plastic strengthened by a honeycomb aluminium plate (Fig. 3, right). The mirror construction remains stable over a wide range of temperatures. In this design, the thickness of the segments is small (1 cm), which is important for implementation of the mirror on the satellite frame. The segments were manufactured as plastic replicas of an aluminium mold (one for the central segment and one for each of the 6 lateral segments).
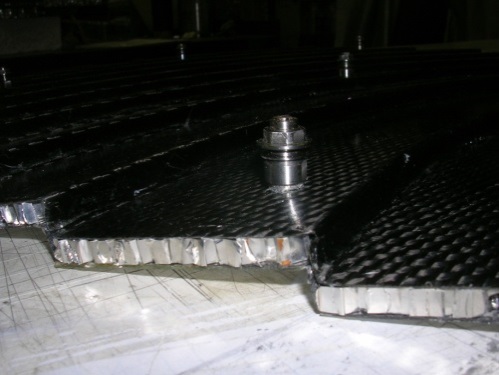
The plastic mirror surface is covered by an aluminium film and protected by a MgF2 coat deposited through a vacuum evaporation process. Its reflectivity at a wavelength of 350 nm (average for atmosphere fluorescence) is 85%. The mirror passed various space qualification and optical tests, which demonstrated the stability of its optical quality in space conditions. The expected life time of the mirror exceeds 3 years.
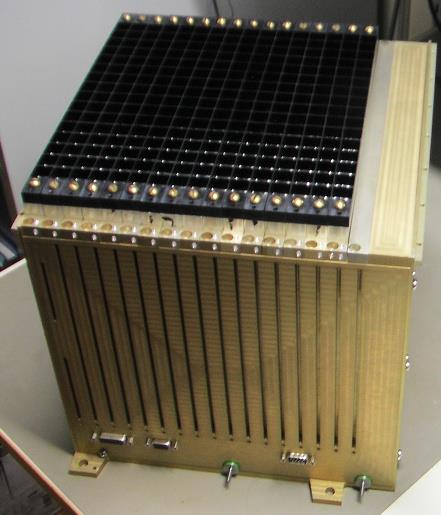
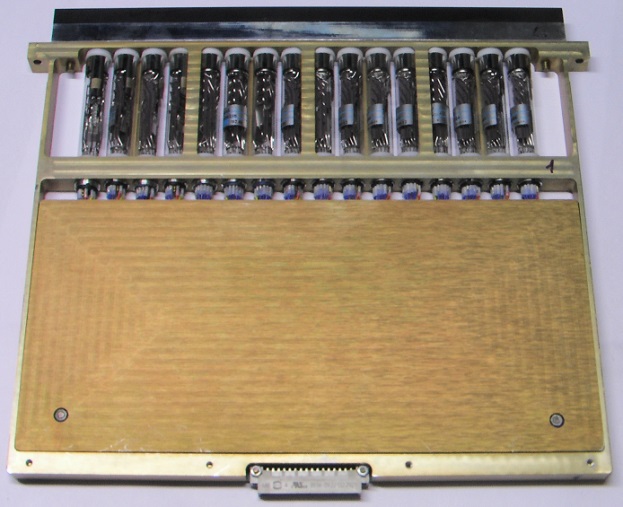
The TUS photodetector is a composite of 256 channels (pixels) positioned at the focal point (Fig. 4). The pixels themselves are Hamamatsu R1463 photomultiplier tubes (PMTs) with a 13 mm diameter multialkali cathode. Its quantum efficiency is about 20% for the 350 nm wavelength. The multialkali cathode was chosen in place of the bialkali unit traditionally used in ground-based fluorescence detectors because of its linear performance over a wider range of temperatures. Special light guides with square entrance apertures () and circular outputs were employed to uniformly fill the detector’s field of view with PMT pixels. Sixteen PMTs are combined into an individual cluster (photodetector module), and each of the 16 clusters of the photodetector has its own digital data processing system for the first-level trigger, based on a Xilinx FPGA as well as a high-voltage power supply controlled by the FPGA to adjust the PMT gain to the intensity of UV radiation. One of the clusters is shown in the right panel of Fig. 4.
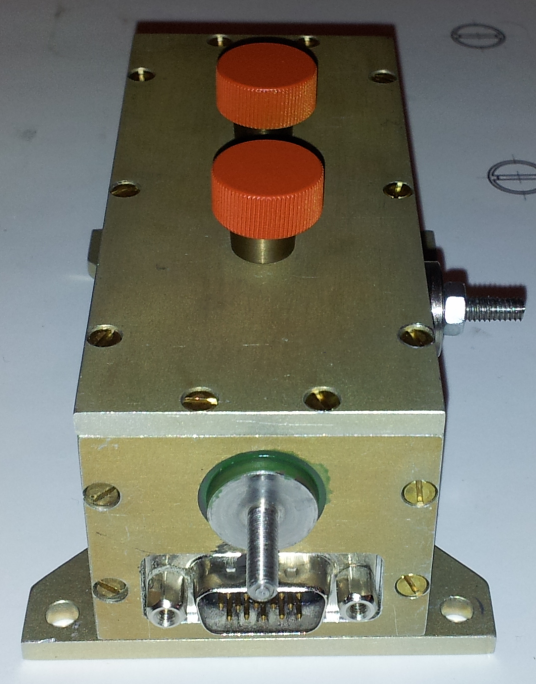
In parallel to the photodetector measurements, the intensity of light coming from the Earth is measured by the Solar Light Sensor (SLS), which is placed on the frame next to the mirror surface and pointed toward the nadir. The SLS consists of two sensitive photodiodes and electronics (Fig. 5), and its information is sent to the satellite Information Unit once per second. The Information Unit issues a command to the PDMS to move the photodetector out of the mirror’s focus in case of a dangerous increase in light intensity resulting from direct sunlight.
2.1 Digital electronics algorithms
The TUS detector was designed as a multifunctional orbital set-up that permits the acquisition of data from various fast (transient) optical phenomena in the atmosphere. As stated above, the chief focus of these observations is on EECRs, but TUS is also designed to measure lightning flashes, transient luminous events (TLEs), and micro-meteors. A characteristic feature of TLEs is a transient light signal with a duration that ranges from 1 ms (elves), to dozens of ms (sprites, gigantic blue jets), to hundreds of ms (blue jets), see Pasko et al. (2011). The duration of meteor events is in the range of 0.1–1 s. TLEs and lightning flashes have a significant signal in UV as measured recently by a number of satellites launched by Lomonosov Moscow State University, and described in the final section of this paper.
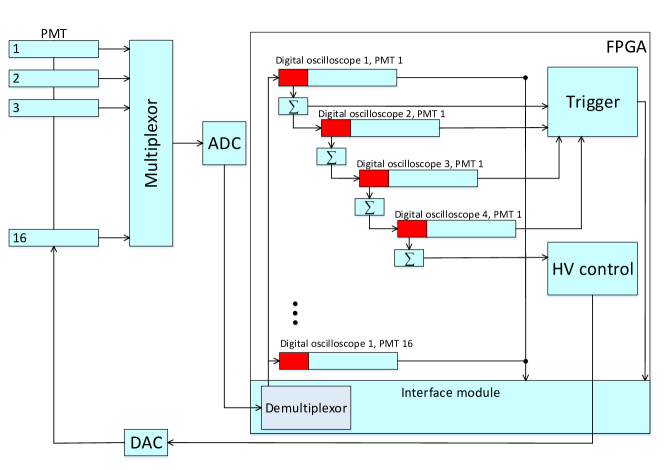
To measure the varying time frames of the different classes of TLEs, the photodetector electronics algorithm is implemented as a number of parallel processes: a system of waveform measurements at different time scales, a two-level triggering system, and a gain control which adjusts the sensitivity of the PMT to the UV background. All these processes are implemented on two sets of boards: 16 photodetector module (PDM) boards, each with 16 PMTs, and the central processor board (CPB), which gathers information from all the modules and controls their operation.
The sequence of waveforms is formed by the PDM boards and provides four types of data (digital oscillograms, DOs) as an output: DO EAS, TLE-1, TLE-2 and METEOR, which correspond to the duration of three distinct physical processes in the atmosphere: extensive air showers, transient luminous events, and micro-meteors respectively. Since duration of TLEs varies from 1 ms to hundreds of milliseconds, two different waveforms are provided for their measurement. A fast ADC converts analogue signals of the PMTs to digital with a time sampling s, which coincides with the time sampling of the fastest oscillogram (DO EAS). For slower waveforms, a system of digital adders is provided (Fig. 6):
where is a digitized signal of each channel. The duration of adding has been chosen basing on the characteristic duration of physical processes apparent in the FOV of a single pixel (see Table 2). The duration of all oscillograms is set to 256 time samples.
The first level of the event selection algorithm, a simple threshold trigger based on a comparison of the signal with a preset level, is implemented by the individual PDM boards. The signal is integrated preliminarily over a specified time corresponding to a characteristic interval set for the development of a phenomenon within a pixel FOV. In the event of a “horizontal” EAS, the time of an EAS movement across a single pixel is about s, and an integration time of s was chosen. Integration times for other waveforms are given in Table 2. The preset threshold level for all waveforms can be changed by a dedicated command from the flight control centre.
| Digital Oscillogram | DO sampling time | DO length | TS integration time |
|---|---|---|---|
| EAS | s | s | s |
| TLE-1 | s | ms | ms |
| TLE-2 | ms | ms | ms |
| METEOR | ms | s | ms |
To decrease the false trigger rate resulting from background fluctuations, a second trigger level was developed: a pixel mapping trigger implemented in the CPB, which acts as a contiguity trigger. This procedure selects cases of sequential triggering of spatially contiguous pixels (channels) that are also adjacent in time, allowing for the selection of events with different spatial-temporal patterns. An additional parameter important for this trigger is the so-called adjacency length, i.e., the number of neighbouring channels () sequentially activated by a signal from a given event. The preset value of can be changed by a special command during the flight. All data (four types of waveforms) are permanently stored in the BRAM of every PDM FPGA. The PDMs wait for a trigger command from the TUS CPB FPGA before sending this information to the memory of the CPB, which, in turn, relays the triggered oscillograms (the data of all 256 pixels over 256 time intervals) along with high voltage and time data to the Information Unit via the CAN bus interface. One frame of data (one event) is expected to be about 100 Kbytes, and the limit of TUS data determined by a dedicated Information Unit memory is about 250 Mbytes/day.
UV radiation measurements are performed in the DC mode, and the signal is integrated in the anode RC-chain of each PMT, with the time constant set to 600 ns. Measurements of UV intensity allow adjusting the PMT gain control via the high voltage (HV) control system to avoid saturation of the PMTs under conditions of increased UV intensity, such as during moonlit nights or transits across regions of greater UV emissions (auroral regions, large cities, etc.). Two algorithms are implemented in the PDM FPGA to tune the HV and thus solve the problem: (i) the base level of the ADC code is kept constant, or (ii) the first level trigger rate is calculated and kept constant. The second algorithm allows a larger dynamic range, while the first is more reliable in the event of errors or high trigger rates caused by defective PMTs. The HV is controlled by the output voltage level of a dedicated DAC (see Fig. 6.), and HV correction occurs once every 100 ms to ensure a constant voltage during EAS and TLE oscillogram output. During a METEOR oscillogram, the HV is adjustable up to 16 times.
2.2 Photodetector tests
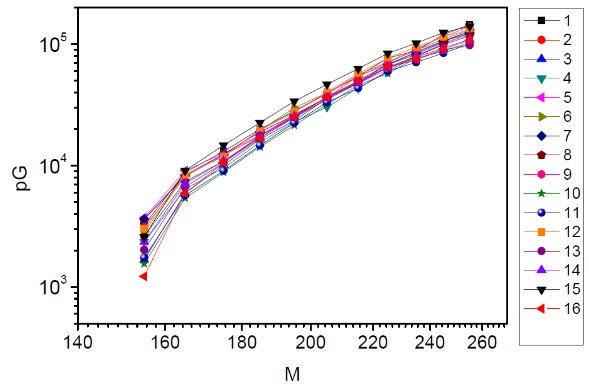
The first qualification test of a Hamamatsu R1463 PMT was performed with the same hardware and software complex (test bench) that had been utilized successfully on a previous occasion by the Joint Institute for Nuclear Research (JINR, Dubna) in testing PMTs for the LHC’s ATLAS Tile Calorimeter. After the test, PMTs with nearly equal gain were grouped into 16 tube clusters (modules). It is important to note that the 16 PMTs of each separate module have a common HV power supply, and their gain was equalized by adjusting the resistors of the individual tubes’ voltage dividers. PMTs within a single module were adjusted to have identical gain across the entire range of the HV control for local night times (DAC codes 160–250). Tests with a reference light source were performed after adjusting the PMTs across the entire range of HV variation. The results of these tests on one of the PMT clusters are presented in Fig. 7. Note that the characteristics of all the PMTs within this cluster drew closer to each other as a result of their adjustment.
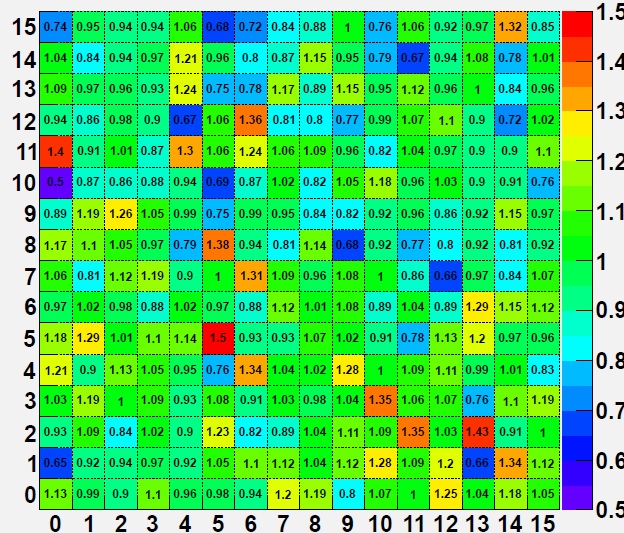
During space operation, each of the 256 PMTs measures the background intensity of atmospheric UV. For an average background, distribution of pixel signals in the photodetector is determined by the distribution of pixel gains. A map of 256 pixel signals related to the standard signal from a UV source was measured before launch and presented in Fig. 8. Note that there is still a large difference in the sensitivity of specific PMTs in different modules. The obtained deviation from the reference signal was not satisfactory for selecting an EAS because a few pixels with a high gain could produce a major portion of selected events. To reduce the width of the gain distribution, signals from the reference source were corrected digitally and then sent to the trigger system.
The TUS photodetector successfully passed autonomous thermal vacuum tests at Skobeltsyn Institute of Nuclear Physics of Lomonosov Moscow State University as well as a series of complex tests in a vacuum chamber at VNIIEM Corporation (JSC).
2.3 TUS performance
Performance of the TUS detector was simulated by Grinyuk et al. (2013) with the ESAF software framework (Fenu et al., 2011), taking into account parameters of the real TUS mirror-concentrator and TUS electronics.
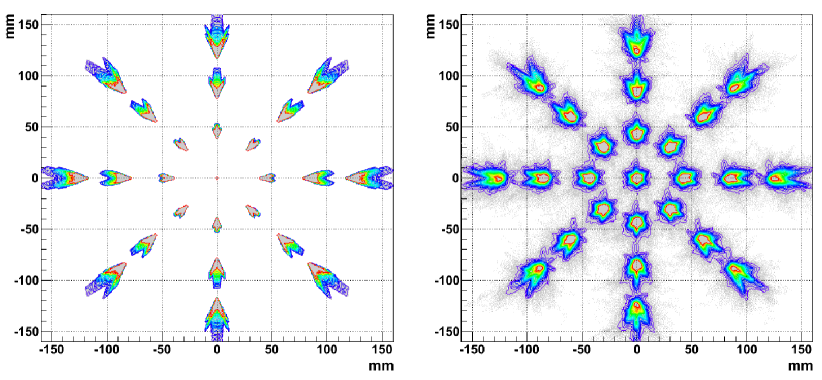
The focusing of the mirror-concentrator was checked through experimental measurements of the mirror point spread function (PSF). However experimental PSF determinations differ from the PSF of an “ideal” mirror, which is free of the technological defects that appear during the production of the actual mirror. In Fig. 9, results of the real mirror PSF measurement (right panel) are compared with the PSF of the “ideal” mirror (left panel). In the real measurements, the light beam was tested at 8 different azimuthal and four polar angles , , , . As indicated in Fig. 9, the real mirror PSF differs from the ideal point value even at small polar angles. Nevertheless, for a diameter field of view, the PSF is compatible with the TUS pixel size.
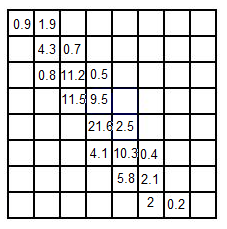
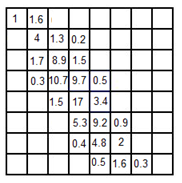
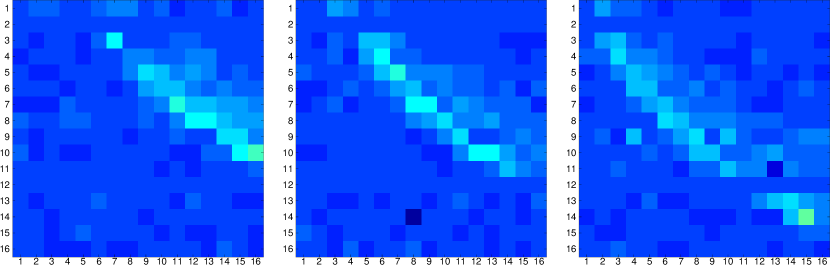
EAS signals in photodetector pixels (fluorescence photon numbers) were calculated for the real and ideal mirrors. Typical signals are presented in Fig. 10, which shows the percentage of photons received by the mirrors and distributed over pixels for an EAS with a zenith angle of . The photon distributions along the EAS cascade curve for the ideal and real mirrors show little difference, which confirms the high quality of the TUS mirror.
To estimate the efficiency of the TUS trigger system and the accuracy of measuring EAS parameters, EAS pixel signals must be compared with the level of background noise in the same pixels. Data on the UV background of the atmosphere were obtained in measurements on board the Tatiana and Vernov satellites (Sadovnichy et al., 2011, Vedenkin et al., 2011, Garipov et al., 2013). The average background level of UV noise over the night side of the Earth on moonless nights was found to be photon cm-2 sr-1 s-1. The lowest background signal on moonless nights is around (above the South Pacific, deserts such as the Sahara, and a part of Siberia). The highest level determined for full moon reached . The expected value of the pixel noise level was calculated from these experimental data, and the background photon counts for the three values of background intensities are presented in Table 3. In measurements of EAS pixel signals over the time interval , the standard deviation (square root of values multiplied by ) is utilized to simulate noise.
| , photon cm-2 sr-1 s-1 | |||
| , photons s-1 | 36 | 120 | 1200 |
Numerical calculations of EAS signals in pixels were compared with the pixel noise to simulate extensive air showers of various primary energies and zenith angles. The following TUS parameters were used: a 2.0 m2 mirror area; a solid angle for a single pixel equal to sr; and a detector system optical efficiency equal to 0.6 (including a mirror reflection coefficient of 0.85 and an efficiency of collecting photons from the whole mirror to one pixel). The ratio of various EAS signals to noise for exposures of s duration are presented in Table 4.
| Energy, EeV | |||||
|---|---|---|---|---|---|
| 100 | 2.2 | 2.4 | 2.7 | 3.0 | 3.4 |
| 150 | 3.3 | 3.6 | 4.0 | 4.5 | 5.1 |
| 200 | 4.4 | 4.8 | 5.4 | 6.0 | 6.8 |
| 300 | 6.6 | 7.3 | 8.1 | 9.1 | 10.2 |
Results of numerical calculations indicated that the trigger system described above will collect EAS with signals above 3–4 sigmas of noise, which corresponds to primary energies of about 100–150 EeV for air showers with zenith angles – registered in the central part of the detector FOV. For events at the edge of FOV, the efficiency of the trigger system is lower, and the energy threshold increases to around 150–200 EeV.
3 Present data on background effects in measuring EECRs from space
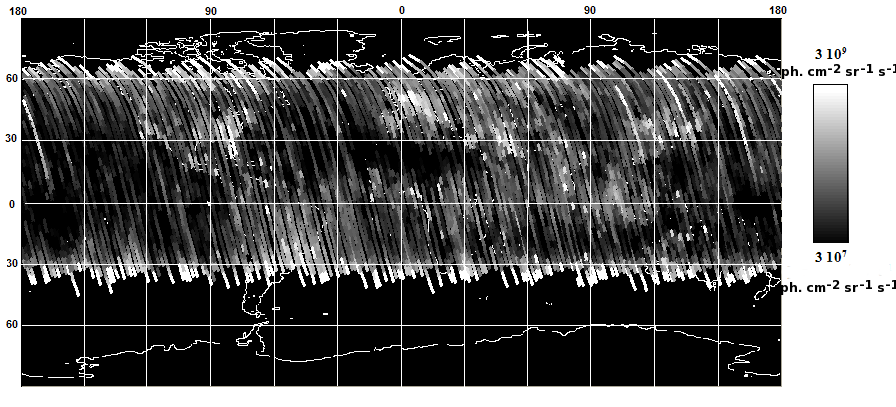
As stated above, a direct background effect encountered during nighttime measurements of fluorescent EAS tracks from space is a luminescence of the nocturnal atmosphere. Experimental results of measurements of this atmospheric luminescence or “airglow” were obtained by the Tatiana-2 satellite (Vedenkin et al., 2011). The data obtained on moonless nights during the winter of 2009–2010 over the Earth’s nightside for latitudes between S and N are given in Fig. 11. The intensity of the atmospheric glow varies over a wide range of – photon cm-2 sr-1 s-1. It is well known that this atmospheric glow originates in a comparatively narrow layer of the upper atmosphere (lower ionosphere) at heights of 80–100 km. An orbital fluorescence detector directed to the nadir detects the atmospheric glow practically without absorption by the higher layers of the atmosphere. Ground-based EAS detectors are not able to detect the glow originating at altitudes in the 80–100 km range because of its strong absorption by the atmosphere at lower altitudes. For an orbital observation, the detection of these upper atmospheric emissions increases up to photon cm-2 sr-1 s-1 in some places.
Taking into account the data on the atmospheric glow, the exposure of TUS with an FOV of was estimated by Klimov (2009). The efficiency of an EECR event selection is close to 100% for energies EeV and those events will be collected with the total exposure of 12000 km2 sr yr throughout 3 years of in-orbit operation. Events with energies –300 EeV will be detected with less efficiency (exposure). This means that for the steep energy spectrum of EECRs above the GZK limit (the integral spectrum exponent for energies EeV), events with energies 70–300 EeV will be selected and measured over the darkest regions of the Earth: above the Pacific ocean, deserts, and a part of Siberia (Fig. 12). With such limited exposure, the TUS detector will not be able to make a breakthrough with regard to the problem of EECR origins. Nevertheless, the principal aim of the TUS mission is to test the performance of an orbital EAS fluorescence detector in a space environment.
The TUS detector will also operate above intensive sources of background glow during the flight: auroral events, city lights and other sporadic lights of uncertain origin. Experimental results of the Tatiana and Tatiana-2 satellites have demonstrated that these higher intensity glow sources are limited in area and do not strongly affect detector exposure. Another source of background glow in orbital EECR measurements are short UV flashes (durations of 1–100 ms), the origin of which is related to electrical discharges in the atmosphere. The latest results regarding their intensity and distribution were obtained with the Tatiana-2 satellite (Garipov et al., 2013) and the Vernov experiment (Panasyuk et al., 2016). The UV detector of these satellites operated in conditions close to those of an orbital EECR detector, measuring the temporal structure of flashes over atmospheric regions of thousands km2, while oriented toward the nadir. Measurements were performed for a wide range of photon counts per atmospheric UV flash event: from up to , where tens of events were registered. The main features of flashes with are their duration of 10–100 ms and the concentration of their global distribution in the equatorial region over the continents. This suggests that such phenomena are either lightning flashes or transient luminous events generically related to lightning. These ”bright” flashes will be easily distinguished from EAS fluorescent signals due to their long duration and enormous photon counts (to compare, EAS events have durations of less than 0.1 ms and UV photon counts of for EeV).
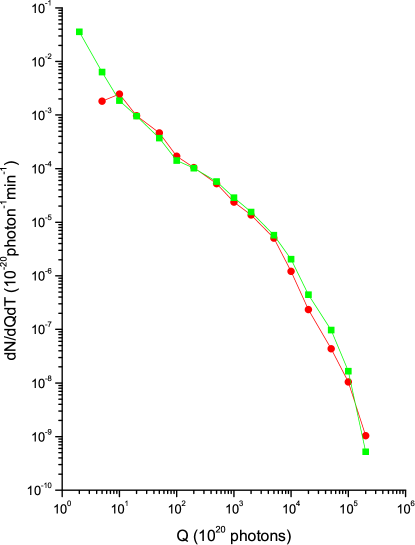
More likely to resemble EECR events are the dim, short flashes (–, duration ms) observed by the Tatiana-2 (Garipov et al., 2013) and Vernov (Panasyuk et al., 2016) satellites. The flash event distribution over the number of photons is presented in Fig. 12. One can see that dim events with small photon counts () constitute a considerable portion of all events, and that the global distributions of dim and bright flashes measured by Garipov et al. (2013) were found to differ, see Fig. 13.
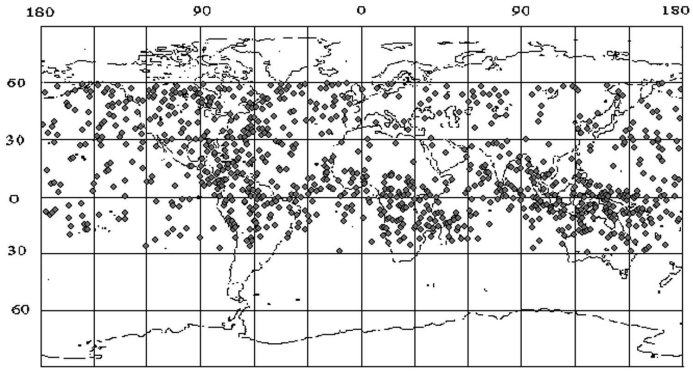
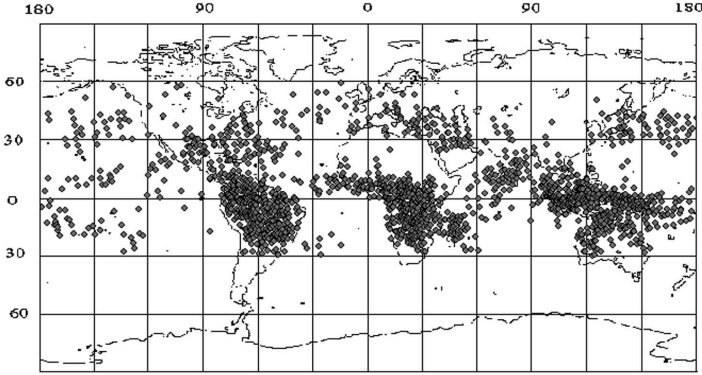
Bright flashes are concentrated in the equatorial region above continents, which is consistent with an origination in lightning activity. Their rate in this region is of the order of km-2 hr-1. Dim flashes are distributed more uniformly with a rate of km-2 hr-1. The rates of both types of flashes are much higher than the expected EECR events rates of km-2 hr-1.
The above numbers show the similarity of EECR events to slower atmospheric flashes, especially during the onset of these slower events. The TUS mission will provide important data for a better understanding of these atmospheric background effects.
4 Data on Transient Atmosphere Events expected from the TUS detector
The TUS detector has a number of advantages over previous detectors of transient atmosphere events (TAEs) on board the Tatiana, Tatiana-2 and Vernov satellites:
-
•
a large aperture (area of the mirror-concentrator m2) for detecting TAE fluorescence in the UV band;
-
•
the capacity to measure UV images of TAEs in the 256 pixel photodetector with a resolution of 5 km within a field of view of 80 km80 km in the atmosphere;
-
•
the capacity to measure variation of images in time with the digital oscilloscope at four different time scales (see Table 2);
-
•
the capacity to select TAEs on four independent time scales.
With these advantages, the TUS detector will be able to obtain new data on TAEs.
-
1.
The first result expected from the larger aperture of TUS will be an increase in the detection rate of TAEs with low photon counts (down to ), which is three orders of magnitude below the threshold value for the Vernov experiment (Fig. 12).
-
2.
The distinction of different TAE types will be improved considerably by the imaging and timing of events over expanded space and time scales.
-
3.
It will be interesting to evaluate the possibility of EASs as initiators of TAEs, as conjectured by Gurevich and Zybin (2001), through observation of the early stages of TAEs. An EAS developing in tens of microseconds might initiate a subsequent TAE with a duration of tens of milliseconds.
-
4.
The TUS will detect events repeating on scales ranging from milliseconds up to seconds, filling the gap in the data of the previous satellite experiments.
-
5.
Images of TAEs will be also useful in distinguishing upper atmosphere events from precipitating electron events initiated by a lightning flashes (see Voss et al., 1998). An image of a precipitating electron event is expected to be wider than images of sprites and will lack the ring shape characteristic of elves.
5 Results of first measurements
The EAS mode of operation was mostly employed during the first months of work in orbit. More than 20 thousand of various events at night parts of orbits were measured from May till November 2016. They differ in spatial dynamics and temporal structure of waveforms.
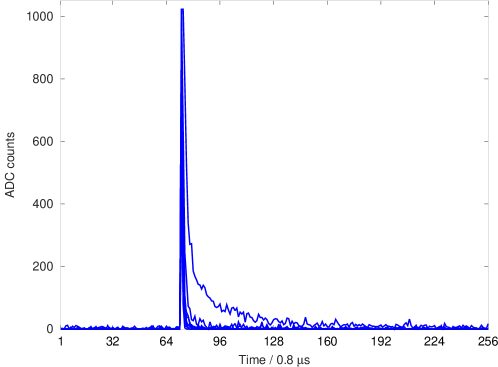
The first registered phenomena that were unexpected are instant and as a rule intensive flashes that produce linear tracks in the focal surface. An example is shown in Fig. 14. One can see a flash that occurs during one time frame simultaneously in a group of PMTs lined up in a track. Preliminary simulations performed with the Geant4 framework revealed that such events can be caused by a charged particle penetrating through the glass filter in front of PMT and producing a significant amount of fluorescent and Cherenkov light (Klimov et al., 2017).
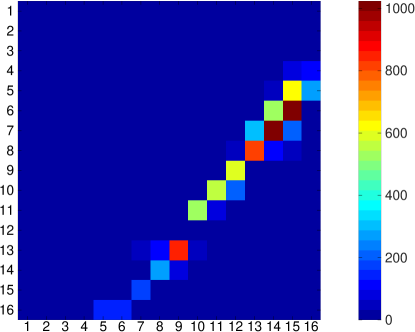
Another impressive example of the measurements is registration of events with complicated spatial and temporal dynamics. An example is shown in Fig. 15. The event was registered on December 12, 2016, near Australia. An arc-like shape of the track made by the brightest PMTs and the speed of development support the hypothesis that this was an elve, which represent the most common type of TLEs.
6 Conclusion
The TUS orbital detector is the first EECR fluorescence telescope looking down on the earth from on board a satellite. Its aim is to determine the signal-to-noise ratio for such apparatus, and the results of its measurements will be used in preparing large-scale space EECR detectors such as the KLYPVE and JEM-EUSO.
The fluorescence TUS detector will also give unique data on low intensity transient atmosphere events and transient luminous events caused by electric charges, meteoroids, and dust grains.
Acknowledgements
The work was partially supported by ROSCOSMOS grants and by RFFI grants No. 16-29-13065 and No. 15-35-21038. I.H. Park was supported by the National Research Foundation grant funded by MSIP of Korea (No. 2015R1A2A1A01006870).
References
-
Abraham, J., Abreu P., Aglietta M. et al. (Pierre Auger Collaboration), Trigger and Aperture of the Surface Detector Array of the Pierre Auger Observatory. Nucl. Instrum. Methods A 613, 29–39 (2010).
-
Abrashkin, V., V. Alexandrov, Y. Arakcheev et al., Space detector TUS for extreme energy cosmic ray study. Nuclear Physics B - Proceedings Supplements, 166(0), 68-71 (2007).
-
Aleksandrov V.V., D.I. Bugrov, G.K. Garipov et al., A project of investigating the most energetic cosmic rays on the Russian segment of the International Space Station. Moscow University Physics Bulletin. 55 (6), 44 (2000).
-
Benson, R. and Linsley, J., Satellite observation of cosmic ray air showers, In International Cosmic Ray Conference, 17th, Paris, France, July 13–25, Conference Papers, 8 (1981).
-
Fenu F., T. Mernik, A. Santangelo et al. ICRC-32 (Beijing) (2011).
-
Garipov G.K., L.A. Gorshkov, B.A. Khrenov et al, AIP Conference Proceedings. 433, 403–417 (1998).
-
Garipov G.K., B.A. Khrenov, P.A. Klimov et al., Global transients in ultraviolet and red-infrared ranges from data of Universitetsky-Tatiana-2 satellite. J. Geophys. Res., 118 (2), 370–379 (2013).
-
Grinyuk A.A., A.V. Tkachenko, L.G. Tkachev, TUS Collaboration. The TUS orbital detector optical system and trigger simulation. Journal of Physics: Conference Series, 409, Issue 1, article id. 012105 (2013).
-
Gurevich A.V., K.P. Zybin, Runaway breakdown and electric discharges in thunderstorms. PHYS-USP, 44 (11), 1119–1140 (2001).
-
Khrenov B.A., M.I. Panasyuk, V.V. Alexandrov et al., Space Program KOSMOTEPETL (Projects KLYPVE and TUS) for the Study of Extremely High Energy Cosmic Rays. AIP Conf. Proc. 566, 57 (2001).
-
Khrenov B.A., V.P. Stulov, Detection of meteors and sub-relativistic dust grains by the fluorescence detectors of ultra high energy cosmic rays. Advances in Space Research, 37 (10), 1868–1875 (2006).
-
Krizmanic J.F., J.W. Mitchell, R.S. Streitmatter for the OWL Collaboration, Optimization of the Orbiting Wide-angle Light Collectors (OWL) Mission for Charged-Particle and Neutrino Astronomy, Proc. 33rd ICRC, Rio de Janeiro, Brazil, paper No. 1085 (2013).
-
Klimov P.A. PhD Thesis, SINP MSU (2009) (in Russian).
-
Klimov P.A., Zotov M.Yu., Chirskaya N.P. et al., Preliminary results from the TUS ultra-high energy cosmic ray orbital telescope: Registration of low-energy particles passing through the photodetector. Bulletin of the Russian Academy of Sciences: Physics, 81 (4), 407–409, (2017).
-
Morozenko V.S. PhD Thesis, SINP MSU (2014) (in Russian).
-
Panasyuk M.I., M. Casolino M., G.K. Garipov et al., The current status of orbital experiments for UHECR studies, J. Phys. Conf. Series, 632 (1), 012097 (2015).
-
Panasyuk M.I., S.I. Svertilov, V.V. Bogomolov et al., RELEC mission: Relativistic electron precipitation and TLE study on-board small spacecraft. Advances in Space Research, 57 (3), 835–849 (2016).
-
Pasko V.P., Y. Yoav, K. Cheng-Ling, Lightning Related Transient Luminous Events at High Altitude in the Earth’s Atmosphere: Phenomenology, Mechanisms and Effects. Space Sci. Rev. 168 (1), 475–516 (2012).
-
Sadovnichy V.A., M.I. Panasyuk, I.V. Yashin et. al., Investigations of the space environment aboard the Universitetsky-Tat’yana and Universitetsky-Tat’yana-2 microsatellites. Solar System Research, 45 (1), 3–29 (2011).
-
Scarsi L. Extreme Universe Space Observatory (EUSO). Proc. First Airwatch Symposium, Catania; AIP CP, 433, 42 (1997).
-
Stecker F.W., J.F. Krizmanic, L.M. Barbier et al., Observing the Ultrahigh Energy Universe with OWL Eyes, Nucl. Phys. B (Proc. Supp.), 136, 433–438 (2004).
-
Takahashi Y. and The JEM-EUSO Collaboration, The JEM-EUSO mission, New Journal of Physics, 11, 065009 (2009).
-
Vedenkin N.N., G.K. Garipov, P.A. Klimov et al., Atmospheric ultraviolet and red-infrared flashes from Universitetsky-Tatiana-2 satellite data. Journal of Experimental and Theoretical Physics, 113 (5), 781–790 (2011).
-
Voss H.D., M. Walt, W. L. Imhof, J. Mobilia, U.S. Inan, Satellite observations of lightning-induced electron precipitation. J. Geophys. Res. 103 (A6.), 11725 (1998).