ALMA observations of N83C in the early stage of star formation in the Small Magellanic Cloud
Abstract
We have performed Atacama Large Millimeter/submillimeter Array (ALMA) observations in 12CO(), 13CO(), C18O(), 12CO(), 13CO(), and CS() lines toward the active star-forming region N83C in the Small Magellanic Cloud (SMC), whose metallicity is about one-fifth of the Milky Way (MW). The ALMA observations first reveal subparsec-scale molecular structures in 12CO() and 13CO() emissions. We found strong CO peaks associated with young stellar objects (YSOs) identified by the , and we also found that overall molecular gas is distributed along the edge of the neighboring H ii region. We derived a gas density of cm-3 in molecular clouds associated with YSOs based on the virial mass estimated from the 12CO() emission. This high gas density is presumably due to the effect of the H ii region under the low-metallicity (and accordingly small-dust content) environment in the SMC; far-UV radiation from the H ii region can easily penetrate and photodissociate the outer layer of 12CO molecules in the molecular clouds, and thus only the innermost parts of the molecular clouds are observed even in 12CO emission. We obtained the CO-to-H2 conversion factor of cm-2 (K km s-1)-1 in N83C based on virial masses and CO luminosities, and it is four times larger than that in the MW, 2 cm-2 (K km s-1)-1. We also discuss the difference in the nature between two high-mass YSOs, each of which is associated with a molecular clump with a mass of about a few .
1 Introduction
Metallicity in the interstellar medium is one of the key parameters to control star-formation processes and molecular gas properties. In particular, an environment with low metallicity (and accordingly small-dust content) is important because it causes a reduction of the shielding against far-UV radiation from massive stars, which affects the formation, structure, and physical properties of giant molecular clouds (GMCs) as well as the star-formation process.
The Small Magellanic Cloud (SMC), which is classified as a dwarf irregular galaxy, is an ideal target to investigate molecular gas structures and star-formation processes under an environment with low metallicity and small-dust content because its metallicity is about one-fifth of the Sun (Dufour 1984; Kurt et al. 1999; Pagel 2003) and the dust-to-gas ratio is 17 times smaller than that in the Milky Way (MW; Koornneef (1984). In addition, its proximity ( 60 kpc; Hilditch et al. 2005) enables us to perform high-spatial-resolution observations even at millimeter to submillimeter wavelengths.
Molecular clouds in the SMC have been observed in the 12CO(), 13CO(), 12CO(), and 13CO() lines using the Swedish-ESO Submillimeter Telescope at angular resolutions of 45′′ ( 13 pc) for CO() and 23′′ ( 7 pc) for CO(), and intensity ratios among these molecular lines have been examined by many authors (e.g., Israel et al. 1993; Rubio et al. 1993; Lequeux et al. 1994; Rubio et al. 1996; Israel et al. 2003). In addition, Mizuno et al. (2001) observed the SMC in the 12CO() line at an angular resolution of .’ using the NANTEN telescope, and they identified 21 GMCs whose masses are to . They found a good spatial correlation between the GMCs and H ii regions or young clusters, indicating that cluster formation is ongoing in these GMCs.
Here, we focus on the N83 region, which is located in the southeast wing of the SMC and is an isolated, yet relatively active star-forming region. The H ii region contains the stellar association NGC456 and a possible supernova remnant (Haberl et al., 2000). Molecular gas delineates the edge of the H ii region (Bolatto et al., 2003), and this indicates that the molecular cloud may be formed or compressed by the expanding shell. In addition, warm ( 40 K) molecular gas exists in N83 that might be heated by the neighboring H ii region (Bolatto et al. 2003; Bolatto et al. 2005). The CO-to-H2 conversion factor () in N83 was estimated to be () cm-2 (K km s-1)-1 (Bolatto et al., 2003).
In particular, Bolatto et al. (2003) found that the south clump N83C shows the most intense CO() emission in the N83 region, and its is lower than that in other regions of N83. They argued that decreases and reaches nearly Galactic values in CO-bright regions such as N83C (see also Glover & Clark 2012). However, these observations could not fully resolve molecular clouds (e.g., Israel et al. 2003), and thus smaller structures such as cores and filaments may exist. For such unresolved clouds, one cannot reveal the detailed evolutionary processes of molecular clouds associated with young stellar objects (YSOs). In addition, the estimated might be uncertain, due to the uncertainties of the cloud geometry and the resultant virial mass. In order to resolve smaller molecular structures and to obtain more accurate values in the SMC, further observations with higher angular resolution are indispensable.
In this paper, we present the results of Atacama Large Millimeter/submillimeter Array (ALMA) observations toward N83C. Firstly, we reveal the distribution of molecular gas associated with YSOs based on the high-angular-resolution maps with ALMA. Then, we derive various properties of molecular clouds: virial mass, average gas density, kinetic temperature, and . Finally, we comprehensively discuss molecular gas properties and their relation to star formation in N83C.
2 Observations
ALMA Cycle 2 observations toward N83C were carried out in Band 6 (211 – 275 GHz) and Band 7 (275 – 373 GHz) with the main array 12 m antennas, the Atacama Compact Array (ACA) 7 m antennas, and total power (TP) 12 m antennas between 2014 May and 2015 September.
The observations were centered on (, ) = (, ). The target molecular lines are 12CO(), 13CO(), and C18O() in Band 6, and 12CO(), 13CO(), and CS() in Band 7 with a bandwidth of 117.19 MHz (30.5 kHz 3840 channels). Note that we used a spectral window for the observations of the continuum emission with a bandwidth of 1875.0 MHz (488.3 kHz 3840 channels) in Band 6. The maximum baseline of the 12 m array is 348.5 m and that of ACA is 48.9 m.
The data were reduced using the Common Astronomy Software Application (CASA) package. We applied natural weighting for both Band 6 and Band 7 data, which provided synthesized beam sizes of 172 137 (0.50 pc 0.40 pc at 60 kpc) and 464 433 (1.35 pc 1.23 pc), respectively. Note that we only used ACA and TP data in Band 7 because we could not obtain the main-array data, and thus its beam size is larger than that in Band 6. The rms noise levels of molecular lines at the velocity resolution of 0.2 km s-1 are 17 mJy beam-1 in Band 6 and 148 mJy beam-1 in Band 7, respectively.
3 Results and Analyses
3.1 Maps
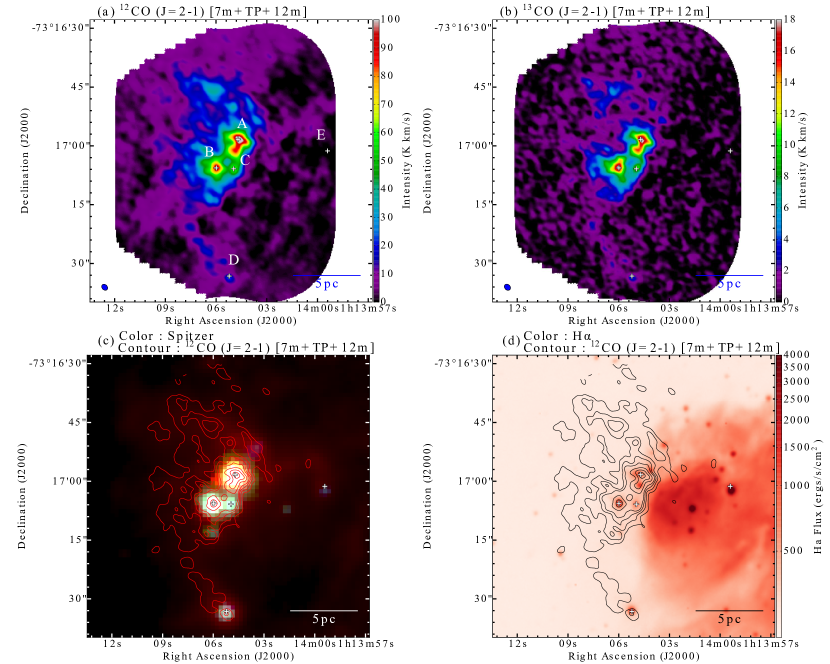
Figures 1(a) and (b) show integrated intensity maps in 12CO() and 13CO() emission of N83C. The global distribution of 12CO() emission is quite similar to that of 13CO() emission. Strong peaks of CO emission correspond to the position of bright YSOs111We assigned the source ID to each YSO in alphabetical order according to the 12CO() peak temperature (see Table 1). (A and B), identified based on the data (see also Figure 1(c)). Thus these YSOs are born within such CO-bright molecular clouds. We can see faint local peaks at sources C and D, but no CO emission is found at the source E. Figure 1(d) shows that local peaks of H emission are associated with all of the sources, A to E. This implies that all of the YSOs are beginning to ionize the surrounding molecular gas. Overall molecular gas is distributed along the edge of the H ii region.
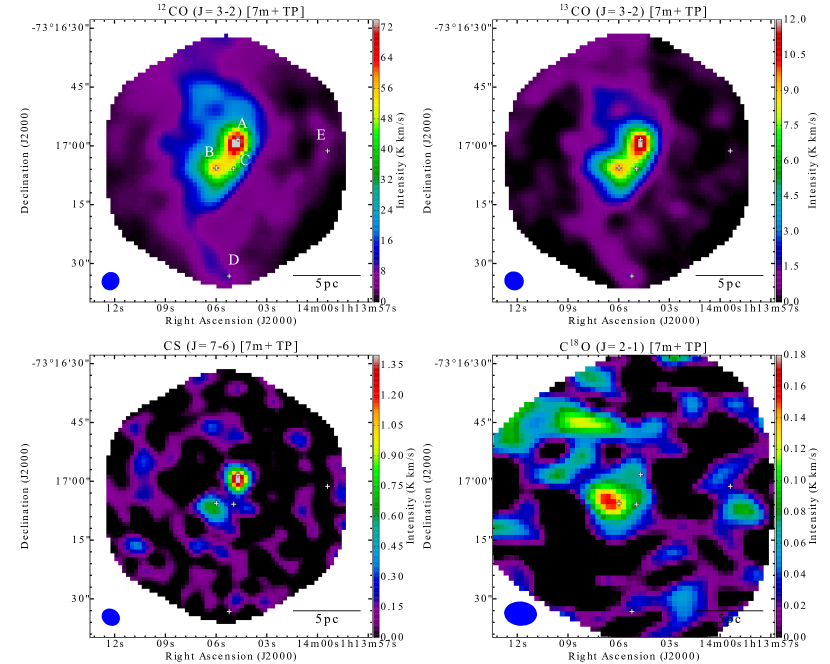
In Figures 2(a) and (b), we found a similar trend in the transition as in the transition (Figures 1(a) and (b)); that is, the global distributions of 12CO() and 13CO() are quite similar to each other, and strong peaks are observed at sources A and B in both CO emissions. Figures 2(c) and (d) show integrated intensity maps in the CS() and C18O()222We used only ACA and TP data but excluded main-array data for C18O() emissions because the main-array data degrade the resultant signal-to-noise ratio of the C18O() map. Therefore, its beam size (825 606) is larger than that of the 12CO() map (172 137). emission of N83C. Although both lines can trace dense cores in molecular clouds, we find different features in their respective maps. The CS() intensity is stronger in source A than in source B, whereas the C18O() peak is only observed at source B (see Section 4.2 in detail). The peak temperatures of each emission in sources A to E are summarized in Table 1.
We estimate the virial mass () of molecular clouds associated with sources A and B as follows (Solomon et al., 1987):
| (1) |
where is the radius of a molecular cloud in pc, and is the cloud velocity dispersion in km s-1. Here, was determined as the effective radius of the area whose CO intensity exceeds half the peak, and was calculated from the gaussian fitting of the CO line integrated over the area. Both and are determined from the 12CO() map and the 13CO() map individually, as shown in Table 2. The resultant values are .
Using the , we derive the average gas density in the molecular clumps as follows:
| (2) |
where is the mean molecular weight per H2 molecule (including the contribution by He), and is the atomic hydrogen mass. The estimated values are cm-3 (see Table 2).
3.2 Deriving gas density and kinetic temperature of molecular clouds
Here, we estimate gas density and kinetic temperature of molecular clouds using line ratios obtained from ALMA observations based on the Large Velocity Gradient (LVG) approximation (e.g., Goldreich & Kwan 1974; Scoville & Solomon 1974).
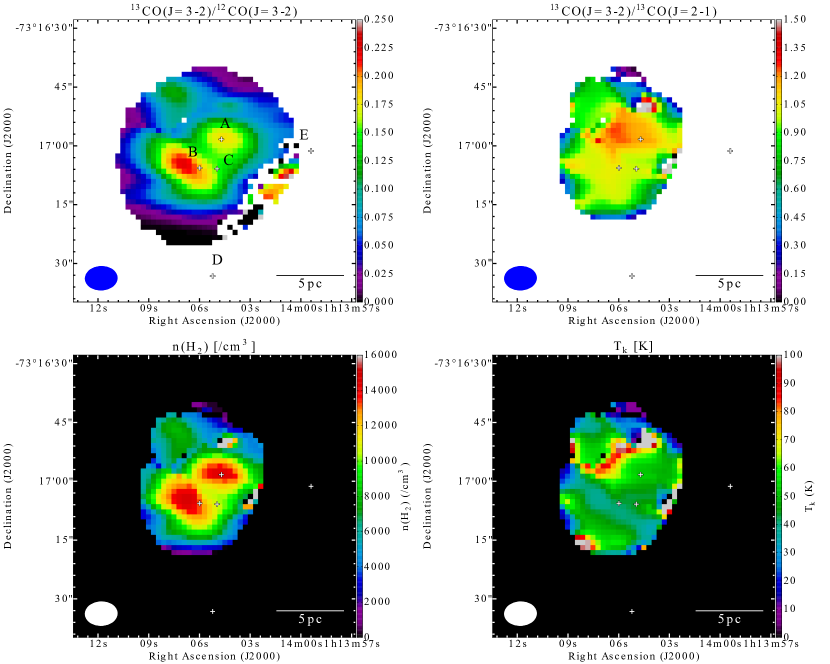
Firstly, we examined spatial distributions of 13CO()/12CO() and 13CO()/13CO() ratios as shown in Figures 3(a) and (b). We found local peaks corresponding to sources A and B in the 13CO()/12CO() ratio map, whereas such local peaks are not observed in the 13CO()/13CO() ratio map.
Then, we carried out the LVG calculation assuming the following input parameters: the molecular abundance (12CO) = [12CO]/[H2] of , the [12CO]/[13CO] abundance ratio of 50, and the velocity gradient of 2.0 km s-1 pc-1. The assumed (12CO) is based on that in the Large Magellanic Cloud (LMC); Mizuno et al. (2010) assumed (12CO) of in the LMC, whose metallicity is twice that in the SMC. Thus we assumed the twice smaller (12CO) of . The assumed [12CO]/[13CO] of 50 is the same as that in the LMC (Mizuno et al., 2010). The assumed of 2.0 km s-1 pc-1 is based on the size and the velocity dispersion of the molecular clump in source A (see Table 2).
Figures 3(c) and (d) show spatial distributions of molecular gas density and kinetic temperature, respectively. We found gas densities of cm-3 and kinetic temperatures of 30 – 50 K at sources A and B. The derived gas density based on the LVG calculation is consistent with that calculated from the virial mass. This implies that each molecular clump is gravitationally bounded. Note that we found a linear feature of high ( 90 K) from southeast to northwest in Figure 3(d). This is due to the breakdown of the one-zone model in the LVG approximation by the overlap of molecular gas with multiple velocity components.
4 Discussion
4.1 in the SMC
So far, in molecular clouds has been estimated mainly using virial masses and CO luminosities. It is reported that the standard value in the MW disk is 2 cm-2 (K km s-1)-1 (Bolatto et al. 2013 and references therein). However, may vary depending on the mass and the definition of molecular clouds; for example, smaller clouds tend to have higher , i.e., (Bolatto et al., 2013). Our ALMA observations spatially resolved molecular clumps associated with YSOs (sources A and B); each clump is an active site of star formation and is likely to have nearly a round shape. This indicates that each clump is likely to be gravitationally bounded, which is also estimated from the LVG analysis in Section 3.2, with nearly a spherical shape. Thus we derive the “spatially-resolved” of sources A and B in N83C and compare it with that obtained in earlier studies for SMC and the MW. The value can be calculated from the following equation:
| (3) |
where is the 12CO() luminosity of the molecular cloud. In order to calculate from our 12CO() data, we assume the 12CO()/12CO() ratio of 0.9 according to Bolatto et al. (2003). This ratio of 0.9 is consistent with the massive star-forming region in the MW (e.g., Nishimura et al. 2015). For source A, of and of 186 K km s-1 pc2 yield of cm-2 (K km s-1)-1. In addition, we obtained a similar from source B, cm-2 (K km s-1)-1, from of and of 81 K km s-1 pc2. The averaged of cm-2 (K km s-1)-1 is four times higher than that in the MW disk, which is in good agreement with that in N83 obtained by Bolatto et al. (2003), () cm-2 (K km s-1)-1.
4.2 Properties of molecular gas and star formation in N83C
We summarize the properties of the molecular gas based on our ALMA observations and discuss their relation to star formation in N83C.
The derived gas density of cm-3 is significantly higher than the typical gas density of cm-3 in the Orion A/B molecular clouds (Nishimura et al., 2015), even though both gas densities are derived from the same molecular line, 12CO(). Such a difference in derived gas densities is presumably due to the low metallicity in the SMC. The low metallicity corresponds to the small-dust content in molecular clouds, which causes the reduction of the shielding against far-UV radiation. In this condition, external far-UV radiation from the H ii region associated with N83C easily penetrates and photodissociates the outer layer of the 12CO molecule in the molecular clouds. Thus we can only observe the innermost parts of the molecular clouds, whose gas density is cm-3, even in 12CO emission. It is to be noted that theoretical simulations examined by Glover & Clark (2012) support our results: their simulations suggest that diffuse CO emission becomes unobservable, but dense gas continues to produce observable CO emission as metallicity decreases. The observational fact that even 12CO emission traces the high-density ( cm-3) regions in N83C just corresponds to this situation.
Then, we consider the meaning of the derived kinetic temperature of molecular gas, 30 – 50 K. Bolatto et al. (2003) suggested that warm ( 40 K) clumps exist in some regions of N83 whose 12CO()/12CO() ratios exceed 2. Although the 12CO()/12CO() ratio of 0.9 in N83C is not so high (Bolatto et al. 2003; Bolatto et al. 2005), it is possible that the global gas temperature exceeds 30 K in N83C considering that the bright H ii region, which is a likely heating source, spreads over N83. In addition, the kinetic temperature of molecular gas is consistent with the dust temperature of 35 K (Takekoshi et al., 2017). Recent observational studies in the MW can also support our results: Nishimura et al. (2015) reported that the kinetic temperature in Orion A/B molecular clouds is 20 – 50 K, which is similar to that in the N83C, although the typical temperature of molecular clouds in the MW is 10 – 20 K. Considering that both N83C and Orion A/B molecular clouds are associated with bright H ii regions, it is suggested that their temperature increase is due to the heating by far-UV radiation. However, Nishimura et al. (2015) also found a temperature gradient in Orion A/B molecular clouds; the kinetic temperature decreases with distance from the H ii region, while such a temperature gradient extending over more than a few parsecs is not observed in N83C with the spatial resolution of 1 pc. Thus there is a possibility that the molecular gas temperature in N83C is intrinsically high before the generation of the neighboring H ii region.
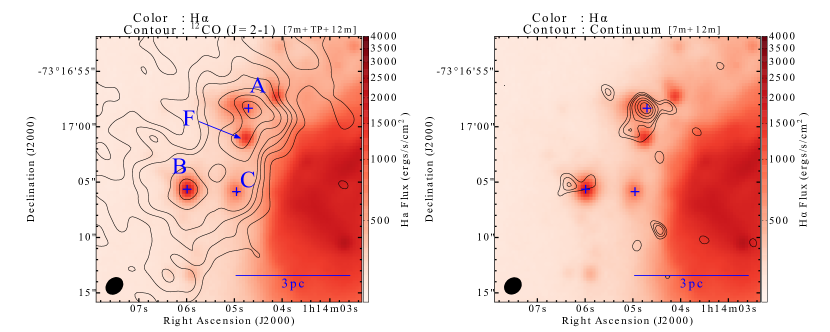
Finally, we discuss the difference in the nature between sources A and B. As described in Section 3.1, the CS() intensity is stronger in source A than in source B, whereas the C18O() peak is only observed at source B. This can be explained by the effects of far-UV radiation from the internal YSOs. Strong far-UV radiation can photochemically enhance CS emission (e.g., Zhou et al. 1991; Jansen et al. 1994; Sternberg & Dalgarno 1995) but dissociate the C18O molecules (e.g., Shimajiri et al. 2014). Considering the luminosity of source A, 20140 , is three times larger than that of source B, 6899 (Kamath et al., 2014), our observational results suggest that strong far-UV radiation from bright YSOs enhances CS emission but dissociates C18O molecule in source A, while such effects do not work in source B because of its lower brightness. However, we found an opposite trend in the distribution of H flux. As shown in the left panel of Figure 4, the peak of H emission is not observed at source A, where H emission is weak, although the strong H peak is observed at source B. In order to reveal the cause of the weak H emission in source A, we examined the spatial comparison between H flux and the Band 6 continuum emission, which corresponds to emission from cold dust, as shown in the right panel of Figure 4. The strongest peak of the Band 6 continuum emission is coincident with the position of source A, and a possible peak is found at source B. This implies a very high density (and presumably unresolved) gas clump at source A and there seems to be a deeply embedded and very cold YSO therein, although the molecular gas density estimated from the LVG calculation is similar between sources A and B ( cm-3). Note that the source A is seen at the bands (Kamath et al., 2014) in spite of the existence of the high-density clump, indicating that source A is likely a composite with a YSO deeply embedded. We also note the H peak located to the south of source A, which is labeled as source F in Figure 4. It seems that the map cannot resolve sources A and F spatially, as shown in Figure 1(c). In addition, the CO clump at source A elongates toward source F. These observational facts indicate that source F is also a YSO as are sources A to E.
5 Summary and Conclusions
We have performed ALMA Cycle 2 observations in the 12CO(), 12CO(), C18O(), 12CO(), 13CO() and CS() lines toward N83C. We summarize this work is as follows:
-
1.
We have successfully obtained subparsec-scale molecular structures in 12CO() and 13CO() emissions, and we found strong CO peaks associated with YSOs. Overall molecular gas is distributed along the edge of the H ii region.
-
2.
We derived a gas density of cm-3 of molecular clouds associated with YSOs based on the virial mass estimated from 12CO() emission as well as the LVG calculation. Since the outer layer of 12CO molecules in the molecular clouds might be photodissociated, we can only observe the innermost parts of the molecular clouds with high gas density.
-
3.
We obtained of cm-2 (K km s-1)-1 for star-forming clumps in N83C based on virial masses and CO luminosities, a number that is four times larger than that in the MW, 2 cm-2 (K km s-1)-1. Note that clouds with much smaller than K km s-1 pc2 have a few times larger than this standard value, even in the MW (Bolatto et al., 2013).
-
4.
We derived the kinetic temperature of the molecular clouds of 30 – 50 K. There are two possibilities to explain such a high temperature: one is the heating from the neighboring H ii region, and the other is that the molecular gas temperature in N83C is intrinsically high before the generation of the neighboring H ii region.
-
5.
We discussed the difference in the nature between two high-mass YSOs, each of which is associated with a molecular clump with a mass of about a few . The luminosities of YSOs are brighter in source A than in source B, whereas H emission is brighter in source B than in source A. Considering the strong peak of the Band 6 (230 GHz) continuum emission at source A, a very high-density gas clump may exist.
Table 1. Properties in Each Molecular Line Molecular line Peak Temperature in Each Source Beam Size Position Angle Rms Noise Level (K) (arcsec) (degree) (mJy beam (mK) A B C D E 12CO(=2-1) 24.4 21.7 18.7 7.1 5.6 172 137 44∘ 17 162 13CO(=2-1) 7.2 7.9 4.3 1.9 1.6 175 140 46∘ 19 188 12CO(=3-2) 18.6 14.6 13.8 3.5 1.7 464 433 -33∘ 148 68 13CO(=3-2) 4.1 4.2 2.8 0.52 0.37 493 462 61∘ 174 79 CS(=7-6) 0.58 0.49 0.36 475 406 56∘ 113 64 C18O(=2-1) 0.077 0.10 0.079 825 606 86∘ 37 16
Table 2. Virial Masses, H2 Densities, and CO Luminosities of CO Clumps in N83C Source molecular line H2 density (km s-1) (pc) () (cm-3) (K km s-1 pc2) A 12CO(=2-1) 1.69 0.8 2.5 103 1.5 104 186 13CO(=2-1) 1.33 0.7 1.4 103 1.2 104 B 12CO(=2-1) 1.60 0.6 1.5 103 2.8 104 81 13CO(=2-1) 0.94 0.6 5.8 102 7.9 103
means the CO() luminosity assuming the CO()/CO() intensity ratio of 0.9.
References
- Bolatto et al. (2005) Bolatto, A. D., Israel, F. P., & Martin, C. L. 2005, ApJ, 633, 210
- Bolatto et al. (2003) Bolatto, A. D., Leroy, A., Israel, F. P., & Jackson, J. M. 2003, ApJ, 595, 167
- Bolatto et al. (2013) Bolatto, A. D., Wolfire, M., & Leroy, A. K. 2013, ARA&A, 51, 207
- Dufour (1984) Dufour, R. J. 1984, in IAU Symp. 108, Structure and Evolution of the Magellanic Clouds, ed. S. van den Bergh, & K. S. D. de Boer (Dordrecht: Reidel), 353
- Goldreich & Kwan (1974) Goldreich, P., & Kwan, J. 1974, ApJ, 189, 441
- Glover & Clark (2012) Glover, S. C. O., & Clark, P. C. 2012, MNRAS, 426, 377
- Haberl et al. (2000) Haberl, F., Filipović, M. D., Pietsch, W., & Kahabka, P. 2000, A&AS, 142, 41
- Hilditch et al. (2005) Hilditch, R. W., Howarth, I. D., & Harries, T. J. 2005, MNRAS, 357, 304
- Israel et al. (1993) Israel, F. P., Johansson, L. E. B., Lequeux, J., et al. 1993, A&A, 276, 25
- Israel et al. (2003) Israel, F. P., Johansson, L. E. B., Rubio, M., et al. 2003, A&A, 406, 817
- Jansen et al. (1994) Jansen, D. J., van Dishoeck, E. F., & Black, J. H. 1994, A&A, 282, 605
- Kamath et al. (2014) Kamath, D., Wood, P. R., & Van Winckel, H. 2014, MNRAS, 439, 2211
- Kurt et al. (1999) Kurt, C. M., Dufour, R. J., Garnett, D. R., et al. 1999, ApJ, 518, 246
- Koornneef (1984) Koornneef, J. 1984, in IAU Symp. 108, Structure and Evolution of the Magellanic Clouds, ed. S. van den Bergh, & K. S. D. de Boer (Dordrecht: Reidel), 333
- Lequeux et al. (1994) Lequeux, J., Le Bourlot, J., Pineau des Forets, G., et al. 1994, A&A, 292, 371
- Li et al. (2017) Li, C.-J., Chu, Y.-H., Gruendl, R. A., et al. 2017, ApJ, 836, 85
- Mizuno et al. (2001) Mizuno, N., Rubio, M., Mizuno, A., et al. 2001, PASJ, 53, L45
- Mizuno et al. (2010) Mizuno, Y., Kawamura, A., Onishi, T., et al. 2010, PASJ, 62, 51
- Nishimura et al. (2015) Nishimura, A., Tokuda, K., Kimura, K., et al. 2015, ApJS, 216, 18
- Pagel (2003) Pagel, B. E. J. 2003, in ASP Conf. Ser. 304, CNO Abundances in Dwarf and Spiral Galaxies, ed. C. Charbonnel, D. Schaerer & G. Meynet (San Francisco, CA: ASP), 187
- Robitaille & Bressert (2012) Robitaille, T., & Bressert, E. 2012, APLpy: Astronomical Plotting Library in Python, Astrophysics Source Code Library, ascl:1208.017
- Rubio et al. (1993) Rubio, M., Lequeux, J., Boulanger, F., et al. 1993, A&A, 271, 1
- Rubio et al. (1996) Rubio, M., Lequeux, J., Boulanger, F., et al. 1996, A&AS, 118, 263
- Scoville & Solomon (1974) Scoville, N. Z. & Solomon, P. M. 1974, ApJ, 187, L67
- Sewiło et al. (2013) Sewiło, M., Carlson, L. R., Seale, J. P., et al. 2013, ApJ, 778, 15
- Shimajiri et al. (2014) Shimajiri, Y., Kitamura, Y., Saito, M., et al. 2014, A&A, 564, A68
- Solomon et al. (1987) Solomon, P. M., Rivolo, A. R., Barrett, J., & Yahil, A. 1987, ApJ, 319, 730
- Sternberg & Dalgarno (1995) Sternberg, A., & Dalgarno, A. 1995, ApJS, 99, 565
- Takekoshi et al. (2017) Takekoshi, T., Minamidani, T., Komugi, S., et al. 2017, ApJ, 835, 55
- Zhou et al. (1991) Zhou, S., Evans, N. J., II, Guesten, R., Mundy, L. G., & Kutner, M. L. 1991, ApJ, 372, 518