Transverse momentum spectra of hadrons in high energy pp and heavy ion collisions
Abstract
We present a study of transverse momentum () spectra of unidentified charged particles in pp collisions at RHIC and LHC energies from GeV to 13 TeV using Tsallis/Hagedorn function. The power law of Tsallis/Hagedorn form gives very good description of the hadron spectra in range from 0.2 to 300 GeV/. The power index of the distributions is found to follow a function of the type with asymptotic value . The parameter governing the soft bulk contribution to the spectra remains almost same over wide range of collision energies. We also provide a Tsallis/Hagedorn fit to the spectra of hadrons in pPb and different centralities of PbPb collisions at TeV. The data/fit shows deviations from the Tsallis distribution which become more pronounced as the system size increases. We suggest simple modifications in the Tsallis/Hagedorn power law function and show that the above deviations can be attributed to the transverse flow in low region and to the in-medium energy loss in high region.
pacs:
12.38.Mh, 25.75.Ag, 25.75.DwKeywords: QGP; Hadron Spectra; Tsallis Distribution; Energy Loss.
1 Introduction
The light hadrons are the most abundant particles produced in the pp and heavy ion collisions. The transverse momentum () spectra of hadrons can be used to infer the particle production mechanism in pp collisions. In heavy ion collisions, additional final state effects such as collective flow [1, 2], recombination [2, 3] and jet-quenching [4] in different ranges are superimposed over the hadron spectra. The hadron spectra in pp collisions are successfully described by Tsallis distribution [5, 6] in terms of only two parameters, the Tsallis parameter and the parameter which governs the degree of non-thermalization. It is well known [7, 8, 9] that the functional form of the Tsallis distribution which describes near-thermal systems is essentially the same as the power law function by Hagedorn which is applicable to QCD hard scatterings [10, 11]. There are numerous studies which show that the Tsallis/Hagedorn distribution gives an excellent description of spectra of all identified hadrons measured in pp collisions at SPS, RHIC and LHC energies [7, 12, 13, 14]. The work in Ref. [15] makes a comparative study of various forms of Tsallis distributions available in the literature by fitting the hadron spectra measured at RHIC and LHC. The recent papers [16, 17, 18] present a study of the Tsallis parameters for distributions of pions produced in pp collisions as a function of ranging between 6.3 GeV and 7 TeV. The CMS papers [19, 20] present studies on measured identified particle spectra using Tsallis distribution at = 0.9, 2.76, 7 and 13 TeV. There are many attempts to use the Tsallis distribution in heavy ion collisions after taking into account the transverse collective flow which is a final state effect [21, 22, 23]. The work in Ref. [24] studies the spectra of the strange hadrons production in pp collision at 7 TeV, pPb collision at 5.02 TeV and PbPb collision at 2.76 TeV using the Tsallis distribution which includes the transverse flow.
The Tsallis distribution is applied to unidentified light charged hadron spectra measured in pp collisions at LHC over a wide range upto 200 GeV/ [25]. The work in Ref. [26] studies the spectra of both jets and hadrons in pp collisions. They find that the power index is 4-5 for jet production and 6-10 for hadron production. The work in Refs. [27, 28] uses Tsallis power law to fit the hadron spectra in wide range measured in pp collisions. Looking more closely at the data/fit they suggest that deviations of the data from power law fit follows a log-periodic oscillation which could imply a complex exponent of the power law. It was further suggested [29, 30] that the oscillations in data/fits in PbPb collisions at = 2.76 TeV are similar to those in pp data in the same range of transverse momenta.
In this work, we study transverse momentum () spectra of unidentified charged particles in pp collisions at = 0.0624, 0.2, 0.9, 2.36, 2.76, 5.02, 7 and 13 TeV using Tsallis/Hagedorn function. The statistical and systematic errors are added in quadrature and are used in the fits. The parameters of such fits are studied as a function of beam energies. We also study the spectra of identified charged particles in pp collisions albeit at smaller . Since the aim of the work is to obtain a function describing the hadron spectra in wide range, we choose the unidentified particles for which the measurements are available at very high upto 200 GeV/. We also make a Tsallis/Hagedorn fit to the spectra of hadrons in pPb and different centralities of PbPb collisions at = 5.02 TeV. We suggest simple modifications in the Tsallis/Hagedorn power law function to include transverse flow and in-medium energy loss in the hadronic spectra.
2 Tsallis/Hagedorn distribution function and the modification
The transverse mass () distribution of particles produced in hadronic collisions can be described by the Hagedorn function which is a QCD-inspired summed power law [10] given as
| (1) |
This function describes both the bulk spectra in the low region and the particles produced in QCD hard scatterings reflected in the high region. Let us compare this function with the Tsallis distribution [5, 6] of thermodynamic origin given by
| (2) |
The Tsallis distribution describes near-thermal systems in terms of Tsallis parameter and the parameter which measures degree of non-thermalization [31]. The functions in Eq. 1 and in Eq. 2 have similar mathematical forms with and . Larger values of correspond to smaller values of . Both and have been interchangeably used in Tsallis distribution [6, 12, 32, 33, 34]. Phenomenological studies suggest that, for quark-quark point scattering, [35, 36], which grows larger if multiple scattering centers are involved. The study in Ref. [15] suggests that both the forms given in Eq. 1 and in Eq. 2 give equally good fit to the hadron spectra in pp collisions. We use Eq. 2 in case of pp collisions.
Tsallis/Hagedorn function is able to describe spectra in pp collisions practically at all generations of proton colliders. There have been many attempts to use the Tsallis distribution in heavy ion collisions as well by including the transverse collective flow [21, 22, 23]. In addition, in heavy ion collisions, particle spectra at high are known to be modified due to in-medium energy loss. The Tsallis/Hagedorn distribution can be modified by including these final state effects in different regions as follows:
| (3a) | ||||
| (3b) | ||||
The first function (Eq. 3a) is shown to govern the thermal and collective part of the hadron spectrum with the temperature and the average transverse flow velocity [22].
The second function (Eq. 3b) is obtained after shifting the distribution in Eq.1 by energy loss in the medium as
| (4) |
The energy loss is proportional to at low and in general can be parameterized similar to the work in Ref. [37] as
| (5) |
Here, the parameter quantifies different energy loss regimes for light quarks in the medium [38, 39]. The parameter is proportional to the medium size and is an arbitrary scale set as 1 GeV. Using Eq. 5 in Eq. 4 and ignoring 1 we get Eq. 3b applicable for high . In our study, we find that this function describes the particle spectra at above 7 GeV/. Fits to the data would constrain the value of and thus is not an independent parameter. The empirical parton energy loss in nuclear collisions at RHIC energies is found to be proportional to [40].
3 Results and discussions
Figure 1 shows the invariant yields of the charged particles as a function of for pp collisions at = 62.4 and 200 GeV measured by the PHENIX experiment [41, 42]. The solid curves are the Tsallis distributions fitted to the spectra. The Tsallis distribution function gives good description of the data for both the collision energies which can be inferred from the values of given in the Table 1.
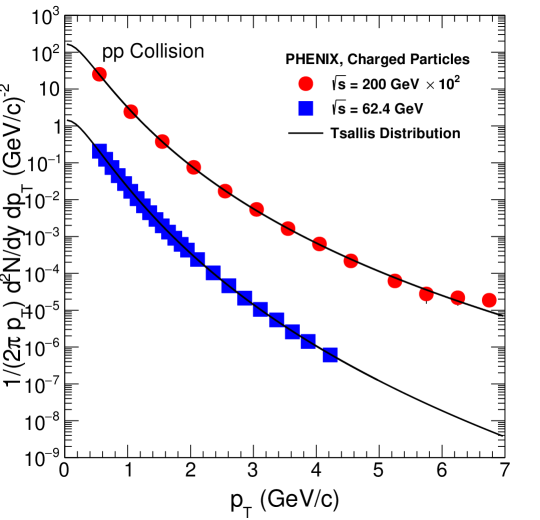
Figure 2 shows the invariant yields of the charged particles as a function of for pp collisions at = 0.9, 2.76, 7 and 13 TeV measured by the ALICE experiment [43, 44]. The solid curves are the Tsallis distributions. The Tsallis distribution function gives good description of the data for collision energies which can be inferred from the values of given in the Table 1.
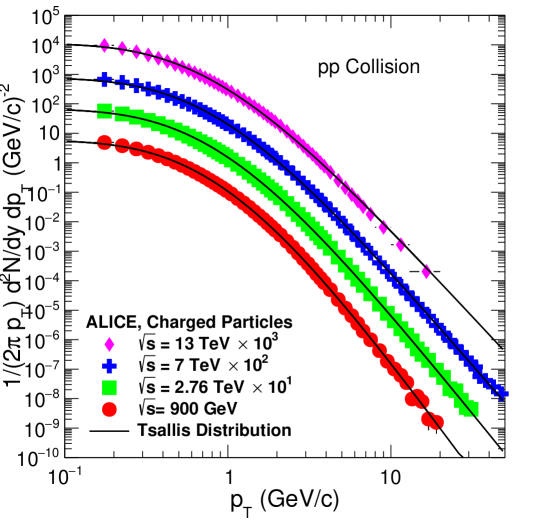
Figure 3 shows the invariant yields of the charged particles as a function of for pp collisions at = 0.9, 2.36, 2.76, 5.02 and 7 TeV measured by the CMS experiment [45, 46, 47, 48]. The solid curves are the Tsallis distributions fitted to the spectra. The Tsallis distribution function gives good description of the data for all collision energies which can be inferred from the values of gives in the Table 1.
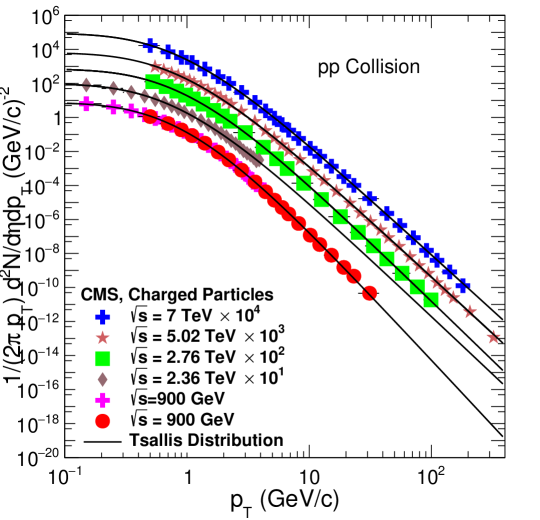
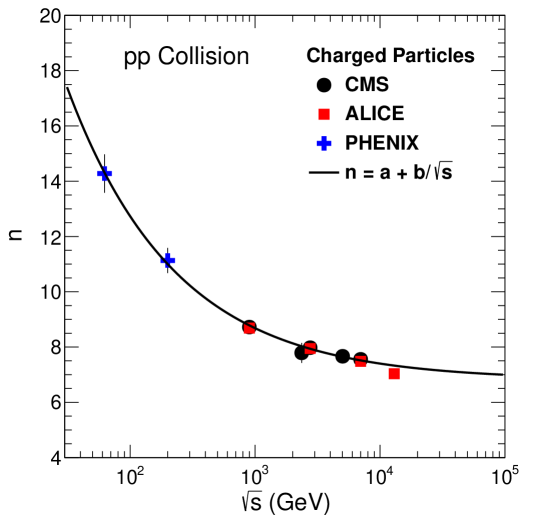
Figure 4 shows the Tsallis parameter for the charged particles as a function of the pp collision energy . The value of decreases as we move from RHIC to LHC energies. The decreasing value of shows that number of quarks participating for a produced particle are reduced for higher energy collisions. The parameter can be parametrized by a function of the type
| (6) |
Here = 6.81 0.06 and = 59.24 3.53 GeV with /NDF = 0.78. The QCD point scattering for pions production gives . Earlier studies have suggested that the value of is larger for baryons as compared to that for mesons. Since the bulk of the particles produced in the pp collisions are predominantly pions, we can consider the unidentified particle spectra as that of pions.
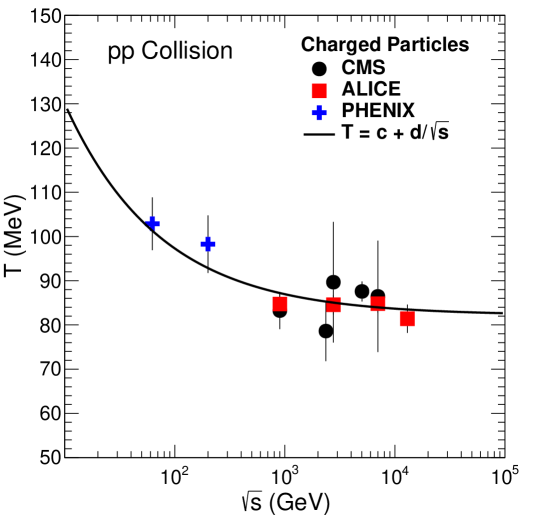
Figure 5 shows the Tsallis temperature parameter for the charged particles as a function of in pp collision. The parameter can be parametrized by a function of the type
| (7) |
Here = 0.082 0.002 GeV and = 0.151 0.048 (GeV)2 with /NDF = 0.71. The parameter slowly decreases with the collision energy.
We also present such analysis for each identified particle separately although in a much smaller range of limited by measured data. The identified particle spectra measured at RHIC and LHC energies [33, 49, 50, 51, 52, 53, 54, 55] are fitted with the Tsallis distribution and its parameters and are obtained. Figure 6 shows the Tsallis parameter for the identified charged particles as a function of . The panel (a) is for charged pions, (b) is for neutral pions, (c) is for charged kaons and (d) is for protons. The solid curve is the fit given by function in Eq. 6. The asymptotic values of parameter are 6.41 0.10 for charged pions, 7.23 0.48 for neutral pions, 6.72 0.18 for charged kaons and 8.76 0.36 for protons. The value of /NDF is not good for charged pions and kaons because the value of at = 900 GeV is away from the fit line. This study shows that the asymptotic value of for unidentified charged particles is closer to what is obtained for pions and kaons. Figure 7 shows the Tsallis temperature parameter for the identified particles as a function of in pp collision. The panel (a) is for charged pions, (b) is for neutral pions, (c) is for charged kaons and (d) is for protons. The bahavior of the parameter is similar to what is shown in Fig. 5.
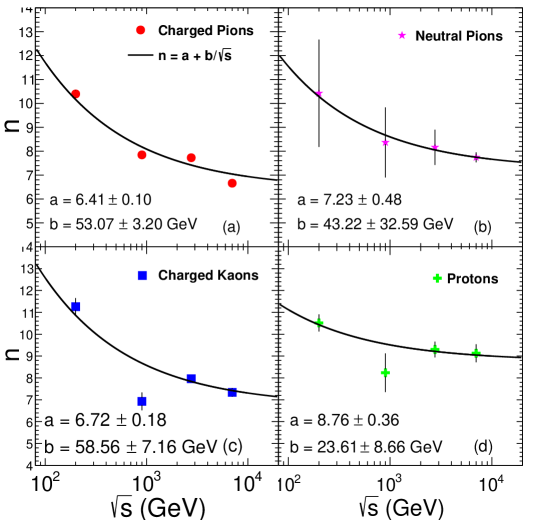
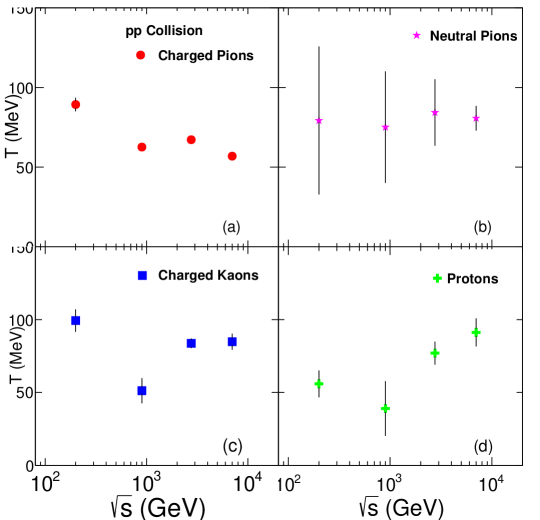
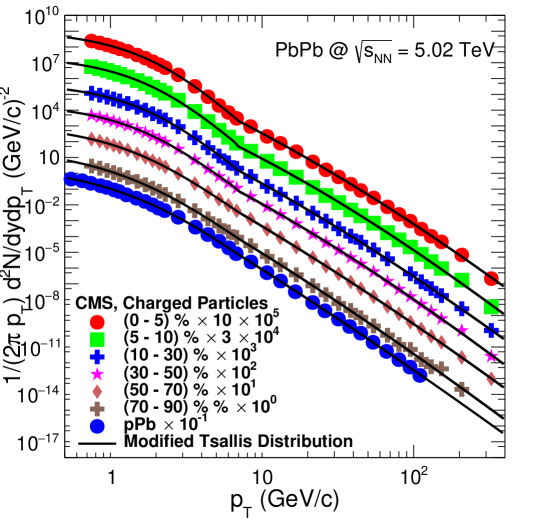
Figure 8 shows the invariant yields of the charged particles as a function of for pPb collisions and for many centralities of PbPb collisions at = 5.02 TeV measured by the CMS experiment [47]. The solid curves are the fitted Tsallis distributions (Eq. 2). Figure 9 shows the ratio of the data and the fitted Tsallis distribution as a function of for pp, pPb and PbPb collisions at = 5.02 TeV. As we move from peripheral to central PbPb collisions, the data show increasing deviations from the Tsallis fit. The values of the Tsallis fit are given in the Table 2. The pp and pPb data also show some deviations from the fit. Interestingly, the deviation pattern in pp and pPb looks similar to that in PbPb collisions with deviation magnitude increasing with system size. It was suggested in Ref. [28, 29] that the ratio of the data to the Tsallis fit shows a log oscillation function and which can be parametrized by a function of the form
| (8) |
Here , , , and are the fit parameters. We observe from Fig. 9 that the log oscillation function although loaded with five parameters does not describe the deviation pattern specially for more central PbPb collisions.
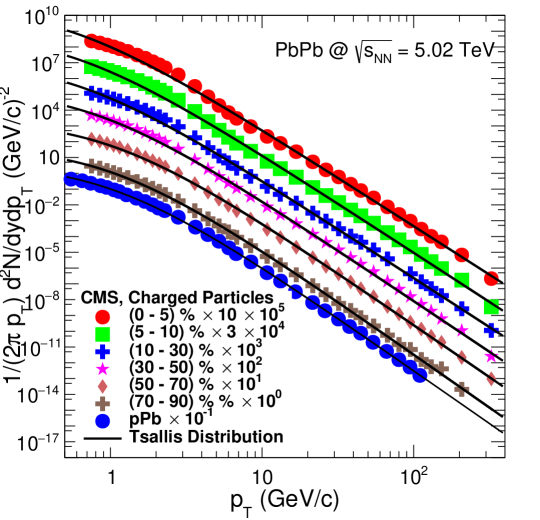
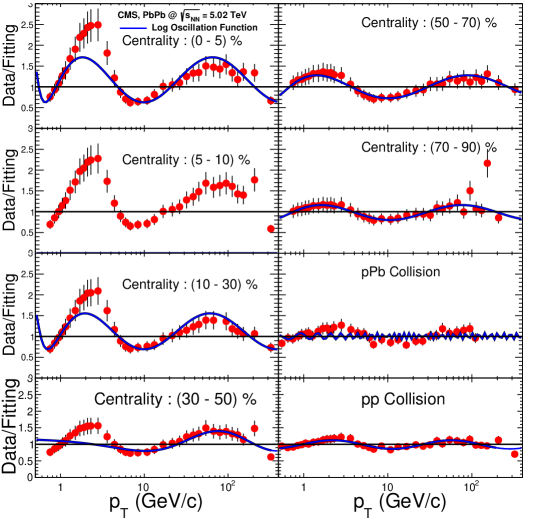
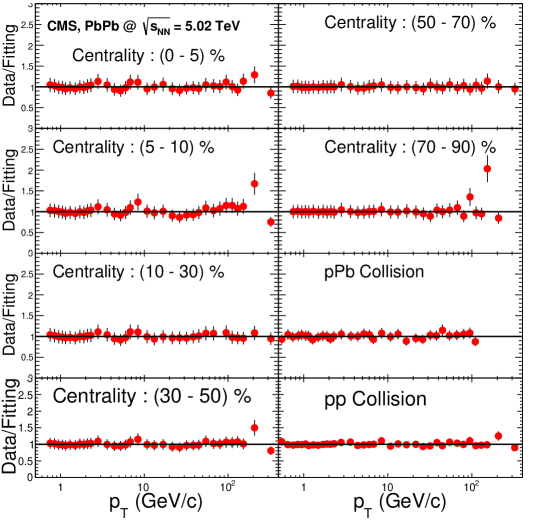
Figure 10 shows the invariant yields of the charged particles as a function of for pPb and PbPb collisions at = 5.02 TeV measured by the CMS experiment [47, 56]. The solid curves are the modified Tsallis distributions given by Eq. 3. Figure 11 shows the ratio of the data and the fit function by the modified Tsallis distribution as a function of for pp, pPb and PbPb collisions at = 5.02 TeV. The ratio of the data and the fit function shows that the modified Tsallis distribution function gives excellent description of the measured data in full range for all the systems. The parameters of the modified Tsallis distribution are given in the Table 3. The values of the first set of parameters (, , ) increase with increasing system size for PbPb collisions. It shows that degree of thermalization (governed by ) and the transverse flow (governed by ) increase with system size. While fitting the second function, we fix the parameter guided by pp value. The exponent which decides the variation of the energy loss of partons as a function of their energy remains within 0.4 to 0.7. The parameter is proportional to system size and increases as we move from pp to the most central PbPb collisions. To summarize, the functions given in Eqs. 3 give excellent description of the hadron spectra over wide range of with its parameters indicating different physics effects in the collisions.
The modified function (Eq. 3) is intended for PbPb systems to cover medium effects. We have applied it for small systems as well. The charged particle spectrum in pp collision when fitted with the Tsallis (Eq. 2) gives . The value improves to 0.31 when fitting is performed with the modified Tsallis (Eq. 3). The pp system shows a small transverse flow and energy loss effect. It is not surprising since recent experiments have measured effects of collectivity in pp collisions when analysis on high muliplicity events was performed [57].
| Experiment | |||||
|---|---|---|---|---|---|
| (MeV) | |||||
| 62.4 GeV | PHENIX | 14.28 0.69 | 1.07 0.05 | 102.87 5.98 | 0.49 |
| 200 GeV | PHENIX | 11.13 0.45 | 1.09 0.04 | 98.27 6.50 | 0.49 |
| 900 GeV | ALICE | 8.69 0.13 | 1.12 0.02 | 84.71 2.58 | 0.16 |
| 2.76 TeV | ALICE | 7.95 0.07 | 1.13 0.01 | 84.57 2.21 | 0.17 |
| 7 TeV | ALICE | 7.48 0.05 | 1.13 0.01 | 84.81 2.08 | 0.26 |
| 13 TeV | ALICE | 7.03 0.14 | 1.14 0.02 | 81.40 3.20 | 0.38 |
| 900 GeV | CMS | 8.72 0.22 | 1.11 0.03 | 83.24 4.19 | 0.12 |
| 2.36 TeV | CMS | 7.79 0.36 | 1.13 0.05 | 78.61 6.82 | 0.21 |
| 2.76 TeV | CMS | 7.98 0.21 | 1.13 0.03 | 89.66 13.64 | 0.02 |
| 5.02 TeV | CMS | 7.67 0.02 | 1.13 0.00 | 87.58 2.26 | 0.79 |
| 7 TeV | CMS | 7.55 0.16 | 1.13 0.02 | 86.46 12.60 | 0.02 |
| System | PbPb | PbPb | PbPb | PbPb | PbPb | PbPb | pPb | pp |
|---|---|---|---|---|---|---|---|---|
| Centrality () | 0 - 5 | 5 - 10 | 10 - 30 | 30 - 50 | 50 - 70 | 70 - 90 | - | - |
| 5.93 | 6.11 | 3.89 | 3.11 | 1.84 | 1.20 | 1.22 | 0.79 |
| System | ||||||
|---|---|---|---|---|---|---|
| (GeV/) | (GeV/) | |||||
| PbPb | 8.28 0.92 | 1.38 0.17 | 0.62 0.06 | 0.47 0.03 | 5.72 0.23 | 0.29 |
| (0 - 5 ) | ||||||
| PbPb | 8.13 0.93 | 1.35 0.18 | 0.60 0.06 | 0.42 0.04 | 5.45 0.33 | 0.68 |
| (5 - 10 ) | ||||||
| PbPb | 7.73 0.81 | 1.28 0.14 | 0.62 0.08 | 0.52 0.03 | 5.01 0.20 | 0.14 |
| (10 - 30 ) | ||||||
| PbPb : | 7.03 0.65 | 1.11 0.11 | 0.61 0.11 | 0.45 0.04 | 4.25 0.22 | 0.36 |
| (30 - 50 ) | ||||||
| PbPb | 6.64 0.72 | 0.96 0.12 | 0.50 0.08 | 0.58 0.03 | 3.73 0.17 | 0.06 |
| (50 - 70 ) | ||||||
| PbPb | 6.66 1.20 | 0.90 0.26 | 0.34 0.06 | 0.59 0.04 | 2.95 0.16 | 0.63 |
| (70 - 90 ) | ||||||
| pPb | 7.78 1.70 | 1.34 0.95 | 0.14 0.05 | 0.66 0.08 | 2.95 0.73 | 0.32 |
| pp | 7.78 1.70 | 1.09 0.41 | 0.14 0.07 | 0.60 0.03 | 2.87 0.10 | 0.31 |
4 Conclusion
We carried out an analysis of transverse momentum spectra of the unidentified charged particles in pp collisions at RHIC and LHC energies from = 62.4 GeV to 13 TeV using Tsallis distribution function. The power law of Tsallis/Hagedorn form gives very good description of the hadron spectra in the range 0.2 to 300 GeV/. The power index of the distributions is found to follow a function of the type with asymptotic value . The Tsallis parameter governing the soft bulk contribution to the spectra also decreases slowly with the collision energy. We also provide a Tsallis fit to the spectra of hadrons in different centralities of PbPb collisions at = 5.02 TeV. The measured charged particle spectra in PbPb collisions show deviations from Tsallis form which become more pronounced as the system size increases. We suggest simple modifications of the Tsallis function incorporating transverse flow in the low region and in-medium energy loss in the high region. This function gives excellent description of charged particle spectra in pp, pPb and PbPb collisions with its parameters having potentials to quantify various in-medium effects in all systems.
References
References
- [1] T. Hirano and Y. Nara, Phys. Rev. C 69 (2004) 034908, [nucl-th/0307015].
- [2] R. J. Fries, V. Greco and P. Sorensen, Ann. Rev. Nucl. Part. Sci. 58 (2008) 177, [arXiv:0807.4939 [nucl-th]].
- [3] R. J. Fries, J. Phys. G 30 (2004) S853, [nucl-th/0403036].
- [4] X. N. Wang, Phys. Lett. B 579 (2004) 299, [nucl-th/0307036].
- [5] C. Tsallis, J. Statist. Phys. 52 (1988) 479.
- [6] T. S. Biro, G. Purcsel and K. Urmossy, Eur. Phys. J. A 40 (2009) 325, [arXiv:0812.2104 [hep-ph]].
- [7] P. K. Khandai, P. Sett, P. Shukla and V. Singh, Int. J. Mod. Phys. A 28 (2013) 1350066, [arXiv:1304.6224 [hep-ph]].
- [8] C. Y. Wong and G. Wilk, Acta Phys. Polon. B 43 (2012) 2047, [arXiv:1210.3661 [hep-ph]].
- [9] C. Y. Wong and G. Wilk, Phys. Rev. D 87 (2013) 114007, [arXiv:1305.2627 [hep-ph]].
- [10] R. Hagedorn, Riv. Nuovo Cim. 6N10 (1983) 1.
- [11] R. Blankenbecler and S. J. Brodsky, Phys. Rev. D 10 (1974) 2973.
- [12] A. Adare et al. [PHENIX Collaboration], Phys. Rev. D 83 (2011) 052004, [arXiv:1005.3674 [hep-ex]].
- [13] P. Sett and P. Shukla, Adv. High Energy Phys. 2014 (2014) 896037, [arXiv:1408.1034 [hep-ph]].
- [14] H. Zheng, L. Zhu and A. Bonasera, Phys. Rev. D 92 (2015) 074009, [arXiv:1506.03156 [nucl-th]].
- [15] H. Zheng and L. Zhu, Adv. High Energy Phys. 2016 (2016) 9632126, [arXiv:1512.03555 [nucl-th]].
- [16] A. S. Parvan, O. V. Teryaev and J. Cleymans, Eur. Phys. J. A 53 (2017) 102, [arXiv:1607.01956 [nucl-th]].
- [17] A. S. Parvan, Eur. Phys. J. A 52 (2016) 355, [arXiv:1608.01888 [nucl-th]].
- [18] M. D. Azmi and J. Cleymans, J. Phys. G 41 (2014) 065001, [arXiv:1401.4835 [hep-ph]].
- [19] S. Chatrchyan et al. [CMS Collaboration], Eur. Phys. J. C 72 (2012) 2164, [arXiv:1207.4724 [hep-ex]].
- [20] A. M. Sirunyan et al. [CMS Collaboration], arXiv:1706.10194 [hep-ex].
- [21] Z. Tang, Y. Xu, L. Ruan, G. van Buren, F. Wang and Z. Xu, Phys. Rev. C 79 (2009) 051901, [arXiv:0812.1609 [nucl-ex]].
- [22] P. K. Khandai, P. Sett, P. Shukla and V. Singh, J. Phys. G 41 (2014) 025105, [arXiv:1310.4022 [nucl-th]].
- [23] P. Sett and P. Shukla, Int. J. Mod. Phys. E 24 (2015) 1550046, [arXiv:1505.05258 [hep-ph]].
- [24] K. Saraswat, P. Shukla, V. Kumar and V. Singh, Eur. Phys. J. A 53 (2017) 84, [arXiv:1702.05734 [nucl-th]].
- [25] J. Cleymans and M. D. Azmi, J. Phys. Conf. Ser. 668 (2016) 012050, [arXiv:1508.03143 [hep-ph]].
- [26] C. Y. Wong, G. Wilk, L. J. L. Cirto and C. Tsallis, Phys. Rev. D 91 (2015) 114027, [arXiv:1505.02022 [hep-ph]].
- [27] G. Wilk and Z. Wlodarczyk, Physica A 413 (2014) 53, [arXiv:1403.3263 [cond-mat.stat-mech]].
- [28] G. Wilk and Z. Wlodarczyk, arXiv:1403.3508 [hep-ph].
- [29] M. Rybczynski, G. Wilk and Z. Wlodarczyk, EPJ Web Conf. 90 (2015) 01002, [arXiv:1411.5148 [hep-ph]].
- [30] G. Wilk and Z. Wlodarczyk, Entropy 17 (2015) 384, [arXiv:1501.02608 [cond-mat.stat-mech]].
- [31] G. Wilk and Z. Wlodarczyk, Phys. Rev. Lett. 84 (2000) 2770, [hep-ph/9908459].
- [32] J. Cleymans and D. Worku, Eur. Phys. J. A 48 (2012) 160, [arXiv:1203.4343 [hep-ph]].
- [33] A. Adare et al. [PHENIX Collaboration], Phys. Rev. C 83 (2011) 064903, [arXiv:1102.0753 [nucl-ex]].
- [34] B. I. Abelev et al. [STAR Collaboration], Phys. Rev. C 75 (2007) 064901, [nucl-ex/0607033].
- [35] R. Blankenbecler, S. J. Brodsky and J. F. Gunion, Phys. Rev. D 12 (1975) 3469.
- [36] S. J. Brodsky, H. J. Pirner and J. Raufeisen, Phys. Lett. B 637 (2006) 58, [hep-ph/0510315].
- [37] M. Spousta, Phys. Lett. B 767 (2017) 10, [arXiv:1606.00903 [hep-ph]].
- [38] R. Baier, D. Schiff and B. G. Zakharov, Ann. Rev. Nucl. Part. Sci. 50 (2000) 37, [hep-ph/0002198].
- [39] S. De and D. K. Srivastava, J. Phys. G 39 (2012) 015001, Erratum: [J. Phys. G 40 (2013) 049502], [arXiv:1107.5659 [nucl-th]].
- [40] G. Wang and H. Z. Huang, Phys. Lett. B 672 (2009) 30, [arXiv:0810.2822 [nucl-ex]].
- [41] A. Adare et al. [PHENIX Collaboration], Phys. Rev. D 86 (2012) 092006, [arXiv:1202.4020 [hep-ex]].
- [42] S. S. Adler et al. [PHENIX Collaboration], Phys. Rev. Lett. 95 (2005) 202001, [hep-ex/0507073].
- [43] B. B. Abelev et al. [ALICE Collaboration], Eur. Phys. J. C 73 (2013) 2662, [arXiv:1307.1093 [nucl-ex]].
- [44] J. Adam et al. [ALICE Collaboration], Phys. Lett. B 753 (2016) 319, [arXiv:1509.08734 [nucl-ex]].
- [45] S. Chatrchyan et al. [CMS Collaboration], Eur. Phys. J. C 72 (2012) 1945, [arXiv:1202.2554 [nucl-ex]].
- [46] V. Khachatryan et al. [CMS Collaboration], JHEP 1002 (2010) 041, [arXiv:1002.0621 [hep-ex]].
- [47] V. Khachatryan et al. [CMS Collaboration], JHEP 1704 (2017) 039, [arXiv:1611.01664 [nucl-ex]].
- [48] S. Chatrchyan et al. [CMS Collaboration], JHEP 1108 (2011) 086, [arXiv:1104.3547 [hep-ex]].
- [49] G. Agakishiev et al. [STAR Collaboration], Phys. Rev. Lett. 108 (2012) 072302, [arXiv:1110.0579 [nucl-ex]].
- [50] K. Aamodt et al. [ALICE Collaboration], Eur. Phys. J. C 71 (2011) 1655, [arXiv:1101.4110 [hep-ex]].
- [51] B. B. Abelev et al. [ALICE Collaboration], Phys. Lett. B 736 (2014) 196, [arXiv:1401.1250 [nucl-ex]].
- [52] J. Adam et al. [ALICE Collaboration], Eur. Phys. J. C 75 (2015) 226, [arXiv:1504.00024 [nucl-ex]].
- [53] S. S. Adler et al. [PHENIX Collaboration], Phys. Rev. Lett. 91 (2003) 241803, [hep-ex/0304038].
- [54] B. Abelev et al. [ALICE Collaboration], Phys. Lett. B 717 (2012) 162, [arXiv:1205.5724 [hep-ex]].
- [55] B. B. Abelev et al. [ALICE Collaboration], Eur. Phys. J. C 74 (2014) 3108, [arXiv:1405.3794 [nucl-ex]].
- [56] V. Khachatryan et al. [CMS Collaboration], Eur. Phys. J. C 75 (2015) 237, [arXiv:1502.05387 [nucl-ex]].
- [57] V. Khachatryan et al. [CMS Collaboration], Phys. Lett. B 765 (2017) 193, [arXiv:1606.06198 [nucl-ex]].