Towards a better understanding of the evolution of Wolf-Rayet stars and Type Ib/Ic supernova progenitors
Abstract
Hydrogen-deficient Wolf-Rayet (WR) stars are potential candidates of Type Ib/Ic supernova (SN Ib/Ic) progenitors and their evolution is governed by mass loss. Stellar evolution models with the most popular prescription for WR mass-loss rates given by Nugis & Lamers have difficulties in explaining the luminosity distribution of WR stars of WC and WO types and the SN Ic progenitor properties. Here we suggest some improvements in the WR mass-loss rate prescription and discuss its implications for the evolution of WR stars and SN Ib/Ic progenitors. Recent studies on Galactic WR stars clearly indicate that the mass-loss rates of WC stars are systematically higher than those of WNE stars for a given luminosity. The luminosity and initial metallicity dependencies of WNE mass-loss rates are also significantly different from those of WC stars. These factors have not been adequately considered together in previous stellar evolution models. We also find that an overall increase of WR mass loss rates by about 60 per cent compared to the empirical values obtained with a clumping factor of 10 is needed to explain the most faint WC/WO stars. This moderate increase with our new WR mas-loss rate prescription results in SN Ib/Ic progenitor models more consistent with observations than those given by the Nugis & Lamers prescription. In particular, our new models predict that the properties of SN Ib and SN Ic progenitors are distinctively different, rather than they form a continuous sequence.
keywords:
stars: evolution – stars: massive – stars: mass-loss – stars: Wolf-Rayet – supernovae: general1 Introduction
Massive stars may lose their hydrogen-rich envelopes during the post-main sequence phase via stellar winds (Conti, 1976). Thus-formed hydrogen-deficient stars are usually observed as classical Wolf-Rayet (WR) stars having high bolometric luminosities of and strong emission lines resulting from optically thick winds (see Crowther, 2007, for a review). If they can produce supernovae at their death, they would appear as Type Ib or Ic supernovae (SNe Ib/Ic). Hydrogen-deficient stars as SN Ib/Ic progenitors may also be produced in interacting binary systems, and they can be less massive than classical WR stars that typically have (Podsiadlowski et al., 1992; Vanbeveren et al., 1998; Wellstein et al., 1999; Yoon et al., 2010; Eldridge et al., 2013; Yoon et al., 2017). The quasi-WR star HD45166 is one such candidate (e.g., Steiner & Oliveira, 2005).
WR stars lose mass via radiation-driven winds at very high rates () and their evolution towards core collapse is critically determined by mass loss. In spite of both observational and theoretical efforts during the last three decades, the WR mass-loss rates at various stages are still subject to considerable uncertainty. The prescriptions of WR mass-loss rates used in stellar evolution models before 2000 gave very large values (e.g., Maeder & Meynet, 1987; Langer, 1989; Hamann et al., 1995). One of the most striking results in these studies was the prediction that even very massive stars with may have a final mass as low as 3.0 – 4.0 , whether or not they are in binary systems (Woosley et al., 1993; Wellstein et al., 1999).
However, consideration of wind clumping (e.g., Moffat & Robert, 1994; Lépine & Moffat, 1999) in later empirical estimates of WR mass-loss rates resulted in much lower values (e.g., Hamann & Koesterke, 1998; Hamann et al., 2006; Crowther, 2007; Sander et al., 2012). For example, currently the most popular prescription by Nugis & Lamers (2000, hereafter, NL) gives WR mass-loss rates almost 10 times lower than those used in the above-quoted theoretical studies. Stellar evolution models adopting the NL prescription at solar metallicity predict much higher final masses of WR stars (; e.g., Meynet & Maeder 2005; Eldridge & Vink 2006; Georgy et al. 2012) than predicted by the models of the 80s and 90s. This implies that single massive stars at would not produce ordinary SNe Ib/Ic, of which the ejecta masses have been inferred to be lower than about for most cases (Drout et al., 2011; Cano, 2013; Taddia et al., 2015; Lyman et al., 2016). Binary star evolution models at solar metallicity using the NL prescription also have great difficulties in explaining SN Ic progenitors in terms of helium and ejecta masses, although they can explain the overall properties of SN Ib progenitors that are helium-rich (see Yoon, 2015, for a recent review).
Recent studies by the Potsdam group presents a homogeneous set of WR star properties for both WN and WC types, which gives an excellent observational constraint on WR star properties (Hamann et al., 2006; Sander et al., 2012; Hainich et al., 2014). As discussed below, the observed population of WN/WC stars cannot be well explained by the models using the NL prescription either. In particular, many WC stars appear to be too faint compared to the prediction of stellar evolution models (Sander et al., 2012).
Given that stellar evolution models with the NL prescription can properly predict neither WR star population nor SN Ic progenitors, we need to consider revising the prescription for WR mass-loss rates. Recently, Tramper et al. (2016, hereafeter, TSK) presented a new prescription for mass-loss rates of hydrogen-free WR stars. They argued that the dependencies of empirical WR mass-loss rates on the luminosity and surface helium abundance are weaker than those of the NL prescription, for WC and WO stars. In this paper, we further discuss this issue on the dependencies of WR mass-loss rates on physical parameters. We argue that the combination of the empirical mass-loss rates of WNE stars and the TSK prescription provides a better qualitative agreement with the observed mass loss rates of hydrogen-free WR stars than the TSK prescription alone and the standard NL prescription. We also argue for the need of an overall increase of WR mass-loss rates by about 60 per cent compared to the values commonly used in recent stellar evolution models.
In Section 2, we compare the mass-loss rate prescriptions of NL and TSK, and confront them with the Potsdam WR sample. We suggest a new prescription for WR mass-loss rates that may better reflect the qualitative features of the empirical mass-loss rates of hydrogen-free WR stars. In Section 3, we present new evolutionary models of pure helium stars (He stars) using this prescription and compare them with observations. We also show that an overall increase of WR mass-loss rates is needed to explain the luminosity distribution of WC/WO stars. We discuss its implications for SN Ib/Ic progenitors in Section 4, and the issue of temperature discrepancy between models and observations of WR stars in Section 5. We conclude our paper in Section 6.
2 Mass loss rates of WR stars
The stellar wind theory suggests that WR winds are driven by radiation pressure caused by metal lines (e.g., Gräfener & Hamann, 2005; Vink & de Koter, 2005; Gräfener & Hamann, 2008; Puls et al., 2008). This implies that WR loss rates should depend on the luminosity and the chemical composition at the stellar surface. The standard NL mass-loss rate prescription is given by
| (1) |
where and denote the surface mass fractions of helium and metals. The mass-loss rate is given in units of . This is a very general prescription that can be applied for all types of WR stars including WNL, WNE, WC, and WO. Note, however, that this prescription is based on their selected sample of Galactic WR stars. The metallicity dependence here is not related to the initial metallicity but to the enrichment of carbon and oxygen at the surface due to mass loss (i.e, for hydrogen-free WR stars). However, in many stellar evolution models including those with the MESA code (Paxton et al., 2011), this dependence is also used for considering the effect of the initial metallicity.
On the other hand, TSK suggests the following prescription based on their selected sample of WC and WO stars in our galaxy, LMC, and IC1613:
| (2) |
One of the advantages of the TSK prescription over the NL prescription is that the dependence of the initial metallicity (or the iron metallicity as presented by TSK) is considered separately from the effect of self-enrichment of CO elements. This approach is consistent with the theoretical studies that find different impacts of iron and CNO elements on WR winds (Vink & de Koter, 2005; Gräfener & Hamann, 2008).
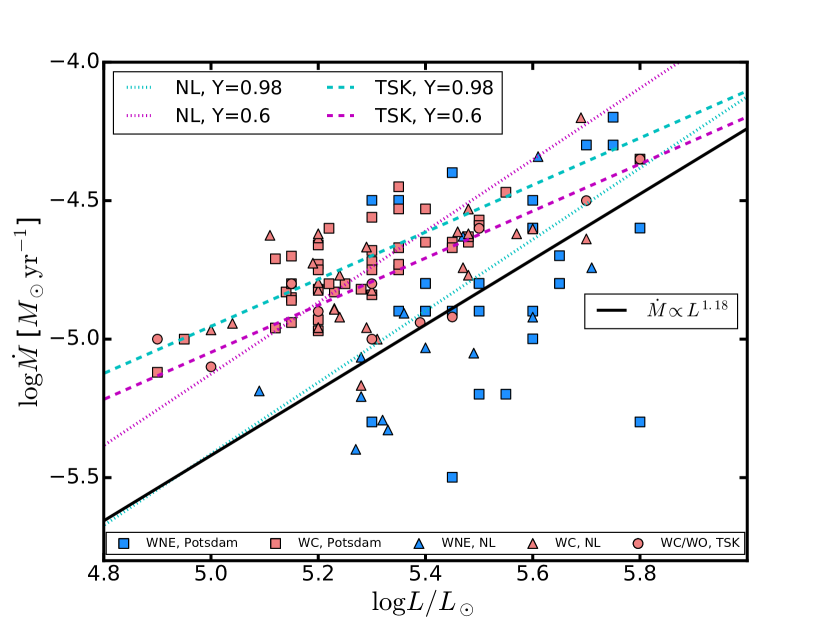
Fig. 1 presents the WR mass-loss rates given by NL and TSK at solar metallicity, compared to the empirical values of Galactic hydrogen-free WR stars111Some WNE stars are found to have small amounts of hydrogen at their surfaces. However, only hydrogen-free WNE stars are considered in this study. Note that the Potsdam group inferred mass-loss rates with clumping factors of for Galactic WNE stars and with for WC stars, respectively (Hamann et al., 2006; Sander et al., 2012). Given that both NL and TSK prescriptions are based on the data compatible with rather than with , here we corrected the WNE mass-loss rates of the Potsdam group by a factor of for this comparison. This is because the empirical mass-loss rates scale with .
2.1 Dependence on the surface helium abundance
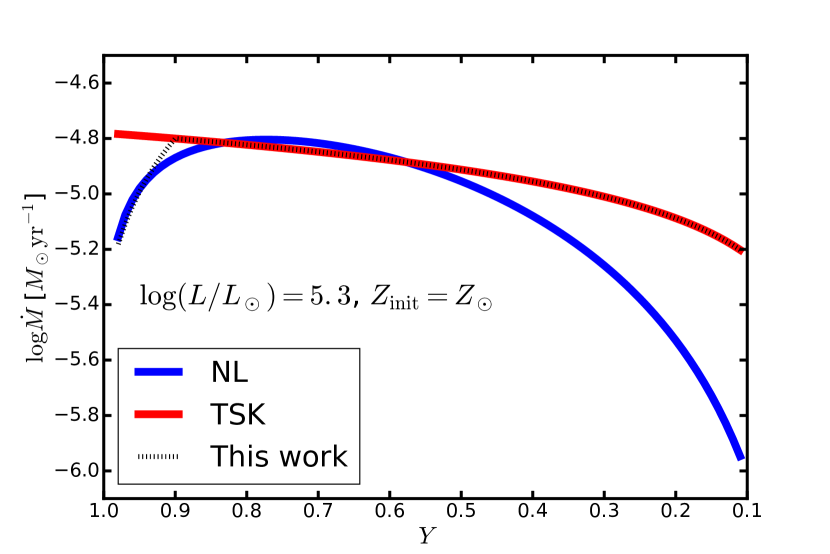
In Fig. 1, it is clearly observed that the mass loss rates of WC/WO stars are systematically higher than those of WNE stars, for a given luminosity. The NL prescription gives a result consistent with this important fact: in the figure, the mass-loss rate with is higher by a factor of 2.52 than that with , which results from the dependence of . Fig. 2 illustrates this dependence more clearly. The NL rate increases rapidly during the transition from WNE ( for ) to WC () until reaches 0.77, after which the WC mass-loss rate gradually decreases.
On the other hand, the TSK prescription does not properly reflect this systematic difference between WNE and WC mass-loss rates. Having the relation of , the TSK values with is about 24% higher than those with , in contrast to the observation. This means that the TSK prescription, which is based on a WC/WO sample with , would result in a significant overestimate when extrapolated to WNE stars. TSK argues that their prescription is compatible with the WNE mass-loss rates of the Potsdam group, but they did not make a correction for to the Potsdam data in their comparison (F. Tramper, private communication).
On the other hand, both NL and TSK found that WC/WO stars with very low have systematically lower mass-loss rates than those with higher . This fact is reflected in both prescriptions as shown in Fig. 2. Note that the dependence of the TSK prescription is weaker than that of NL. TSK argues that their prescription can better explain the mass-loss rates of WO stars with , for which the NL prescription gives too small values compared to observations (Tramper et al., 2015).
2.2 Dependence on the luminosity
The relation of in the TSK prescription for WC/WO stars is in good agreement with that inferred from the WC data of the Potsdam group, which is (Sander et al., 2012). NL also gives a very similar result of with their WC sample (Nugis & Lamers, 2000). As pointed out by TSK, therefore, the standard NL prescription that comprises all WR types (WNL, WNE and WC/WO) has a too steep dependence on the luminosity () compared to the empirical result with WC stars.
For WNE stars, the NL sample gives , which is much steeper than that of WC/WO stars. The luminosity dependence is less clearly found if we include the Potsdam WNE sample. The large scatter of the WNE mass-loss rates in Fig. 1 is likely due to the uncertainty of the distance measurement. Hainich et al. (2014) found for single WNE stars in the LMC, for which the distance uncertainty is much smaller than in the case of Galactic WR stars. Therefore, it seems to be real that WNE stars have a steeper luminosity dependence of mass-loss rates compared to the case of WC/WO stars.
2.3 Dependence on the initial metallicity
As mentioned above, TSK found an initial metallicity dependence of for WC/WO mass-loss rates. Hainich et al. (2014) found a much steeper relation of for WN stars including WNL. This empirical results are in qualitative agreement with the theoretical study by Vink & de Koter (2005), who found a steeper initial metallicity dependence for WNL stars than for WC stars.
Using the Potsdam data of Hamann et al. (2006) and Hainich et al. (2014), we may also derive an initial metallicity dependence only for WNE stars. For this purpose, we may use the relation of that is found with single WNE stars in the LMC (Hainich et al., 2014). Given that the scatter in the distance estimate is minimized with the LMC sample, we may consider this relation more reliable than that obtained with the Galactic sample. Using the fixed exponent of 1.18, the mass loss rates of Galactic WNE stars of the Potsdam sample can be fitted to with a mean squared error of 0.15.
This relation gives 51 per cent higher mass-loss rates than those of LMC WNE stars (i.e., ; Hainich et al. 2014). Assuming that LMC metallicity is half the solar value as in TSK, we get the metallicity dependence of . 222TSK suggested for WNE stars using the same data we used. This discrepancy is because they did not correct the Galactic WNE mass-loss rates for , as mentioned above. Hainich et al. (2014) used in their analysis of LMC WNE stars and a correction of to Galactic WNE mass loss rates by Hamann et al. (2006) is needed to derive the metallicity dependence in a consistent way. This is less steep than in the case where WNL stars are included (i.e., ) but still much steeper than in the case of WC/WO stars (i.e., ). This fact should be taken into account when addressing the metallicity effect of WR star evolution.
2.4 Towards a better prescription for mass-loss rates of hydrogen-free WR stars
The above discussion on previous studies on hydrogen-free WR mass-loss rates, which are based on the best data currently available, leads to the following conclusions.
-
1.
WC/WO stars have systematically higher mass-loss rates than WNE stars.
-
2.
Among WC/WO stars, mass-loss rates tend to decrease as the surface abundance of helium decreases.
-
3.
The mass-loss rates of WNE and WC/WO stars have different luminosity dependencies, with those of WC/WO stars having a less steep dependence than those of WNE stars.
-
4.
The dependence of WNE mass-loss rates on the initial metallicity is steeper than that of WC/WO stars. For WC/WO stars, the effects of the initial metallicity and the self-enrichment of carbon and oxygen on mass loss rates should be considered separately.
A good prescription for WR mass-loss rates should take into account all the above facts. The mass-loss rate prescriptions for hydrogen-free WR stars suggested in the 80s and 90s (e.g., Langer, 1989; Vanbeveren et al., 1998; Wellstein et al., 1999) only consider a mass or luminosity dependence, and none of the above conditions are satisfied. In many recent stellar evolution models including those with the BEC and MESA codes (Brott et al., 2011; Paxton et al., 2011), the standard NL prescription given by Eq. (1) that combines WN and WC data is used. This standard NL prescription meets the first and second requirements, but does not properly consider the third one, having a single luminosity dependence for all WR types (i.e, ). Some authors use two different prescriptions for WN and WC stars presented by NL instead of the standard NL prescription that combines the two (e.g., Eldridge & Vink, 2006). In this case, the first three conditions can be satisfied. However, NL only analysed Galactic WR stars and did not address the dependence on the initial metallicty. The TSK prescription given by Eq. (2) is only suitable for WC/WO stars.
We therefore suggest the following approach. For WNE stars, we may use the empirical relation obtained with the Potsdam data (see Sect. 2.3):
| (3) |
Note that the 3rd term may be replaced by the iron metallicity (i.e., ). Here, we also introduce a scaling factor , to consider the uncertainty in the empirical estimates of WR mass-loss rates. For example, if was adopted instead of , the mass-loss rates presented in Fig. 1 would increase by 58%. We propose below that this scaling factor should be calibrated with Galactic WR stars.
For WC/WO stars, we suggest using the TSK prescription. This is because it provides an improved description of the mass-loss rate dependencies on the surface helium abundance and the initial metallicity as discussed in their paper. Its luminosity dependence is also consistent with the results of the other groups (NL and Potsdam) as mentioned above:
| (4) |
Here we assume that for WC stars, for which nitrogen completely disappears from the surface. In principle, WNE and WC/WO stars might have different values of if clumping properties depended on the spectral types of WR stars. In this study, however, we just take the simplest assumption that is the same for all WR types given that the clumping physics is still not well understood.
For , we suggest using an interpolated value between and , to consider the enhancement of the mass-loss rate during the transition phase from WNE to WC, as the following:
| (5) |
where is given by
| (6) |
In this way, all the four requirements for the mass-loss rate prescription for hydrogen-free WR stars can be fulfilled. In Fig. 2 the mass-loss rate according to our prescription is compared to those given by the NL and TSK prescriptions. As expected, our prescription gives a value comparable to the NL rate when is close to 0.98 and follows the TSK rate for .
3 Evolutionary models v.s. Observed WR stars
Here we present stellar evolutionary models of pure He stars using our new prescription for WR mass-loss rates. For comparison, models with the NL prescription are also presented. We used the BEC code for the calculations, which has been widely used for massive stars (see Yoon et al., 2010; Brott et al., 2011, and references therein). The Schwarzschild criterion for convection was adopted, and and were chosen for representing solar and LMC metallicities. All the model sequences were calculated up to core neon burning or beyond. The considered initial masses of He stars are 4, 6, 8, 10, 12, 15, 20 and 25 . The results of the calculations are summarized in Tables 1 and 2.
3.1 Solar metallicity models with
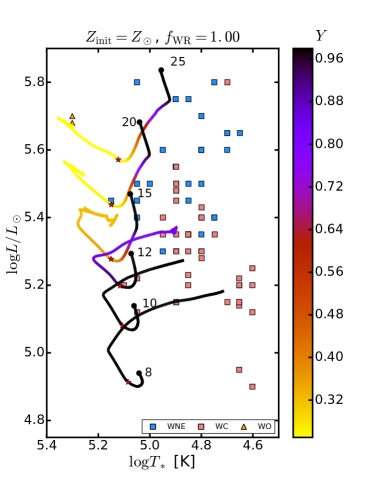
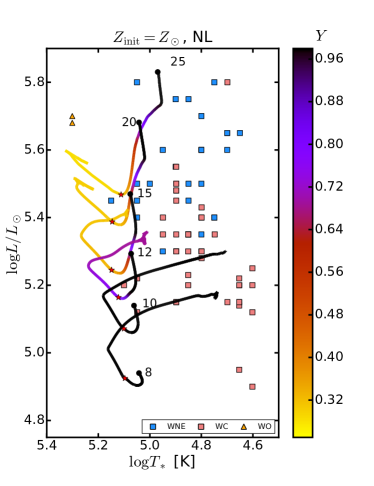
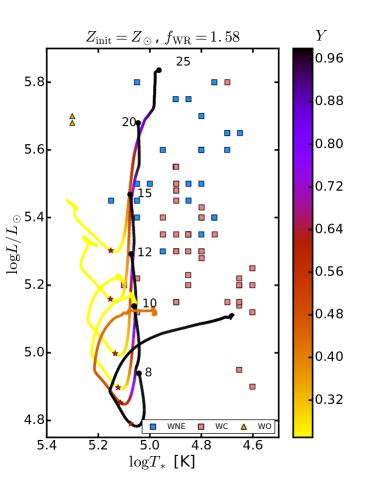
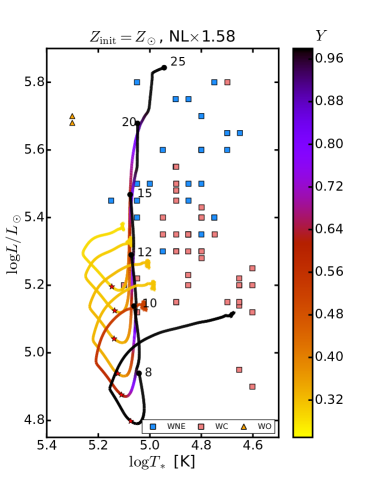
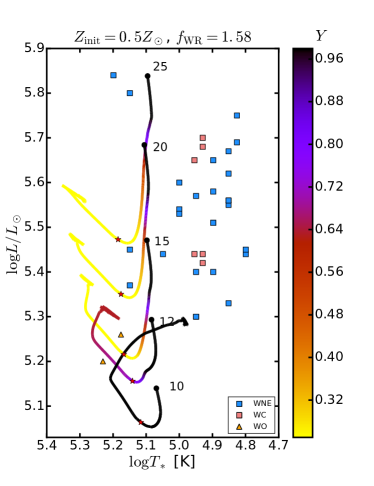
The evolutionary tracks of solar metallicity models on the Hertzsprung-Russel (HR) diagram are shown in Fig. 3. Let us first discuss the models with .
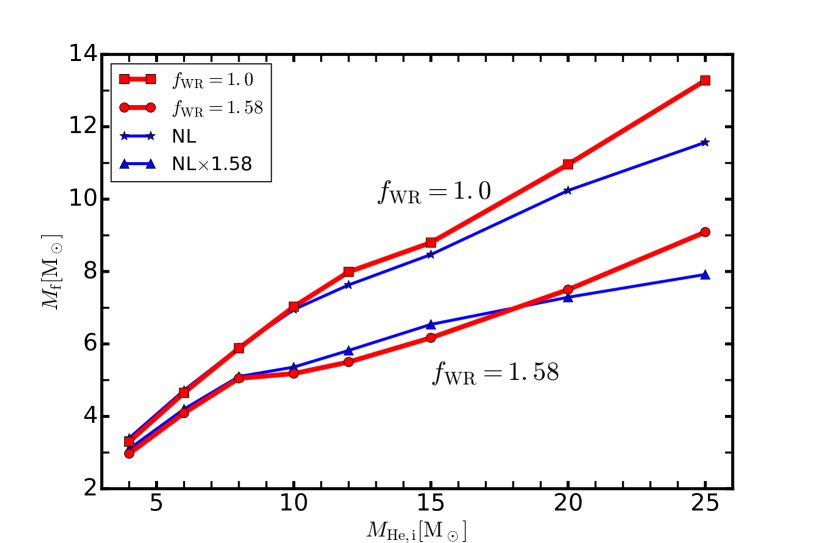
We notice some minor differences between the results with our new prescription and those with the NL prescription. The NL prescription gives somewhat higher mass loss rates for WNE stars of and for WC stars of than our prescription (Fig. 1). The relatively massive He stars () lose more mass with the NL prescription, as a result (Fig. 4). For example, the final mass of the 25 He star is 11.57 with the NL prescription and 13.28 with our prescription, respectively. For lower initial masses (), our prescription gives slightly higher mass-loss rates and the resultant final masses are lower, although the difference is very small.
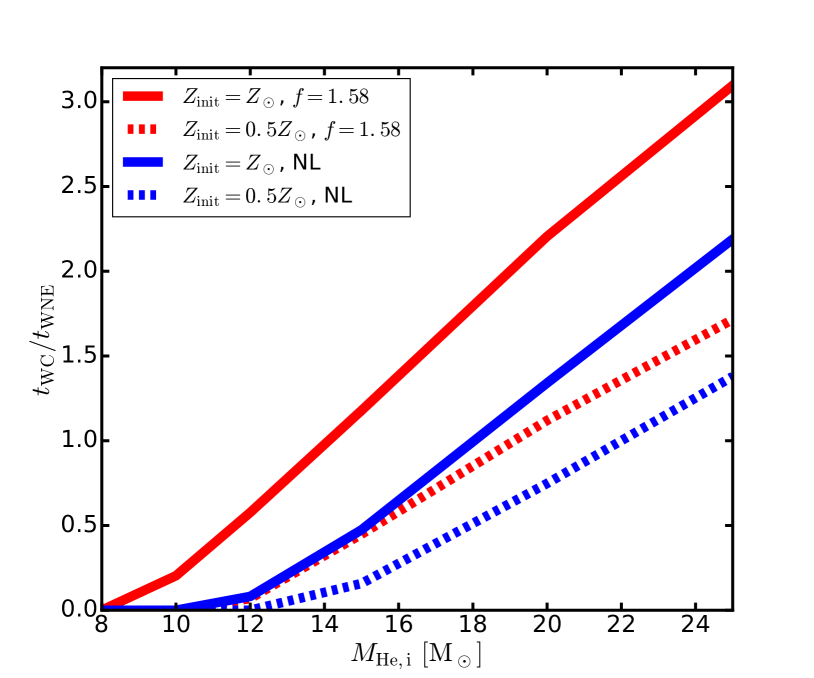
Comparison with the Galactic WR stars reveal that none of the NL and our prescription can properly explain the relatively faint WC stars (), of which the luminosities are lower than the faintest WNE star (). The 12 He star can make a WC star of which the luminosity can become as low as with the NL prescription, but the WC lifetime at this low luminosity is very short ( yr; Table 1; Fig. 5). None of the two prescriptions can produce a WC star with . Therefore, the large number fraction of WC stars of this low luminosity range cannot be explained with these models.
This discrepancy between the theoretical prediction and observation has already been noted by Sander et al. (2012). The Geneva group models (Meynet & Maeder, 2005; Georgy et al., 2012) where the standard mass-loss rate prescriptions for red supergiant stars and WR stars (i.e., de Jager and NL rates, respectively) were used fail to reproduce the observed luminosity range of WN and WC stars. In particular, WC stars are predicted to be systematically much more luminous () than Galactic WC stars in these studies.
Note that this problem cannot be solved by binarity. He stars of 8 – 12 having may be produced to become WN stars by binary interactions. But the subsequent evolution of these WN stars is largely determined by WR wind mass loss like single stars (e.g., Yoon et al., 2010; Eldridge et al., 2013; Yoon et al., 2017), and whether He stars are in binary systems cannot significantly affect our discussion. Furthermore, there is no apparent evidence for binarity with the WR sample in the figure, for which we excluded WR stars identified in binary systems.
In conclusion, the standard NL prescription gives too low mass-loss rates to explain relatively faint WC stars (). Revising the luminosity and chemical composition dependencies of the WR mass-loss rate does not improve the situation. Our new mass-loss rate prescription has only a minor effect on the evolution on the HR diagram, compared to the result with the NL prescription, although it has significant impact on SN Ib/Ic progenitor models (see Sect. 4 below).
3.2 Solar metallicity models with
Although great progress has been made in radiative transfer modelling of WR star atmospheres during the last two decades, the inferred mass-loss rates of WR stars still depend on some free parameters, including the wind velocity law and clumping factor (Puls et al., 2008). In particular, the mass-loss rate scales with the clumping factor as . Several studies prefer (e.g., Sander et al., 2012; Hainich et al., 2014), but it is not clear yet if the complex features resulting from hydrodynamic instabilities in the wind material can be well described by this single free parameter. This allows us to have some freedom in our choice of .
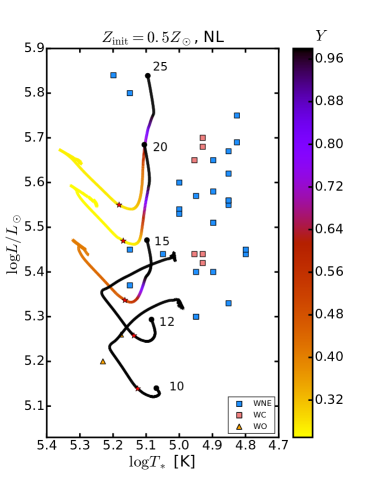
We get if we adopt following Hamann et al. (2006). In the lower panel of Fig. 3, evolutionary tracks of solar metallicity He star models with are presented.
One of the most striking features here is the downward evolution of He stars almost vertically on the HR diagram during the core helium burning phase. The dynamic range of the luminosity of a He star for a given initial mass is significantly enlarged (by more than a factor of 2) compared to the case of . For example, the 15 He star covers relatively wide luminosity ranges of and for WNE and WC, respectively. These ranges are reduced to for WNE and for WC, with .
Interestingly, with , the 15 He star model can roughly explain the lower limits of both WNE and WC star luminosities in the Potsdam sample ( 5.3 and 4.9, respectively). The zero-age main sequence (ZAMS) mass that corresponds to a 15 He star is about 30 – 40 depending on the degree of core overshooting on the main sequence. This ZAMS mass is high enough for a single star to lose its entire hydrogen envelope during the RSG phase (Meynet & Maeder, 2005; Georgy et al., 2012). Note also that, with , the lifetimes of WC stars can be longer than those of WNE for as shown in Fig. 5. This means that the large number of relatively faint WC stars () may be explained by the evolution of He stars of .
This points to the need of higher WR mass-loss rates than given by the standard NL prescription to better explain observations. More specifically, based on our result with , the observed WR population may be explained by the following scenario that is fully consistent with the Conti scenario. WNE stars of () are produced from single stars of via mass loss due to RSG winds, while lower ZAMS mass would not lead to formation of WR stars. WC stars are produced from these WNE stars by further mass loss during the core He-burning phase. This scenario can explain 1) the reason why WC stars are systematically less luminous than WN stars, and 2) the paucity of WNE stars and the large number of WC stars in the luminosity range of .
Sander et al. (2012) noted that models of Vanbeveren et al. (1998) can better explain the luminosity distribution of WC stars than those of the Geneva group. The mass-loss rate prescriptions adopted by Vanbeveren et al. provide much higher values for both RSG and WR stars than given by the commonly used prescriptions of de Jager et al. (1988) and NL. This supports our suggestion of increasing the WR mass-loss rate. However, the WR mass-loss rate prescription of Vanbeveren et al. (i.e., ) does not consider the difference between WN and WC stars, which is significant as discussed in Sect. 2.
In contrast, Vanbeveren et al. (2007) argued for the need of a decrease in WR mass-loss rates by a factor of two compared to those given by the NL prescription. This conclusion resulted from their comparison of the WC to WN number ratio between the prediction of their binary star population models and observations. But the WC sample by Sander et al. (2012) was not available at that time. A decrease in WR mass-loss rates would make the problem of the luminosity discrepancy between models and observations even worse. Note also that the prediction of the WC/WN ratio sensitively depends on many uncertain physical processes including overshooting, rotation, RSG mass loss, and binary interactions (Eldridge et al., 2008). The mass-loss rates of WNL stars would also play an important role here, which is not addressed in the present study. Therefore, we cannot make a detailed prediction on this with our new He star models because it requires full stellar evolution models from the zero-age main sequence (ZAMS). This should be a subject of future study.
In the initial and final mass diagram (Fig. 4), there is a notable change from in the slope of the line with . This results from the fact that He stars of undergo the WC phase where WR mass-loss rates are significantly enhanced compared to those of WN stars as discussed in Sect. 2. Compared to the result with the NL rate multiplied by 1.58 (Table 1), our prescription with results in lower final masses and surface He mass fractions for , because our prescription gives significantly higher mass-loss rates than the NL prescription for relatively faint WC stars (; Fig. 1), for a given scaling factor .
For , in contrast, our prescription leads to lower mass-loss rates in general and higher final masses than in the case of the 1.58NL prescription. The surface helium mass fractions are lower in these massive He star models because of the weaker dependence of the TSK prescription on , which we use for WC/WO stars. This leads to more stripping of the helium envelope during the final evolutionary stages where . Note also that the final mass of the 25 He star is 9.1 , which would be massive enough to form a BH. This implies that He stars of can produce a black hole (BH), and the problem with BHs in the old days (i.e, the difficulty in explaining stellar mass BHs with in BH binary systems at solar metallicity because of too high WR mass-loss rates; e.g., Nelemans & van den Heuvel 2001) would not occur with our moderate increase of WR mass-loss rates. We discuss implications of this result for SN Ib/Ic progenitors in Sect. 4 below.
3.3 LMC metallicity models with
LMC WR stars of WNE, WC and WO types on the HR diagram are shown in Fig. 6. Although WC stars of the Crowther sample (Crowther et al., 2002) have fairly high luminosities (), the two WO stars are very faint () compared to other WR stars in the LMC. Like in the case of Galactic WR stars, the standard NL prescription cannot explain these faint WO stars because He star models of this luminosity does not become He-poor at LMC metallicity. When using our prescription with , this luminosity limit is predicted to be , which agrees well with the observation.
In conclusion, an overall increase in WR mass loss rates may well explain the lower luminosity limits of WC/WO stars in both Galactic and LMC WR stars. As discussed below, this also leads to SN Ib/c progenitor models that are more consistent with observations than those with the NL prescription.
4 Implications for SN Ib/Ic progenitors
Our He star models can crudely predict the properties of SN Ib/Ic progenitors for both single and binary stars as long as This is because once such a hydrogen-poor star is made either by stellar wind mass loss from a single star or by mass transfer in a biary system, the subsequent evolution is governed by WR mass loss. This is particularly the case for sufficiently high metallicity (), for which the WNL phase is relatively short. Less massive He stars would undergo Case BB mass transfer in binary systems, in which case full binary star evolution models are needed to follow the pre-SN evolution. (e.g., Wellstein et al., 1999; Yoon et al., 2017).
The absence of helium lines in SNe Ic spectra implies that SN Ic progenitors are helium-poor at the pre-SN stage, while SN Ib progenitors retain fairly large amounts of helium. It is still not well known how much helium can be hidden in SN Ic spectra. Theoretical studies indicate that it depends on the degree of chemical mixing in the SN ejecta as well as on the progenitor mass (Woosley & Eastman, 1997; Dessart et al., 2012). The upper limit of helium mass in SNe Ic progenitors would be about 0.14 for well mixed, relatively low-mas SN ejecta (; Hasinger et al. 2012). It may reach about 1.0 if chemical mixing is only moderate and if the SN ejecta is sufficiently massive (Dessart et al., 2012), but observations commonly find signatures of strong mixing in core collapse SN ejecta. A fairly low helium to ejecta mass ratio would be therefore a prerequisite for SN Ic progenitors. A sufficiently low surface abundance of helium () is also needed for the suppression of helium lines during the early-time phase of a SN Ic (Dessart et al., 2011).
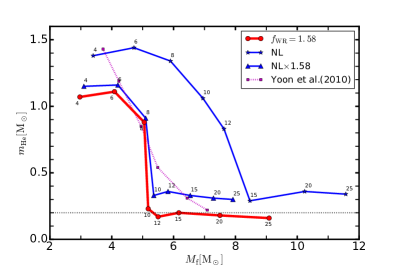
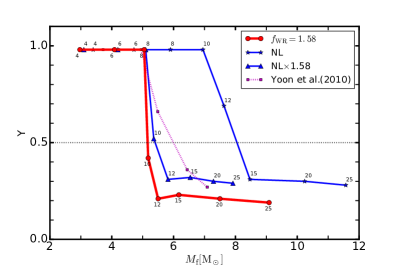
In Fig. 7, we present the helium mass in the last calculated models with . Here the helium mass does not mean the mass of the helium-rich envelope, but the integrated amount of helium: , where and denote the local helium mass fraction and the mass coordinate, respectively.
It is interesting that there exists a very sharp decrease in at around , which corresponds to . This rapid transition results from the fact that the mass-loss rate increases dramatically when He stars of WN type () turn into WC stars, which occurs for .
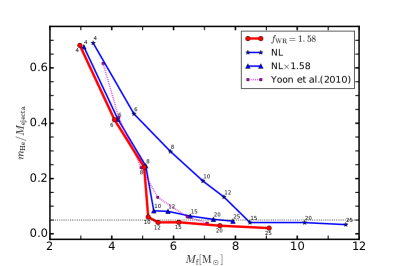
Note also that the predicted helium mass distribution in the case of is clearly bimodal: for and for . The former has and the latter . The helium to SN ejecta mass ratio in the latter case is lower than about 0.05. It is therefore reasonable to assume that the former and the latter lead to SNe Ib and Ic, respectively.
The standard NL prescription leads to for SNe Ic progenitors (assuming for SN Ic). Massive progenitors of would result in too broad light curves compared to those of ordinary SNe Ic (e.g., Dessart et al., 2017). Studies on SN light curves and spectra indicate that ordinary SNe Ic have ejecta masses less than about 5-6 (e.g., Drout et al., 2011; Cano, 2013; Taddia et al., 2015; Lyman et al., 2016), except for some extreme cases like iPTF15dtg (; Taddia et al. 2016). In this regard, our result with , which predicts for SN Ic progenitors, is in better agreement with observations than those with the NL prescription.
We can see the role of luminosity and dependencies of WR mass-loss rates through the comparison of and 1.58NL models in Fig. 7. Both cases lead to helium poor SN progenitors of similar final masses for , but the models with our new mass-loss rate prescription have systematically lower helium masses and . This is because the TSK rate, which we adopt during the WC phase, has much weaker luminosity and dependencies than those of NL.
The role of the dependence is more clearly found when our result is compared with the He star models by Yoon et al. (2010, Fig. 7). They applied the WR mass-loss rate prescription by Hamann et al. (1995) with a reduction factor of 5. This prescription does not consider the systematic difference between WNE and WC mass-loss rates, only having a luminosity dependence of . Therefore, a He star with this prescription does not undergo mass-loss enhancement during the WC phase but the mass-loss rate continuously decrease as the luminosity of the He star decreases due to mass loss. These models have final masses similar to those of our new models with . However, the helium mass () in the final model continuously decreases as a function of the final mass, in contrast to our case where a bimodal distribution of is found.
This comparison illustrates the importance of fine details of the mass-loss rate prescription for the prediction of SNIb/Ic progenitor properties. In particular, we reach the following important conclusion when we consider the fact that WC stars have systematically stronger mass loss than WNE stars: SN Ib and SN Ic progenitors are distinctively different from each other in terms of the helium mass and the surface helium abundance, rather than they form a continuous sequence.
5 Problem of the temperature discrepancy
In our comparison between models and observations on the HR diagram, we have focused on the luminosity and ignored the temperature discrepancy. In fact, our hydrogen-free WR star models predict systematically higher surface temperatures than the observationally inferred values (Fig. 3 and 6). This discrepancy is found not only with our models, but with all stellar evolution models (e.g., Hamann et al., 2006; Sander et al., 2012; Hainich et al., 2014).
Recently, Gräfener et al. (2012) suggested that the outermost layers of WR stars may be more inflated than predicted by standard stellar evolution models (e.g., Ishii et al., 1999; Petrovic et al., 2006), if the opacity in the sub-surface convective zone is enhanced due to density clumping. McClelland & Eldridge (2016) found that including this clumping effect in WR star models may help reduce the temperature discrepancy. They also found that the mass-loss rate of WR stars should be significantly reduced to have surface temperatures compatible with observations. This is because the envelope inflation tends to be suppressed with strong mass loss (Petrovic et al., 2006).
This leads us to the following dilemma. Increasing the WR mass-loss rate as suggested in the present study would alleviate the luminosity discrepancy (i.e., the luminosity range of WC/WO stars) but instead aggravate the temperature discrepancy, and vice versa. Compared to our approach that focuses on the luminosity, McClelland & Eldridge (2016) paid more attention to the surface temperature in their comparison of models and observations. This made them suggest that hot WO stars are produced by mass loss, and that relatively cool WC stars are helium giant stars of relatively low-mass, of which the surfaces are enriched with carbon by chemical mixing. This scenario has the following disadvantages.
- 1.
-
2.
Some WO stars in the LMC are very faint compared to WN stars (; Fig. 6). We cannot explain these WO stars by helium giants but need to invoke strong mass loss as discussed above.
-
3.
To explain WC stars of with helium giants, we need . He stars of this low mass can be produced only in binary systems. But not all of such faint WC stars are found in binary systems (Sander et al., 2012).
More importantly, having an optically thick expanding atmosphere, a WR star does not have a well defined surface. In the literature, the inner boundary of the atmosphere model where the optical depth is very large (e.g., in the Potsdam models) is considered as the surface of the hydrostatic core of a WR star and the corresponding temperature is compared with the values given by stellar evolution models. This means that the property of this inner boundary cannot be directly inferred from the spectrum and certain degeneracy between some model parameters is inevitable for very dense winds (e.g., see Hamann et al., 2006; Groh et al., 2014, for detailed discussion). On the other hand, the luminosity measurements are largely limited by the distance uncertainty. In the Potsdam Galactic WR sample of Fig. 3, distances to some WR stars are known from their cluster membership. The distances to the other WR stars, including the faintest WC stars with , were inferred from their spectral types (Hamann et al., 2006; Sander et al., 2012). This uncertainty should be added as a caveat to our discussion on Galactic WR stars in Sect. 3. Future distance measurements with GAIA would help resolve this issue. For LMC WR stars, the distance uncertainty is much smaller and our approach of giving more weight to the luminosity than to the surface temperature in the comparison between models and observations may be justified (see also Sander et al., 2012, for a related discussion). We plan to address the issue of envelope inflation and surface temperature of WR stars in more detail in a forthcoming paper.
6 Conclusions
We draw the following conclusions from our discussion.
-
•
The luminosity and initial metallicity dependencies of WNE mass-loss rates are significantly steeper than those of WC/WO mass-loss rates. In addition, WC stars have systematically higher mass loss rates than those of WNE stars. To properly consider these factors, we suggest using a new mass-loss rate prescription that combines the WNE mass-loss rate prescription inferred from the Potsdam WNE sample and the TSK prescription for WC/WO mass-loss rates.
-
•
In addition to these fine details, an overall increase of the WR mass-loss rate is needed to explain the formation of relatively faint WC/WO stars in our galaxy and LMC (i.e., ). We find that only a moderate increase by about 60 per cent (i.e., ) is enough to reproduce the observed luminosity range of WC/WO stars, which cannot be easily accommodated with the standard NL prescription.
-
•
He star models with this increase of the WR mass-loss rate using our new prescription can better explain the properties of SN Ib/Ic supernova progenitors than those with the standard NL prescription, in terms of final masses and chemical composition. We also find a clear bimodal distribution of helium masses and surface helium mass fractions in the new SN progenitor models. This implies that the properties of SN Ib and SN Ic progenitors would be distinctively different.
In the present study, we have limited our discussion to the case of hydrogen-free WR stars. In reality, WR stars are born with some amounts of hydrogen left in the outermost layers, and may spend not a small fraction of the helium burning lifetime as WNL before they become WNE stars. Therefore, our analysis should be extended to WNL stars in the near future to study the full evolution from ZAMS to the pre-SN stage for further confirmation of our conclusions. This would also allow us to investigate the metallicity dependence of the WR population (e.g., WN/WC ratio as a function of metallicity) and hydrogen-poor SN progenitors, which cannot be properly addressed with our He star models.
| [] | [ yr] | [ yr] | [ yr] | [] | [] | [K] | [] | [] | |||
| 4.00 | 13.01 | 13.01 | 0.00 | 3.30 | 4.73 | 4.41 | 1.88 | 1.29 | 0.98 | -3.42 | -3.47 |
| 6.00 | 8.69 | 8.69 | 0.00 | 4.65 | 5.03 | 4.63 | 2.95 | 1.39 | 0.98 | -3.78 | -3.16 |
| 8.00 | 6.88 | 6.88 | 0.00 | 5.88 | 5.18 | 4.71 | 3.99 | 1.32 | 0.98 | -3.78 | -3.16 |
| 10.00 | 5.91 | 5.91 | 0.00 | 7.03 | 5.30 | 4.70 | 4.99 | 1.10 | 0.98 | -3.78 | -3.16 |
| 12.00 | 5.32 | 5.19 | 0.13 | 7.99 | 5.37 | 4.90 | 6.02 | 0.70 | 0.83 | -0.86 | -2.31 |
| 15.00 | 4.78 | 3.48 | 1.29 | 8.80 | 5.41 | 5.13 | 6.83 | 0.25 | 0.32 | -0.29 | -0.85 |
| 20.00 | 4.23 | 2.15 | 2.08 | 10.96 | 5.55 | 5.31 | 8.65 | 0.27 | 0.25 | -0.29 | -0.68 |
| 25.00 | 3.88 | 1.54 | 2.34 | 13.28 | 5.67 | 5.30 | 10.50 | 0.26 | 0.23 | -0.30 | -0.63 |
| 4.00 | 13.76 | 13.76 | 0.00 | 2.97 | 4.68 | 4.28 | 1.79 | 1.07 | 0.98 | -3.42 | -3.47 |
| 6.00 | 9.08 | 9.08 | 0.00 | 4.09 | 4.97 | 4.56 | 2.66 | 1.11 | 0.98 | -3.78 | -3.16 |
| 8.00 | 7.22 | 7.22 | 0.00 | 5.05 | 5.11 | 4.68 | 3.47 | 0.88 | 0.98 | -3.78 | -3.15 |
| 10.00 | 6.27 | 5.21 | 1.06 | 5.18 | 5.12 | 4.98 | 3.99 | 0.23 | 0.42 | -0.33 | -1.10 |
| 12.00 | 5.77 | 3.66 | 2.11 | 5.50 | 5.18 | 5.07 | 4.15 | 0.17 | 0.21 | -0.27 | -0.65 |
| 15.00 | 5.25 | 2.41 | 2.84 | 6.17 | 5.22 | 5.12 | 4.69 | 0.20 | 0.23 | -0.27 | -0.68 |
| 20.00 | 4.68 | 1.46 | 3.22 | 7.50 | 5.33 | 5.24 | 5.78 | 0.18 | 0.21 | -0.28 | -0.62 |
| 25.00 | 4.26 | 1.05 | 3.22 | 9.09 | 5.43 | 5.28 | 7.11 | 0.16 | 0.19 | -0.29 | -0.56 |
| NL | |||||||||||
| 4.00 | 12.60 | 12.60 | 0.00 | 3.40 | 4.75 | 4.43 | 1.89 | 1.38 | 0.98 | -3.42 | -3.47 |
| 6.00 | 8.59 | 8.59 | 0.00 | 4.72 | 5.03 | 4.68 | 3.01 | 1.44 | 0.98 | -3.78 | -3.16 |
| 8.00 | 6.83 | 6.38 | 0.00 | 5.90 | 5.16 | 4.75 | 4.01 | 1.34 | 0.98 | -3.78 | -3.16 |
| 10.00 | 5.91 | 5.91 | 0.00 | 6.95 | 5.30 | 4.71 | 4.99 | 1.06 | 0.98 | -3.78 | -3.16 |
| 12.00 | 5.32 | 4.92 | 0.40 | 7.63 | 5.35 | 5.02 | 5.85 | 0.53 | 0.69 | -0.57 | -1.75 |
| 15.00 | 4.86 | 3.12 | 1.68 | 8.47 | 5.42 | 5.08 | 6.46 | 0.29 | 0.31 | -0.29 | -0.83 |
| 20.00 | 4.33 | 1.85 | 2.48 | 10.24 | 5.52 | 5.29 | 7.98 | 0.36 | 0.30 | -0.29 | -0.79 |
| 25.00 | 4.05 | 1.27 | 2.78 | 11.57 | 5.58 | 5.28 | 9.11 | 0.34 | 0.28 | -0.30 | -0.74 |
| NL | |||||||||||
| 4.00 | 13.53 | 13.53 | 0.00 | 3.10 | 4.71 | 4.35 | 1.85 | 1.15 | 0.98 | -3.42 | -3.47 |
| 6.00 | 8.99 | 8.99 | 0.00 | 4.20 | 4.97 | 4.60 | 2.72 | 1.16 | 0.98 | -3.78 | -3.16 |
| 8.00 | 7.21 | 7.21 | 0.00 | 5.10 | 5.12 | 4.68 | 3.49 | 0.91 | 0.98 | -3.78 | -3.16 |
| 10.00 | 6.28 | 5.15 | 1.13 | 5.36 | 5.14 | 5.03 | 4.04 | 0.33 | 0.52 | -0.39 | -1.31 |
| 12.00 | 5.80 | 3.49 | 2.31 | 5.82 | 5.21 | 4.98 | 4.24 | 0.26 | 0.31 | -0.28 | -0.87 |
| 15.00 | 5.32 | 2.19 | 3.12 | 6.54 | 5.28 | 5.00 | 4.84 | 0.33 | 0.32 | -0.29 | -0.86 |
| 20.00 | 4.88 | 1.26 | 3.62 | 7.29 | 5.34 | 5.07 | 5.47 | 0.31 | 0.30 | -0.29 | -0.81 |
| 25.00 | 4.64 | 0.88 | 3.77 | 7.92 | 5.38 | 5.11 | 6.03 | 0.30 | 0.29 | -0.29 | -0.76 |
Each column has the following meaning. : the initial mass of the helium star, : the whole evolutionary time of the helium star, : the lifetime of the WNE phase, : the lifetime of the WC phase, : the total mass of the last calculated model (i.e., the final mass), : the luminosity of the last calculated model, : the surface temperature of the last calculated model, : the CO core mass in the last calculated model, : the integrated helium mass in the last calculated model (i.e., ), : the surface mass fraction of helium in the last calculated model, : the surface mass fraction of carbon in the last calculated model, : the surface mass fraction of oxygen in the last calculated model.
| [] | [ yr] | [ yr] | [ yr] | [] | [] | [K] | [] | [] | |||
| 10.00 | 6.06 | 6.06 | 0.00 | 6.90 | 5.29 | 4.98 | 4.93 | 1.03 | 0.99 | -4.08 | -3.46 |
| 12.00 | 5.44 | 5.08 | 0.35 | 7.51 | 5.32 | 5.23 | 5.85 | 0.45 | 0.63 | -0.48 | -1.55 |
| 15.00 | 4.94 | 3.41 | 1.53 | 8.08 | 5.37 | 5.27 | 6.26 | 0.17 | 0.19 | -0.28 | -0.57 |
| 20.00 | 4.43 | 2.09 | 2.34 | 9.64 | 5.47 | 5.31 | 7.54 | 0.19 | 0.21 | -0.28 | -0.59 |
| 25.00 | 4.10 | 1.51 | 2.59 | 11.39 | 5.57 | 5.31 | 9.01 | 0.20 | 0.19 | -0.30 | -0.54 |
| NL | |||||||||||
| 10.00 | 5.92 | 5.92 | 0.00 | 7.58 | 5.33 | 5.00 | 5.42 | 1.37 | 0.99 | -4.08 | -3.47 |
| 12.00 | 5.32 | 5.32 | 0.00 | 8.73 | 5.44 | 5.01 | 6.51 | 1.11 | 0.99 | -4.08 | -3.47 |
| 15.00 | 4.77 | 4.12 | 0.65 | 9.52 | 5.44 | 5.27 | 7.47 | 0.26 | 0.41 | -0.32 | -1.01 |
| 20.00 | 4.30 | 2.46 | 1.84 | 11.49 | 5.56 | 5.26 | 9.05 | 0.35 | 0.25 | -0.29 | -0.67 |
| 25.00 | 4.02 | 1.69 | 2.33 | 12.79 | 5.64 | 5.29 | 10.22 | 0.33 | 0.27 | -0.29 | -0.68 |
Acknowledgements
The author is grateful to Andreas Sander, who refereed this paper, for his constructive comments, to Frank Tramper for helpful discussion, to JJ Eldridge for his careful reading of the manuscript and useful comments, and to Alexander Heger and the Monash Center for Astrophysics for the support by the distinguished vistor program. This work was supported by the Korea Astronomy and Space Science Institute under the R&D program (Project No. 3348- 20160002) supervised by the Ministry of Science, ICT and Future Planning.
References
- Brott et al. (2011) Brott, I., de Mink, S.E., & Cantiello, M. et al. 2011, A&A, 530, 115
- Cano (2013) Cano, Z. 2013, MNRAS, 434, 1098
- Conti (1976) Conti, P.S. 1976, in Proc. 20th Collq. Int. Astrlphys.Liége, p. 193, Univ. Liége
- Crowther et al. (2002) Crowther, P.A., Dessart, L., Hillier, D.J., Abott, J.B., & Fullerton, A.w. 2002, A&A, 392, 653
- Crowther (2007) Crowther, P.A. 2007, ARA&A, 45, 177
- de Jager et al. (1988) de Jager, C., Nieuwenhuijzen, H., & van der Hucht, K.A. 1988, A&AS, 72, 259
- Dessart et al. (2012) Dessart, L., Hillier, D.J., Li, C., & Woosley, S.E. 2012, MNRAS, 424, 2139
- Dessart et al. (2011) Dessart, L., Hillier, D.J., Livne, E., Yoon, S.-C., Woosley, S.E., Waldman, R., & Langer, Nl. 2011, MNRAS, 414, 298
- Dessart et al. (2017) Dessart, L., Hillier, D.J., Yoon, S.-C., Waldman, R., & Livne, E. 2017, A&A, in press, [arXiv:1703.08932]
- Drout et al. (2011) Drout, M.R. Soderberg, A.M, Gal-Yam, A., et al. 2011, ApJ, 741, 97
- Eldridge & Vink (2006) Eldridge, J.J., & Vink, J.S. 2006, A&A, 452, 295
- Eldridge et al. (2008) Eldridge, J.J., Izzard, R.G., & Tout, C.A. 2008, MNRAS, 384, 1109
- Eldridge et al. (2013) Eldridge, J.J., Fraser, M., Smartt, S.J., Mound, J.R., & Crockett, R. M. 2013, MNRAS, 436, 774
- Georgy et al. (2012) Goergy, C., Eiström, S., Meynet, G., Massey, P., Levesque, E.M., Hirschi, R., Eggenberger, P., & Maeder, A. 2012, A&A, 542, A29
- Gräfener & Hamann (2005) Gräfener, G., & Hamann, G. 2005, A&A, 432, 633
- Gräfener & Hamann (2008) Gräfener, G., & Hamann, G. 2008, A&A, 482, 945
- Gräfener et al. (2012) Gräfener, G., Owocki, S.P., Vinak, J.S. 2012, A&A, 538, A40
- Groh et al. (2014) Groh, J.H., Meynet, G., Ekström, S., Georgy, C. 2014, A&A, 564, 30
- Hainich et al. (2014) Hainich, R., Rühling, U., Todt, H., Oskinova, L.M., Liermann, A., Gräfener, G., Foellmi, C., Schnurr, O., & Hamann, W.-R. 2014, A&A, 565, A27
- Hamann & Koesterke (1998) Hamann, W.-R., & Koesterke, L. 1998, A&A, 335, 1003
- Hamann et al. (1995) Hamann, W.-R., Koesterke, L., & Wessolowski, U. 1995, A&A, 299, 151
- Hamann et al. (2006) Hamann, W.-R., Gräfener, G., & Liermann, A. 2006, A&A, 457, 1015
- Hasinger et al. (2012) Hashinger, S., Mazzalli, P.A., Taubenberger, S., Hillebrandt, W., Nomoto, K., & Sauer, D.N. 2012, MNRAS, 422, 70
- Ishii et al. (1999) Ishii, M., Ueno, M., & Kato, M. 1999, PASJ, 51, 417
- Langer (1989) Langer, N. 1989, A&A, 220, 135
- Lépine & Moffat (1999) Lépine, S., & Moffat, A.F.J. 1999, ApJ, 514, 909
- Lyman et al. (2016) Lyman, J., Bersier, D., James, P.A., Mazzali, P.A., Eldridge, J.J., Fraser, M., & Pian, E. 2016, MNRAS, 457, 328
- Maeder & Meynet (1987) Maeder, A., & Myenet, G. 1987, A&A, 182, 243
- Meynet & Maeder (2005) Meynet, G., & Maeder, A. 2005, A&A, 429, 581
- McClelland & Eldridge (2016) McClelland, L.A.S., & Eldridge, J.J. 2016, MNRAS, 459, 1505
- Moffat & Robert (1994) Moffat, A.F.J. & Robert, C. 1994, ApJ, 421, 310
- Nelemans & van den Heuvel (2001) Nelemans, G., & van den Heuvel, E.P.J. 2001, A&A, 376, 950
- Nugis & Lamers (2000) Nugis, T., & Lamers, H.J.G.L.M. 2000, A&A, 360, 227 (NL)
- Paxton et al. (2011) Paxton, B., Bildsten, L., Dotter, A., Herwig, F., Lesaffre, P., & Timmes, F. 2011, ApJS, 192, 3
- Petrovic et al. (2006) Petrovic, J., Pols, O., & Langer, N. 2006, A&A, 450, 219
- Podsiadlowski et al. (1992) Podsiadlowski, Ph., Joss, P.C., & Hsu, J.J.L. 1992, ApJ, 391, 246
- Puls et al. (2008) Puls, J., Vink, J.S., & Najarro, F. 2008, A&ARv, 16, 209
- Sander et al. (2012) Sander, A., Hamann, W.-R., & Todt, H. 2012, A&A, 540, A144
- Steiner & Oliveira (2005) Steiner, J.E., & Oliveira, A.S. 2005, A&A, 444, 895
- Taddia et al. (2016) Taddia, F., Fremling, C., Sollerman, J. et al. 2016, A&A, 592, A89
- Taddia et al. (2015) Taddia, F., Sollerman, J., Leloudas, G., et al. 2015, A&A, 574, A60
- Tramper et al. (2016) Tramper, F., Sana, H., & de Koter, A. 2016, ApJ, 833, 133 (TSK).
- Tramper et al. (2015) Tramper, F., Straal, S.M., Sanyal, D., Sana, H., de Koter, A., Gräfener, G., Langer, N., Vink, J.S., de Mink, S.E., Kaper, L. 2015, A&A, 581, 110
- Vanbeveren et al. (2007) Vanbeveren, D., Van Bever, J., & Belkus, H. 2007, ApJ, 662, L107
- Vanbeveren et al. (1998) Vanbeveren, D., De Donder, E., Van Bever, J., Van Rensbergen, W., & De Loore, C. 1998, New Astron., 3, 443
- Vink & de Koter (2005) Vink, J.S., & de Koter, A. 2005, A&A, 442, 587
- Wellstein et al. (1999) Wellstein, S., & Langer, N. 1999, A&A, 350, 148
- Woosley et al. (1993) Woosley, S.E., Langer, N., & Weaver, T.A. 1993, ApJ, 411, 823
- Woosley & Eastman (1997) Woosley, S.E., & Eastman, R.G., 1997, in Thermonuclear Supernovae, Ruiz-Lapuente P., Canal R., Isern J., eds, NATO ASI Proc. Series C., Vol. 486, p. 821
- Yoon (2015) Yoon, S.-C., 2015, Publ. Astron. Soc. Australia, 32, 15
- Yoon et al. (2017) Yoon, S.-C., Dessart, L., & Clocchiatti, A. 2017, ApJ, 840,10
- Yoon et al. (2012) Yoon, S.-C., Gräfener, G., Vink, J. S., Kozyreva, A., & Izzard, R. G. 2012, A&A, 544, L11
- Yoon et al. (2010) Yoon, S.-C., Woosley, S. E., & Langer, N. 2010, ApJ, 725, 940