Dust emission at 8 m and 24 m as Diagnostics of Hii Region Radiative Transfer
Abstract
We use the Spitzer SAGE survey of the Magellanic Clouds to evaluate the relationship between the 8 m PAH emission, 24 m hot dust emission, and Hii region radiative transfer. We confirm that in the higher-metallicity Large Magellanic Cloud, PAH destruction is sensitive to optically thin conditions in the nebular Lyman continuum: objects identified as optically thin candidates based on nebular ionization structure show 6 times lower median 8 m surface brightness (0.18 mJy arcsec-2) than their optically thick counterparts (1.2 mJy arcsec-2). The 24 m surface brightness also shows a factor of 3 offset between the two classes of objects (0.13 vs 0.44 mJy arcsec-2, respectively), which is driven by the association between the very small dust grains and higher density gas found at higher nebular optical depths. In contrast, PAH and dust formation in the low-metallicity Small Magellanic Cloud is strongly inhibited such that we find no variation in either 8 m or 24 m emission between our optically thick and thin samples. This is attributable to extremely low PAH and dust production together with high, corrosive UV photon fluxes in this low-metallicity environment. The dust mass surface densities and gas-to-dust ratios determined from dust maps using Herschel HERITAGE survey data support this interpretation.
Subject headings:
radiative transfer — stars: massive — dust, extinction — Hii regions — galaxies: ISM — Magellanic Clouds1. Introduction
The ionizing radiation from massive stars has fundamental consequences on scales ranging from individual circumstellar disks to the ionization state of the entire universe. On galactic scales, the escape fraction of Lyman continuum radiation from galaxies is crucial to the ionization state of the intergalactic medium and cosmic reionization of the early universe; and radiative feedback is also a major driver for the energetics and phase balance of the interstellar medium (ISM) in star-forming galaxies. Thus, determining the fate of ionizing photons from high-mass stars is critical to understanding the formation and evolution of galaxies throughout cosmic time.
Within star-forming galaxies, it has long been recognized that the diffuse, warm ionized medium (WIM), which is the most massive component of ionized gas in galaxies (Walterbos, 1998), is energized by OB stars (e.g. Haffner et al., 2009). The WIM is a principal component of the multi-phase ISM, and strongly prescribes galactic ecology, which drives evolutionary processes like star formation and galactic dynamics. The standard paradigm is that the WIM is powered both by ionizing radiation escaping from classical Hii regions, and by field OB stars (e.g. Oey & Kennicutt, 1997; Hoopes & Walterbos, 2000). While additional ionizing sources are sometimes suggested, it is clear that only massive stars can provide enough power to generate the WIM (e.g. Reynolds, 1984), although other mechanisms may be secondary contributors.
The relative importance of optically thin Hii regions vs field star ionization of the WIM is still poorly understood. Comparison of predicted and observed Hii region luminosities in nearby galaxies had suggested that both sources are not only viable, but necessary (Oey & Kennicutt, 1997; Hoopes & Walterbos, 2000; Hoopes et al., 2001). However, modern stellar atmosphere models for massive stars (e.g. Martins et al., 2005; Pauldrach et al., 2001) exhibit lower ionizing fluxes than those of the previous generation, casting doubt that a significant fraction of classical Hii regions are density-bounded (optically thin; Voges et al., 2008). On the other hand, Wood & Mathis (2004) find that the emission-line spectrum of the WIM is consistent with the harder spectral energy distributions (SEDs) expected from density-bounded Hii regions, and studies of radiative transfer in the global ISM suggest that ionizing radiation travels over long path lengths, on the order of hundreds of pc in the galactic plane, and 1 – 2 kpc outside the plane (e.g. Collins & Rand, 2001; Zurita et al., 2002; Seon, 2009). It is also well-known that the WIM surface brightness is highest around Hii regions (Ferguson et al., 1996).
We recently developed the technique of ionization-parameter mapping (IPM) to more directly evaluate nebular optical depth in the Lyman continuum (Pellegrini et al., 2012). This technique uses emission-line ratio maps to determine the nebular ionization structure, and hence, infer the optical depth. For conventional, optically thick Strömgren spheres, there is a transition zone between the central, highly excited region and the neutral environment. These transition zones are characterized by a strong decrease in the ionization state, and hence, the gas ionization parameter, which is the ratio of radiation energy density to gas density. Objects that are optically thick to ionizing photons reflect stratified ionization structure, showing low-ionization envelopes around highly ionized central regions. In contrast, optically thin nebulae will exhibit weak or nonexistent lower-ionization transition zones, and thus they show high ionization projected across the entire object. These usually show irregular and disrupted morphology, which is consistent with radiation-MHD simulations by Arthur et al. (2011) for highly ionized Hii regions.
This simple IPM technique allowed us to estimate the optical depths of the Hii regions in the Magellanic Clouds using H, [Oiii] 4959,5007, and [Sii] 6717,6732 data from the Magellanic Clouds Emission-Line Survey (MCELS; Smith et al., 2005).We were thus able to determine that optically thick nebulae dominate at low H luminosity, while high-luminosity objects are mostly optically thin, dominating at luminosities above in both galaxies (Pellegrini et al., 2012). This implies that most of the bright Hii regions observed in star-forming galaxies are optically thin. Similarly, we found that the frequency of optically thick Hii regions strongly correlates with Hi column, although at the lowest (Hi), the optically thin objects dominate. Thus, despite strongly differing properties of the neutral ISM of these galaxies, the quantitative properties of the nebular radiative transfer are remarkably similar. Our results demonstrate that IPM is a vivid and powerful tool for constraining the optical depth to ionizing radiation (Pellegrini et al., 2012). However, we need to further evaluate this technique and understand it in the context of other ISM properties and diagnostics.
In particular, dust properties are a significant factor in the radiative transfer of ionizing radiation, and they also offer multifaceted probes of this process. Polycyclic aromatic hydrocarbon (PAH) emission is sensitive to Lyman continuum radiation and is destroyed by it (e.g., Tielens, 2008), while larger dust grains absorb and re-emit this radiation. We therefore use 8 m and 24 m data from the Spitzer survey of the Magellanic Clouds, SAGE [Surveying the Agents of Galaxy Evolution; (Meixner et al., 2006)], and dust maps from Gordon et al. (2014) based on the analogous far-infrared Herschel survey, HERITAGE [Herschel Inventory of The Agents of Galaxy Evolution; (Meixner et al., 2013)] to examine the Lyman continuum radiative transfer.
2. 8 m PAH Emission
The 8 m bandpass probes the bright, 7.7 m and 8.6 m PAH features, particularly ionized PAHs (e.g., Li & Draine, 2001a). Bauschlicher et al. (2008, 2009) attribute the 7.7 m band to C-C stretch and C-H in-plane bending vibrations in small and large charged PAHs, and the 8.6 m emission to C-H in-plane bending vibrations in large, charged, compact PAH molecules ( C atoms). In the Large Magellanic Cloud (LMC), PAH emission is typically an order of magnitude brighter than other contributions to this band in both star-forming and diffuse ISM (Bernard et al., 2008). Even in the low-metallicity SMC, spectral analysis of objects with low PAH fractions shows that these emission features still dominate the continuum (Sandstrom et al., 2010).
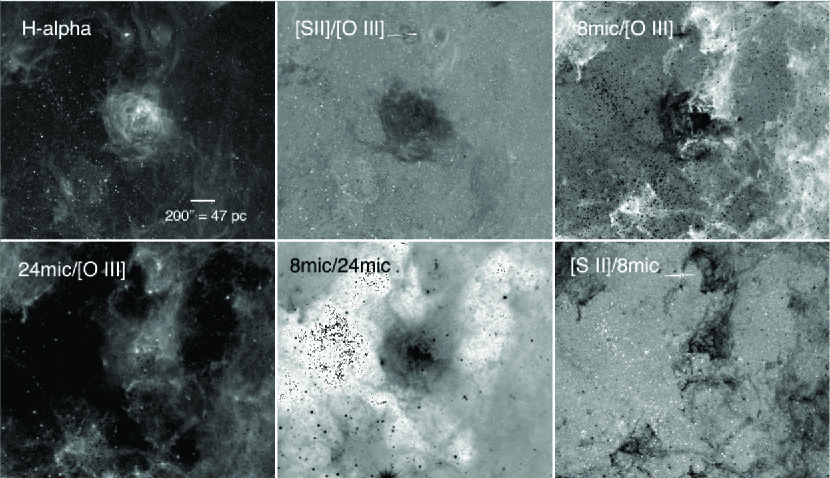
PAHs are generally found to be anticorrelated with ionized gas, indicating that they are destroyed by ionizing radiation (e.g., Povich et al., 2007; Pavlyuchenkov et al., 2013). Indeed, aromatics are a major component of the Lyman continuum opacity (Li & Draine, 2001b). We therefore expect that optically thin Hii regions should show less PAH emission in their peripheries relative to optically thick objects. Thus, the spatial distribution of PAHs near optically thin Hii regions might behave similarly to that of low-ionization atomic species. Therefore, mapping of 8 m PAH emission relative to a high-ionization atomic species (e.g., [Oiii]) might yield results similar to ionization-parameter mapping based on a low-to-high ionization ratio map as done by Pellegrini et al. (2012). Figure 1 shows example 8m/[Oiii] ratio maps of an Hii region simulated with Cloudy (Ferland et al., 2013). We show an object ionized by an O6 V star for Lyman continuum optical depths of and 20. This figure is analogous to Figure 2 of Pellegrini et al. (2012), and illustrates that, in principle, 8m/[Oiii] should behave similarly to [Sii]/[Oiii]. In what follows, we use the high-quality, 8 m residual images from the SAGE survey (Gordon et al., 2011; Meixner et al., 2006), for which the stellar point sources were removed via PSF fitting (Sewilo et al., 2009), alleviating stellar contamination.
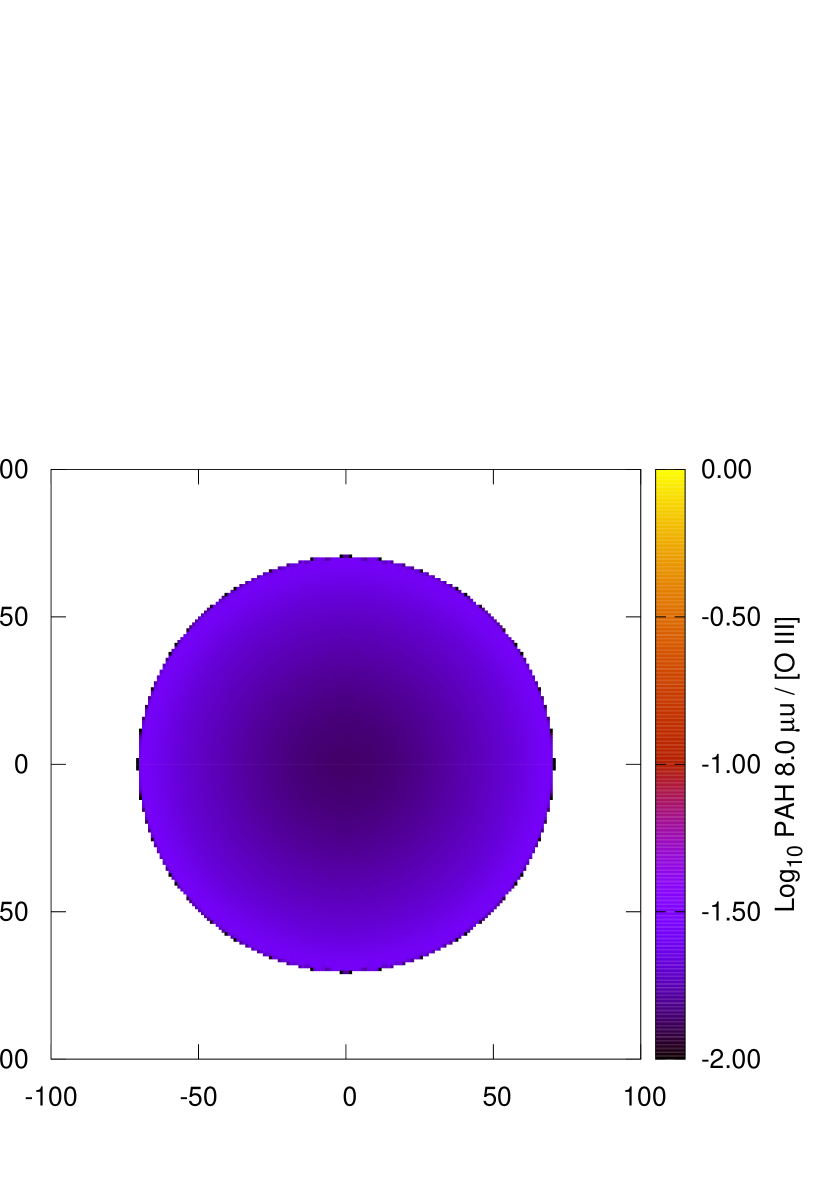
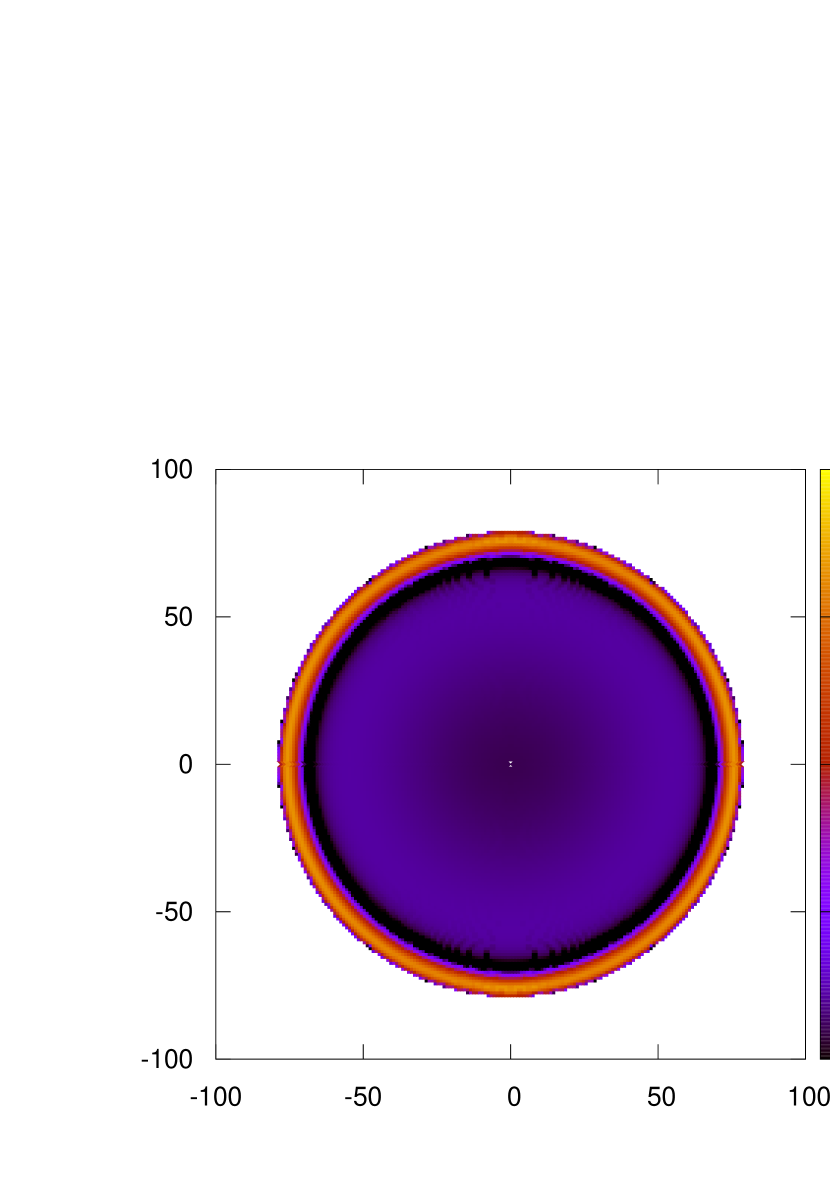
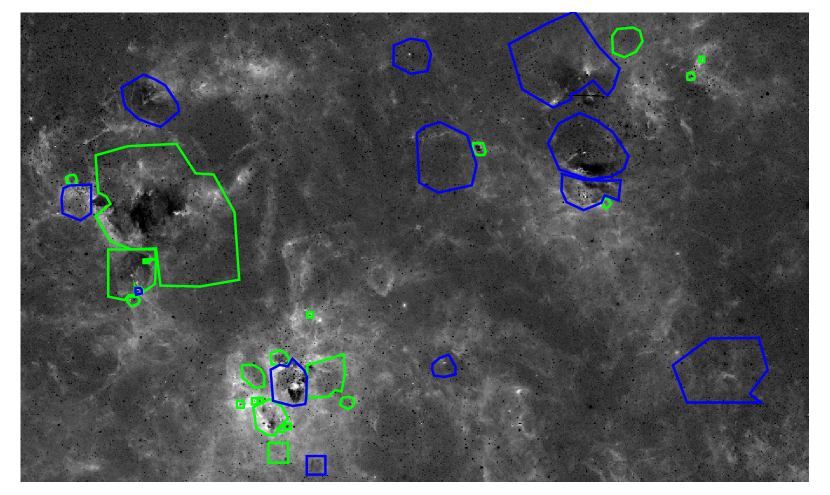
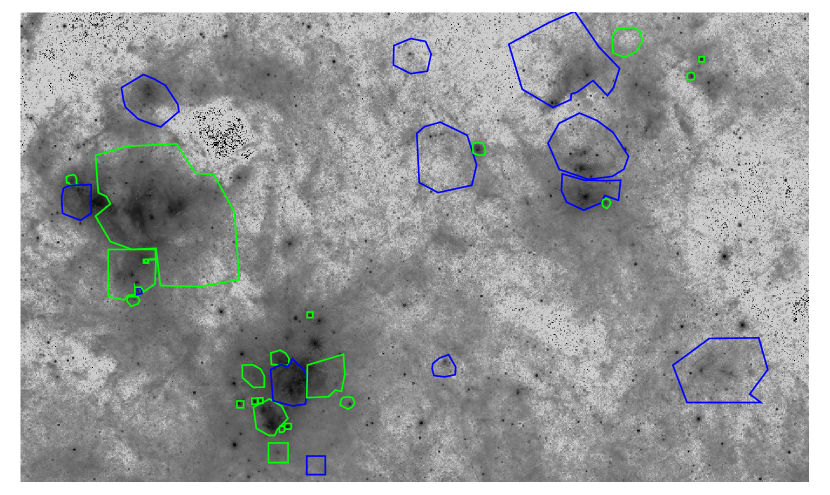
Figure 2 (top panel) shows the 8m/[Oiii] ratio map for a region in the LMC, constructed from the continuum-subtracted SAGE image and the [Oiii] image from the MCELS survey (Smith et al., 2005); white indicates high values. The apertures defining the Hii regions from Pellegrini et al. (2012) are overplotted, with green and blue showing optically thick and thin objects, respectively, as determined by IPM in that work. Figure 2 shows that objects previously identified as optically thin tend to show less PAH emission compared to those identified as optically thick.
Using the same continuum-subtracted images, we measured the 8 m flux densities of the Hii regions using Funtools111http://hea-www.harvard.edu/RD/funtools/ routines for ds9. This was done for all the objects catalogued as optically thick or thin, including “blister” regions, by Pellegrini et al. (2012), using the apertures defined in that work. These apertures are defined based on the nebular emission and ionization structure, and we note that physically associated 8 m flux may not always correlate well with the aperture boundaries. We tried to determine a systematic method to modify the apertures to avoid this problem. However, the 8 m spatial morphology varies strongly from that of the nebular emission and is fraught with confusion from background and neighboring emission. Thus, there is no obvious way to redefine the apertures to accurately define the boundaries between physically associated and unassociated emission for most objects. We caution that the 8 m flux density measurements across the samples are therefore subject to larger uncertainties in terms of their association with the specified Hii regions. It is hard to quantify these uncertainties, but they can be on the order of 50% for some objects, and much less for others.
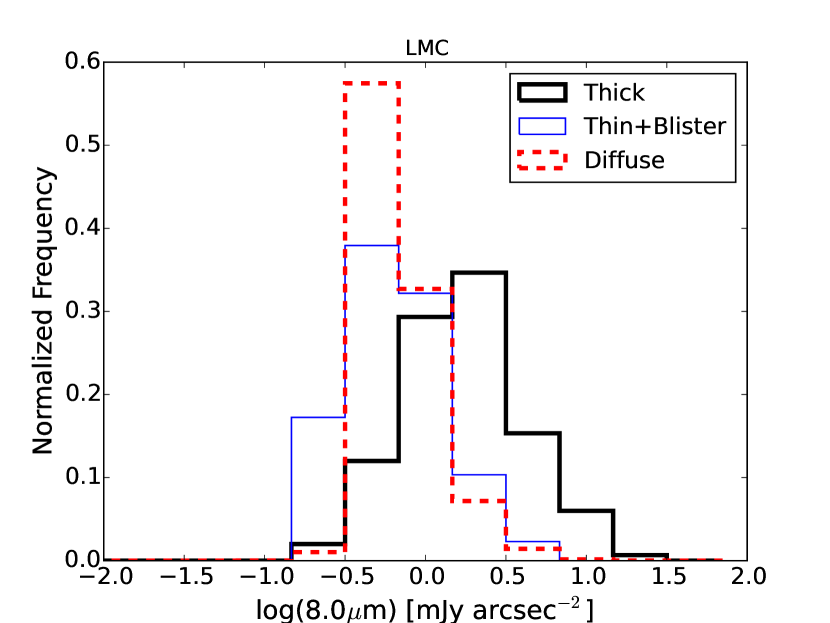
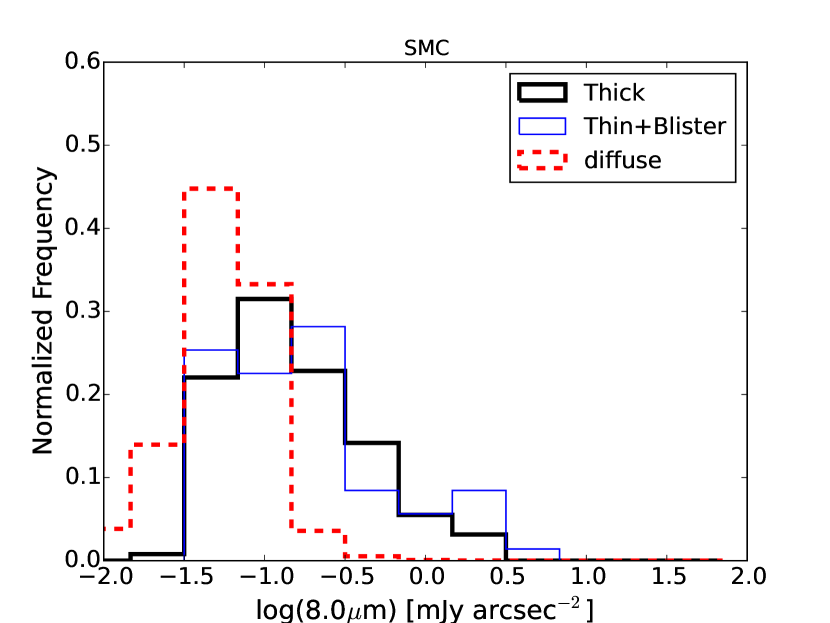
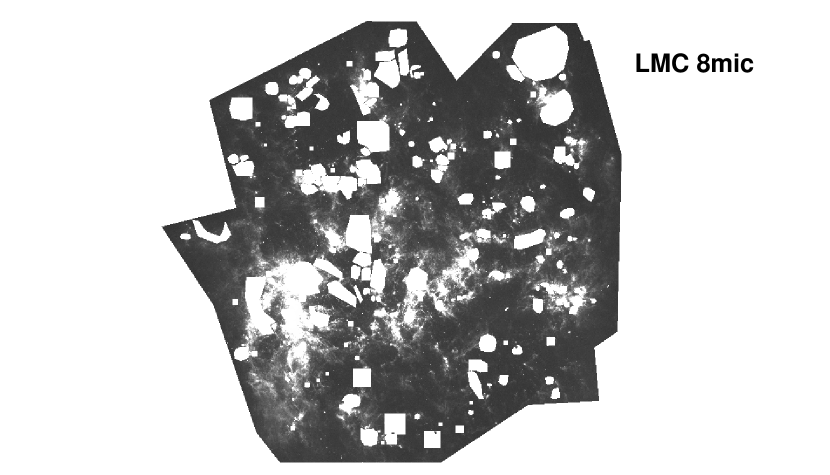
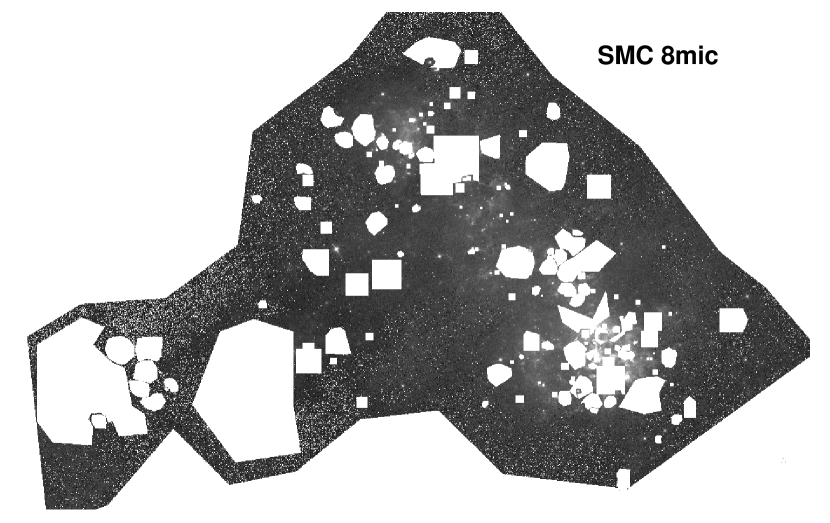
Figure 3 shows the 8 m flux surface brightness distributions for the Hii regions in the LMC (metallicity ) and SMC (; Russell & Dopita 1992), respectively. Objects identified as optically thick by Pellegrini et al. (2012) are shown with thick lines, and those identified as optically thin by thin lines. Figure 3 also shows the distribution of background, diffuse 8 m emission (dashed lines) for each galaxy, defined by the regions shown in Figure 4. It is apparent in the upper panel of Figure 3 that the candidate optically thick objects show more 8 m emission than candidate optically thin ones in the LMC, which is consistent with the destruction of PAHs by the Lyman continuum radiation. This is also confirmed by the fact that the optically thin objects are seen to be at the background levels.
In contrast, the lower panel of Figure 3 shows that in the SMC, the 8 m surface brightness distributions for the optically thick and thin objects are essentially the same: for the optically thick objects, the median 8 m surface brightness in the LMC is 1.2 mJy arcsec-2, while in the SMC, it is much lower, only 0.18 mJy arcsec-2. This is likely linked to the extremely low PAH emission found in low-metallicity environments (e.g., Madden, et al., 2006; Wu et al., 2006; Engelbracht et al., 2005), which is due to actual low PAH abundance in these conditions (Draine et al., 2007; Muñoz-Mateos et al., 2009). Sandstrom et al. (2010) examined the spatially resolved PAH abundance across the SMC, confirming the overall low PAH fraction, but finding strong differentiation between molecular clouds and diffuse ISM, with clouds showing PAH fractions 2 – 3 times higher than diffuse gas. This resolved study points to a model in which these aromatics form within molecular clouds via photoprocessing in the mantles of larger dust grains (Greenberg et al., 2000); the PAHs are subsequently destroyed by stellar UV radiation, which is less inhibited by dust in low metallicity environments (e.g., Madden, et al., 2006; Gordon et al., 2008). PAH destruction is further enhanced by their smaller average sizes, as found in the SMC by Sandstrom et al. (2012). This contrasts with PAH abundance models at higher metallicity in which additional processes contribute to PAH production, and dustier environments inhibit the propagation of UV radiation (e.g., Paradis et al., 2009). The large observed variation in PAH abundances of star-forming regions in the SMC is thus modulated by their remaining molecular gas, and the local UV photon flux or ionization parameter. This model is consistent with the observed presence and variation of the 2175 Å bump in the SMC B1-1 cloud (Maíz-Apellániz & Rubio, 2012). If the PAH production indeed depends on the existence of larger dust grains, it is necessarily much lower in metal-poor environments. Thus, our results in Figure 3 can be understood such that the large stochastic variation in PAH abundance masks any systematic differences between optically thick and thin Hii regions.

Can 8 m PAH imaging be useful for estimating the nebular optical depth when combined with, for example, mapping in a high-ionization atomic species? This would be similar to the IPM technique based on [Sii]/[Oiii] mapping. For objects with at least LMC metallicity, the data suggest that the 8 m imaging can provide valuable information. At lower metallicity, as seen in the SMC, PAHs are not abundant enough to be used for such a diagnostic. A couple of example objects from the LMC are shown in Figures 5 and 6, which show region MCELS-L372 (optically thick) and MCELS-L258 (optically thin) in H, [Sii]/[Oiii], 8m/[Oiii], 24m/[Oiii], and 8m/24m. There is similarity between the [Sii]/[Oiii] and 8m/[Oiii] ratio maps, although we also see that the 8 m emission extends beyond the nebular boundaries defined for the regions. In many cases it also appears morphologically unrelated to the Hii region, as in MCELS-L258 (Figure 6). We can therefore expect that evaluating the optical depth based only on 8m/[Oiii] will not be as straightforward as when using only nebular atomic lines.
We reclassified all the LMC objects by visual inspection of the regions, following the Pellegrini et al. (2012) methodology, but using the 8m/[Oiii] map instead of [Sii]/[Oiii], and allowing consideration of PAH emission outside the nebular boundaries specified by Pellegrini et al. (2012). We also imposed a threshold value of 0.5 and 0.3 in these ratio maps for the LMC and SMC, respectively, above which the objects are considered optically thick. Our classifications are listed in the Appendix. We then compare with the objects’ classifications by Pellegrini et al. (2012) as optically thick or thin (including blister) based on [Sii]/[Oiii] maps. The sample for which this comparison can be done corresponds to almost two-thirds of the objects (256 out of 401 objects) in the LMC, since a number of objects were either not classified as optically thick or thin by Pellegrini et al. (2012) or by us, or did not correspond to adequate detection in 8 m. We find that of the 256 objects, 185 (72%) maintain the same classifications and 71 objects (28%) switch classification from optically thick to thin (59 objects) or vice versa (12 objects).
In the SMC, however, more objects change their classification (115 objects out of 189, or 61%) than remain the same (74 objects, or 39%) when evaluated with PAH emission. This again suggests that PAHs are simply not abundant enough in this galaxy to provide a useful diagnostic of radiative transfer. However, in the LMC, for objects whose classifications are consistent for both nebular and PAH-based methods, the 8 m data can provide important confirmation.
As in the LMC, we also find in the SMC that more objects switch classification from optically thick to thin (88) than vice versa (27). This trend is consistent with PAHs being a more sensitive indicator of UV flux than low-ionization atomic species. As discussed by Pellegrini et al. (2012), although it usually indicates optically thick conditions, the presence of a low-ionization envelope is also seen in some optically thin objects, especially those with softer ionizing sources. The nebular-based classifications therefore might discriminate at somewhat higher optical depths than the PAH-based ones. More data is needed to determine how much of the discrepancy between the methods is due to this effect, and how much is due to errors caused by PAH spatial distribution, background confusion, and lower spatial resolution in the 8 m image, as well as misclassifications from the nebular lines.
3. 24 m Hot Dust emission
Very small dust grains within Hii regions absorb energetic photons produced by the massive stars and re-emit this energy in the 24 m band, which is an indicator of hot dust (e.g., Draine & Li, 2007). Hence 24 m emission has been used as a tracer of obscured star formation (e.g., Calzetti et al., 2007). Optically thick objects, with higher gas-to-photon densities, might be expected to have more dust, and thus, correspondingly stronger 24 m emission. However, we note that these dust grains, which are on average larger than PAHs, are not as easily destroyed by UV radiation. Thus, they tend to associate with individual dense knots, and also remain somewhat more uniformly distributed in the star-forming regions than PAHs. This is seen in the spatial distribution of 24 m emission in Figures 5, and 6.
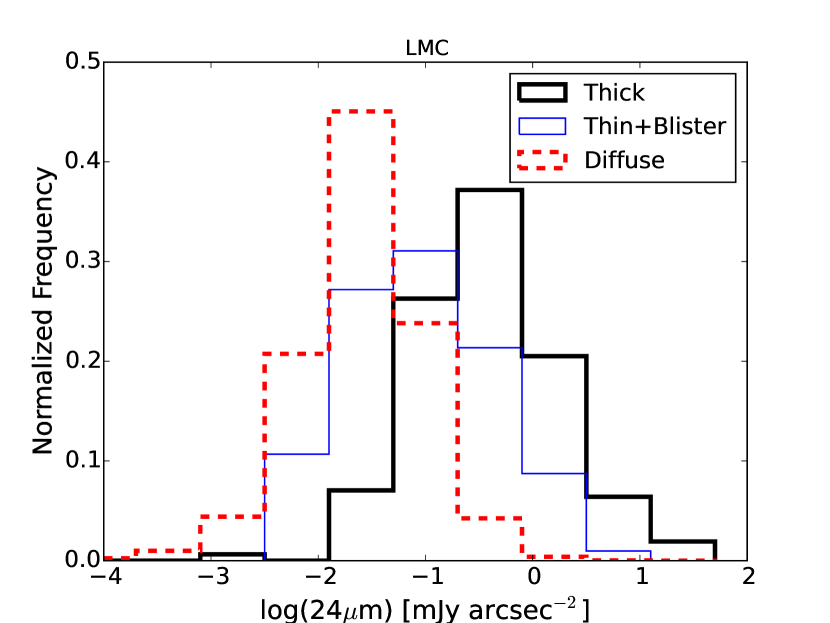
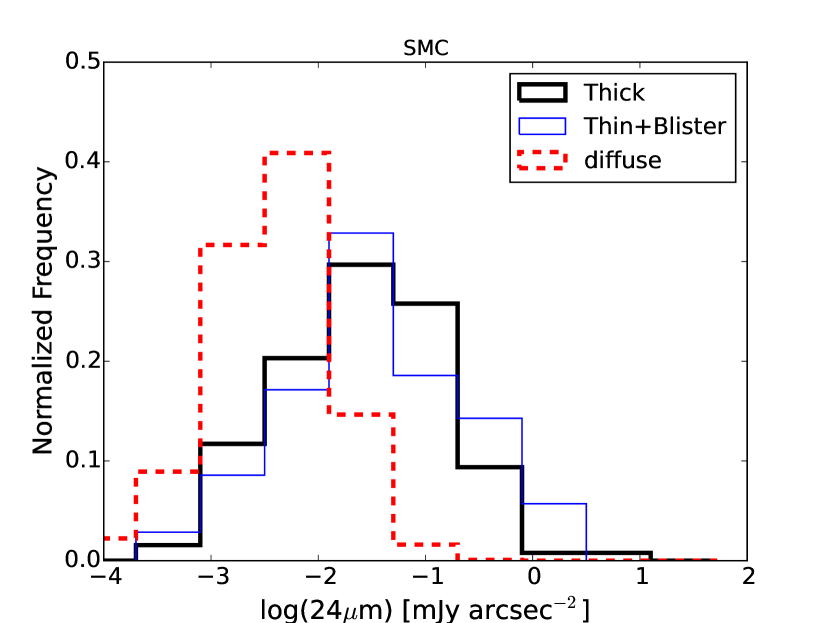
We measure the 24 m surface brightnesses for our sample objects in the same way as for the 8 m emission. The 24 m data are not continuum-subtracted, since there is no significant stellar continuum contributing to this band. Figure 7 shows the 24 m surface brightness distributions for the LMC (top) and SMC (bottom). We see that, as expected, optically thick regions in the LMC have higher 24 m surface brightness than optically thin ones. The median values are 0.44 and 0.13 mJy arcsec-2 for the thick and thin regions, respectively, in this galaxy.
However, for the SMC, the 24 m surface brightness distributions are essentially the same for the optically thick and thin objects (Figure 7). As in the case of the 8 m emission, this is likely due to the low SMC metallicity and hence, low dust content, as well as generally lower ISM density relative to the LMC. The mean 24 m surface brightness for the thick and thin regions in the SMC is about 0.05 mJy arcsec-2, an order of magnitude lower than the values for the LMC. We do note that the diffuse background is still slightly lower than in the Hii regions.
4. Dust Mass
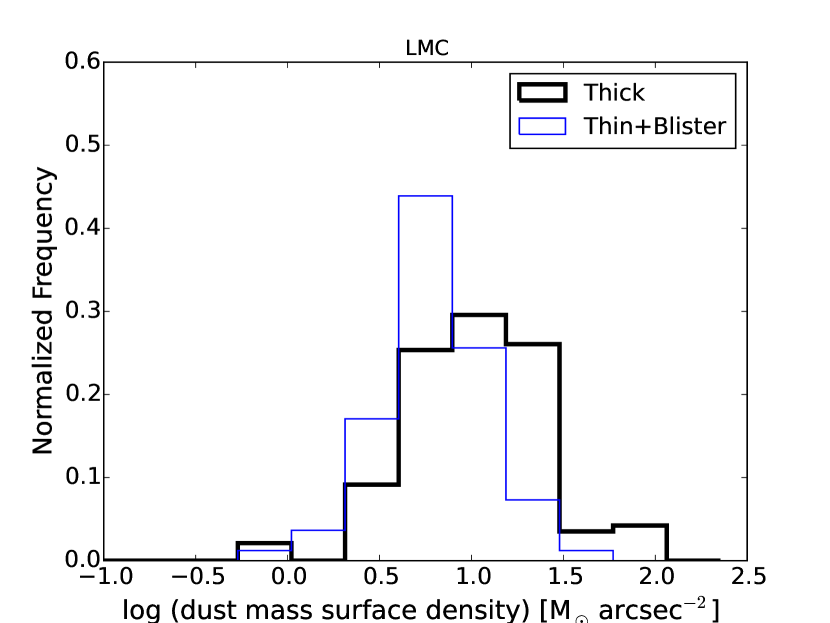
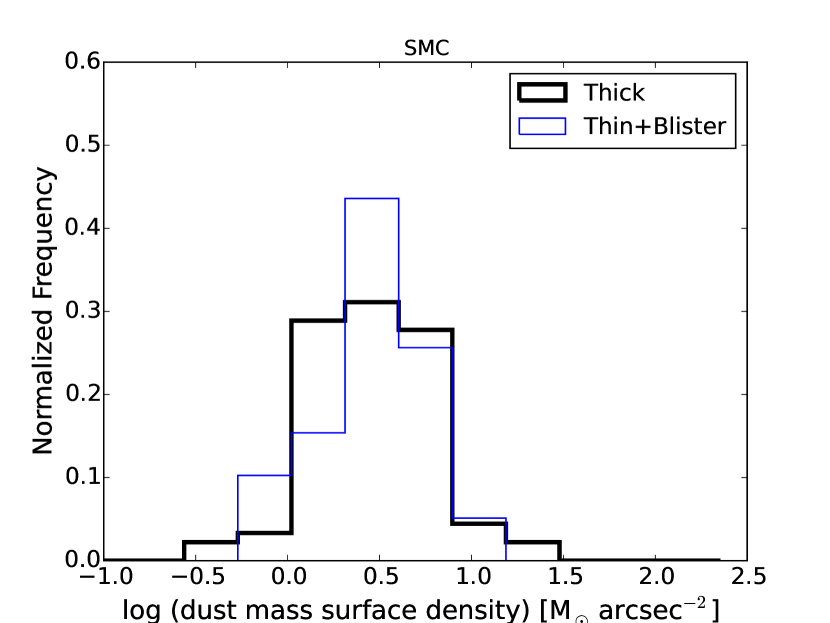
We interpret our findings above to suggest that the SMC is simply too metal-poor to sustain enough dust, both PAHs and larger grains, to generate differential trends between optically thick and thin Hii regions as seen in a more metal-rich environment like the LMC (Figures 3 and 7). To evaluate this possibility, we use the dust map constructed by Gordon et al. (2014) to measure the integrated dust masses using the same method as before.
In the SMC, 129 (63%) of 203 objects are detected, whereas in the LMC 220 (83%) of 262 objects are detected in the dust maps. For objects with detections, Figure 8 shows the distribution of dust mass surface density for the optically thick and thin objects in each galaxy, analogous to the earlier distribution plots. The top panel of Figure 8 indeed confirms that optically thick objects in the LMC have 1.6 times higher median than their optically thin counterparts; the median are and , respectively. In contrast, there is no differentiation between optically thick and thin objects in the SMC: and , respectively. This value may well correspond to a diffuse background emission, and Figure 8 may imply that optically thin Hii regions have negligible .
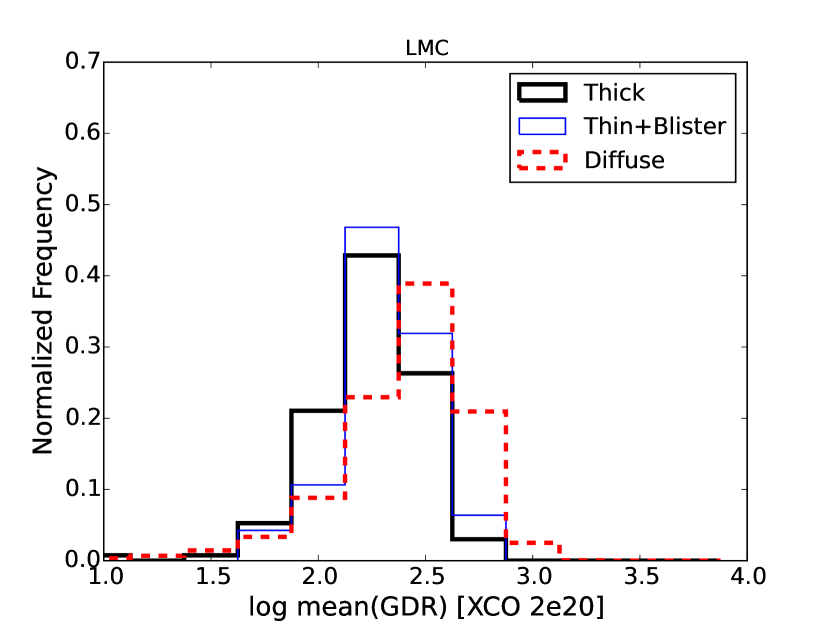
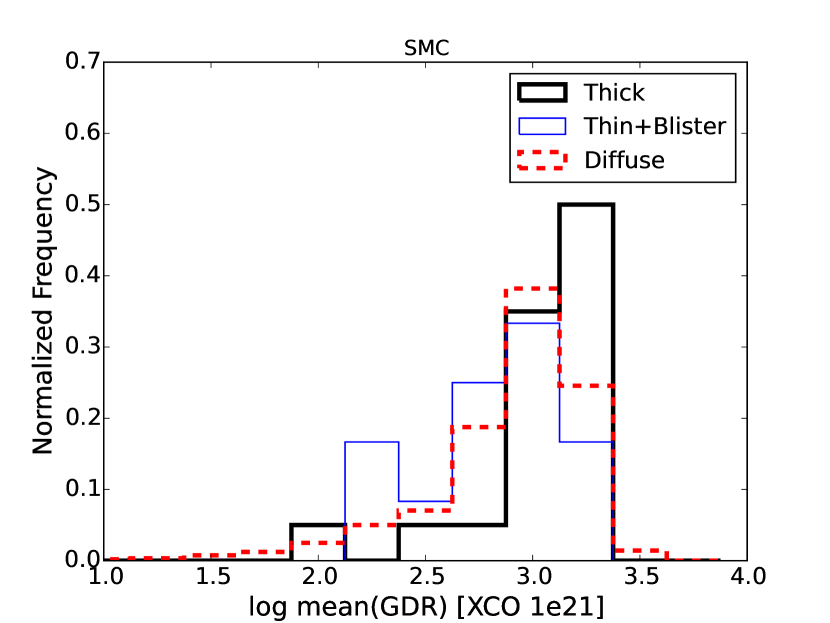
These trends are further confirmed by the gas-to-dust ratios (GDR) obtained in the same apertures. We computed these using the GDR maps of Roman-Duval et al. (2014), where the dust surface density is derived from the HERITAGE data used above (Gordon et al., 2014), and the gas surface density includes both Hi (Kim et al., 2003; Stanimirović et al., 1999) and H2, inferred from CO (Wong, et al., 2011; Mizuno et al., 2001). We adopt the maps with CO-to-H2 conversion factors of and 10 in the LMC and SMC, respectively (Bolatto et al., 2013). Figure 9 shows the distribution in GDR for the optically thick and thin objects in both Magellanic Clouds, analogous to our previous figures, along with the diffuse emission. We see that, in the LMC, optically thin objects tend to have higher GDR than the optically thick objects, although the effect is not dramatic. The mean values for thin and thick objects are 265 and 243, respectively, and the optically thin distribution is again intermediate between the optically thick objects and diffuse gas, as seen in Figures 3 and 7. This behavior is consistent with the conventional correlation between dust and optically thick conditions.
As before, the behavior is different in the SMC, now with the optically thick objects showing significantly higher GDRs than the optically thin objects: the mean values are 1701 and 959 for the two samples, respectively. Figure 9 shows that the optically thin distribution peaks at similar GDR as the diffuse gas, supporting our premise that the dust abundance in these objects is similar to that of the diffuse ISM, since both are governed by destruction from the UV interstellar radiation field (Madden, et al., 2006; Gordon et al., 2008). The higher GDR for optically thick objects may be attributable to the fact that these Hii regions are also subject to UV radiation, but must have higher gas masses necessary for optically thick Hii regions.
5. Conclusion
We have examined the 8 m PAH and 24 m hot dust emission associated with Hii regions in the Magellanic Clouds to evaluate how the emission in these bands relates to the nebular optical depth in the Lyman continuum. Specifically, we examined IR emission and dust properties derived from the SAGE and HERITAGE surveys of the Magellanic Clouds associated with Hii regions that were classified by Pellegrini et al. (2012) as candidate optically thick and thin objects.
Since PAHs are easily destroyed by UV radiation, in principle, nebular optically thin conditions may be confirmed by low peripheral PAH abundance. We find that the use of PAHs as a diagnostic for nebular conditions is compromised by the strongly non-uniform spatial distribution of dust relative to the ionized gas. Nevertheless, for metallicities allowing significant dust formation, as in the LMC, optically thick Hii regions clearly show much higher 8 m surface brightness, with a median value about 6 times higher than for optically thin objects. The lower 8 m emission in optically thin objects is unlikely to be due to lower heating rates since on average the stellar ionizing fluxes are higher in optically thin objects (Pellegrini et al., 2012). Thus, the 8 m emission can offer important supporting diagnostic data on optical depth at higher metallicities.
In contrast to the LMC, we find no differentiation in the low PAH levels seen in the optically thick and thin nebulae of the SMC. These results are consistent with the model of Sandstrom et al. (2010) in which low-metallicity PAH abundance is regulated by low production rates in molecular clouds and high destruction rates by stellar UV radiation. This dominates the variations in PAH abundances of star-forming regions and masks any differentiation due to optical depth effects. Thus, at this much lower metallicity, it appears that PAHs are simply too underabundant to serve as diagnostics for Lyman continuum opacity.
The very small dust grains that produce the 24 m emission are more resilient to UV radiation and well known to correlate with star-forming regions. We confirm that it is associated with star formation, having more uniform morphological correspondence to luminous Hii regions and star-forming knots. We again find that the optically thick Hii regions show a significant offset, a factor of about 3, in median 24 m surface brightness relative to the optically thin objects in the LMC. However, the offset here is due to the association with denser gas in optically thick regions, rather than destruction in optically thin regions. As with the PAH emission, there is no discernible difference with nebular optical depth in the SMC, again attributable to low dust abundance.
Thus, we find that the low metallicity in the SMC apparently inhibits the formation of PAHs and dust such that we cannot use the 8 m and 24 m emission as diagnostics of nebular radiative transfer. This is further confirmed by inspection of the dust mass surface densities, showing no significant difference between the optically thick and thin objects in the SMC. In contrast, the LMC shows that the optically thick objects have higher median dust mass surface density by a factor of 1.7 compared to the optically thin objects, and the median GDR similarly is 1.8 times higher. This contrast in PAH diagnostics is consistent with the suggestions of a transition in ISM dust conditions at metallicities just above the SMC value (Draine et al., 2007; Engelbracht et al., 2005), such that the PAH contribution to dust mass drops precipitously in metal-poor environments. For our purposes, the decrease in 24 m-emitting hot dust also precludes the use of this emission as a useful diagnostic of nebular conditions in these environments.
Hence, our findings suggest that at higher metallicities, the 8 m PAH and 24 m hot dust emission can offer useful diagnostics of Hii region radiative transfer. We do caution that there is significant overlap in the distributions of properties between the optically thick and thin objects. Much of this degeneracy is due to the fact that optical depth is not a binary classification, but rather, a continuous quantity, and efforts to bin objects into two categories will necessarily cause overlap in the distributions. We further caution that the optical depth classifications of Pellegrini et al. (2012) have a large degree of subjectivity, as do our reclassifications based on the 8m/[Oiii] maps in Section 2. As stressed by Pellegrini et al. (2012), IPM can only offer a first-order estimate of optical depth for a single ratio map, and so classifications of individual objects should be regarded as tentative. The 8 m and 24 m emission can therefore provide valuable additional diagnostics when combined with the nebular emission-line ratio maps. As discussed in Section 2, since PAHs are more sensitive to UV radiation than atomic species, they seem to be sensitive to a somewhat higher optical depth threshold.
References
- Arthur et al. (2011) Arthur, S. J., Henney, W. J., Mellema, G., de Colle, F., & Vázquez-Semadeni, E. 2011, MNRAS, 414, 1747
- Bauschlicher et al. (2009) Bauschlicher, C. W., Peeters, E., & Allamandola, L. J. 2009, ApJ697, 311
- Bauschlicher et al. (2008) Bauschlicher, C. W., Peeters, E., & Allamandola, L. J. 2008, ApJ678, 316
- Bernard et al. (2008) Bernard, J.-P., et al. 2008, ApJ, 136, 919
- Bolatto et al. (2013) Bolatto, A., D., Wolfire, M., & Leroy, A. K. 2013, ARA&A51, 207
- Calzetti et al. (2007) Calzetti, D., Kennicutt, R. C., Engelbracht, C. W., et al. 2007, ApJ, 666, 870
- Collins & Rand (2001) Collins, J. A., & Rand, R. J. 2001, ApJ, 551, 57
- Draine & Li (2007) Draine, B. T., & Li, A. 2007, ApJ, 657, 810
- Draine et al. (2007) Draine, B. T., Dale, D. A., Bendo, K. D., et al. 2007, ApJ, 663, 866
- Engelbracht et al. (2005) Engelbracht, C. W., Gordon, K. D., Rieke, G. H., Werner, M. W., Dale, D. A., & Latter, W. B. 2005, ApJ, 628, L29
- Ferguson et al. (1996) Ferguson, A. M. N., Wyse, R. F. G., & Gallagher, J. S. 1996, AJ, 112, 2567
- Ferland et al. (2013) Ferland, G. J., Porter, R. L., van Hoof, P. A. M., Williams, R. J. R., Abel, N. P., Lykins, M. L., Shaw, G., Henney, W. J., & Stancil, P. C. 2013, RMxAA 49, 137
- Gordon et al. (2008) Gordon, K. D., Engelbracht, C. W., Rieke, G. H., Misselt, K. A., Smith, J.-D. T., & Kennicutt, R. C. 2008, ApJ682, 336
- Gordon et al. (2011) Gordon, K. D., Meixner, M., Meade, M. R., et al. 2011, AJ, 142, 102
- Gordon et al. (2014) Gordon, K. D., Roman-Duval, J., Bot, C., et al. 2014, ApJ, 797, 85
- Greenberg et al. (2000) Greenberg, J. M., Gillette, J. S., Muñoz Caro, G. M., et al. 2000, ApJ, 531, L71
- Haffner et al. (2009) Haffner, L. M., Dettmar, R.-J., Beckman, J. E., et al. 2009, Reviews of Modern Physics, 81, 969
- Hoopes & Walterbos (2000) Hoopes, C. G., & Walterbos, R. A. M. 2000, ApJ, 541, 597
- Hoopes et al. (2001) Hoopes, C. G., Walterbos, R. A. M., & Bothun, G. D. 2001, ApJ, 559, 878
- Kim et al. (2003) Kim, S., Staveley-Smith, L., Dopita, M. A., Sault, R. J., Freeman, K. C, Lee, Y., & Chu, Y.-H. 2003, ApJS, 148, 473
- Li & Draine (2001a) Li, A., & Draine, B. T. 20 01, ApJ, 550, 214L
- Li & Draine (2001b) Li, A., & Draine, B. T. 20 01, ApJ, 554, 778
- Madden, et al. (2006) Madden, S. C., Galliano, F., Jones, A. P., & Sauvage, M. 2006, A&A, 446, 877
- Maíz-Apellániz & Rubio (2012) Maíz-Apellániz, J. & Rubio, M. 2012, A&A, 541, A54
- Martins et al. (2005) Martins, F., Schaerer, D., & Hillier, D. J. 2005, A&A, 436, 1049
- Meixner et al. (2006) Meixner, M., Gordon, K. D., Indebetouw, R., et al. 2006, AJ, 132, 2268
- Meixner et al. (2013) Meixner, M., Panuzzo, P., Roman-Duval, J., et al. 2013, AJ, 146, 62
- Mizuno et al. (2001) Mizuno, N., Rubio, M., Mizuno, A., Yamaguchi, R., Onishi, T., & Fukui, Y. 2001, PASJ, 53, 45
- Muñoz-Mateos et al. (2009) Muñoz-Mateos, J. C., Gil de Paz, A., Boissier, S., et al. 2009, ApJ, 701, 1965
- Oey & Kennicutt (1997) Oey, M. S., & Kennicutt, R. C., Jr. 1997, MNRAS, 291, 827
- Paradis et al. (2009) Paradis, D., Reach, W. T., Bernard, J.-P., et al. 2009, AJ, 138, 196
- Pauldrach et al. (2001) Pauldrach, A. W. A., Hoffmann, T. L., & Lennon, M. 2001, A&A, 375, 161
- Pavlyuchenkov et al. (2013) Pavlyuchenkov, Y. N., Kirsanova, M. S., & Wiebe, D. S. 2013, Astronomy Reports, 57, 57
- Pellegrini et al. (2012) Pellegrini, E. W., Oey, M. S., Winkler, P. F., et al. 2012, ApJ, 755, 40
- Povich et al. (2007) Povich, M. S., Stone, J. M., Churchwell, E., et al. 2007, ApJ, 660, 346
- Reynolds (1984) Reynolds, R. J. 1984, ApJ, 282, 191
- Roman-Duval et al. (2014) Roman-Duval, J., Gordon, K. D., Meixner, M., et al. 2014, ApJ, 797, 86
- Russell & Dopita (1992) Russell, S. C. & Dopita, M. A. 1992, ApJ, 384, 508
- Sandstrom et al. (2010) Sandstrom, K., M., Bolatto, A. D., Draine, B. T., Bot, C., & Stanimirović, S. 2010, ApJ, 715, 701
- Sandstrom et al. (2012) Sandstrom, K., M., Bolatto, A. D., Bot, C., et al. 2012, ApJ, 744, 20
- Seon (2009) Seon, K.-I. 2009, ApJ, 703, 1159
- Sewilo et al. (2009) Sewilo, M., et al. 2009, “SAGE Data Products Description,” http://irsa.ipac.caltech.edu/data/SPITZER/SAGE/doc/SAGESpecDataDelivery-v3.pdf
- Smith et al. (2005) Smith, R. C., Points, S., Chu, Y.-H., et al. 2005, Bulletin of the American Astronomical Society, 37, 145.01
- Stanimirović et al. (1999) Stanimirović, S., Staveley-Smith, L., Dickey, J. M., Sault, R. J., & Snowden, S. L. 1999, MNRAS, 302, 417
- Tielens (2008) Tielens, A. G. G. M. 2008, ARAA 46, 289
- Voges et al. (2008) Voges, E. S., Oey, M. S., Walterbos, R. A. M., & Wilkinson, T. M. 2008, AJ, 135, 1291
- Walterbos (1998) Walterbos, R. A. M. 1998, Publications of the ASA, 15, 99
- Wong, et al. (2011) Wong, T., Hughes, A., Ott, J., et al. 2011, ApJS, 197, 16
- Wood & Mathis (2004) Wood, K., & Mathis, J. S. 2004, MNRAS, 353, 1126
- Wu et al. (2006) Wu, Y., Charmandaris, V., Hao, L., Brandl, B. R., Bernard-Salas, J., Spoon, H. W. W., & Houck, J. R. 2006, ApJ, 639, 157
- Zurita et al. (2002) Zurita, A., Beckman, J. E., Rozas, M., & Ryder, S. 2002, A&A, 386, 801
As described in Section 2, we classified all the MCELS objects as optically
thick or thin, based on the 8m/[Oiii] ratio map. The
classifications were evaluated by J.L.-H. Objects marked with
asterisks indicate ones for which our classifications differ from those of
Pellegrini et al. (2012), which were based on [Sii]/[Oiii] ratio maps.
Our LMC classifications are as follows.
Optically thick:
MCELS-L4, L6, L8, L11, L13*, L15*, L25, L28, L29*, L32, L33, L35, L47, L54, L60, L65*, L69, L70, L73, L78, L93, L95, L96, L108*, L125, L127, L130, L131, L132, L134, L135*, L136, L140, L143, L144, L149, L162, L173, L181, L188, L192, L193, L194, L197, L201*, L204, L206, L208, L212, L213, L215, L216, L218, L219, L222, L226, L227, L229, L230, L237, L238, L244, L251, L255*, L257, L261*, L264, L268, L274, L278, L285, L286, L290, L292, L304, L310, L311, L318, L320, L332, L334, L335, L336, L339, L340, L341, L342, L343*, L345, L348, L352*, L353*, L354, L355, L357, L369, L372, L374, L377, L382, L384, L385, L389, L390, L391, L393, L400.
Optically thin:
MCELS-L1, L2, L3, L5*, L9*, L10, L12, L14*, L16, L17*, L18*, L20, L21, L22*, L23*, L24, L27, L34*, L36*, L38, L39, L40, L42, L43*, L44, L45, L48, L49, L52*, L55*, L56, L58, L59, L61*, L63, L67, L71, L72*, L74*, L75*, L77, L79*, L80*, L86, L92, L97*, L98*, L99, L101, L102, L103, L104*, L106, L107*, L109*, L114*, L118*, L119, L121, L122*, L128*, L137, L138*, L141*, L146, L147, L148, L150, L151, L152, L155, L157*, L163, L165, L167*, L168, L169, L170*, L171, L174, L175*, L176, L177, L180, L182, L184, L191, L200, L202, L203*, L207*, L209, L210*, L211, L217*, L223, L231, L232, L239, L240, L241, L242, L248, L250*, L252*, L253, L254, L258, L259, L260, L267, L277*, L284*, L288*, L295, L300*, L302, L303, L305, L306, L307, L315*, L316*, L319*, L321*, L323, L325*, L326, L328, L333, L337*, L338, L344*, L346*, L347*, L351*, L356, L361*, L362*, L365, L367, L373, L379, L380*, L386, L394*, L395*, L396, L401*.
Our SMC classifications are as follows.
Optically thick:
MCELS-S1*, S4, S6*, S7*, S9, S10*, S14*, S27, S32, S33, S34, S42, S47, S71, S80, S81, S85, S86, S92, S93*, S96*, S97, S101, S104*, S105*, S107, S113*, S115, S119, S123, S126*, S131*, S132*, S139, S140*, S142, S143*, S149, S151*, S157*, S161, S162*, S164, S166, S167, S169, S170, S172*, S173, S175*, S176, S177*, S178, S179, S183*, S184, S185*, S187*, S188, S189, S192*, S196, S198, S204*, S206*, S208.
Optically thin:
MCELS-S2*, S3*, S5, S8*, S15*, S16, S17*, S18*, S19*, S20*, S22*, S23*, S24*, S25*, S26*, S28*, S29*, S30*, S31*, S35*, S36, S37, S38*, S39*, S40*, S43*, S44*, S45*, S46, S48*, S49*, S51*, S52*, S54*, S55*, S56*, S57*, S59*, S60*, S61, S62, S63, S64*, S65, S66, S67, S68*, S70*, S72*, S73, S74*, S77*, S78*, S79*, S82, S83*, S84*, S87*, S88*, S89*, S90*, S91*, S94, S95*, S98, S99, S102*, S103*, S106*, S108, S109, S110*, S111, S112*, S114, S116*, S117*, S121*, S124, S125, S127, S128*, S130*, S133*, S134, S135*, S137*, S138, S141*, S144*, S145, S146*, S147*, S148, S150*, S152, S153, S154, S155*, S156*, S158*, S159, S160, S168*, S171*, S174*, S180*, S181*, S182, S186*, S190*, S191*, S195*, S197*, S199, S200*, S207*, S209*, S210*, S211*, S212*, S213, S214*.