No Ly emitters detected around a QSO at z=6.4: Suppressed by the QSO?00footnotemark: 0
Abstract
Understanding how QSO’s UV radiation affects galaxy formation is vital to our understanding of reionization era. Using a custom made narrow-band filter, , on Subaru/Suprime-Cam, we investigated the number density of Ly emitters (LAE) around a QSO at z=6.4. To date, this is the highest redshift narrow-band observation, where LAEs around a luminous QSO are investigated. Due to the large field-of-view of Suprime-Cam, our survey area is 5400 cMpc2, much larger than previously studies at z=5.7 (200 cMpc2).
In this field, we previously found a factor of 7 overdensity of Lyman break galaxies (LBGs). Based on this, we expected to detect 100 LAEs down to =25 ABmag. However, our 6.4 hour exposure found none. The obtained upper limit on the number density of LAEs is more than an order lower than the blank fields. Furthermore, this lower density of LAEs spans a large scale of 10 Mpc across. A simple argument suggests a strong UV radiation from the QSO can suppress star-formation in halos with within a Mpc from the QSO, but the deficit at the edge of the field (5 Mpc) remains to be explained.
keywords:
quasars:individual, black hole physics, galaxies: high-redshift1 Introduction
Quasars (QSOs) are expected to be a tracer of high-density regions because they harbor supermassive black holes with masses up to , which are likely to reside in massive dark matter halos of . Such massive hales are theoretically expected to hold many massive galaxies, and evolve into present-day massive clusters although with a significant scatter (e.g., Springel et al., 2005; Overzier et al., 2009).
Observationally, at , there have been both positive (e.g., Djorgovski et al., 2003; Swinbank et al., 2012; Husband et al., 2015) and negative detection (e.g., Francis & Bland-Hawthorn, 2004; Kashikawa et al., 2007) of overdensities around luminous QSOs. Recent discoveries of increasing number of QSOs advanced the research into higher-z, again to find mixed results. Some reported discoveries of overdensities around QSOs (Stiavelli et al., 2005; Zheng et al., 2006), while others failed to find any significant overdensity (Kim et al., 2009; Bañados et al., 2013; Mazzucchelli et al., 2017). See Overzier (2016) for a more complete review.
Why do results vary? A part of the reason could be a small field of view (FoV) of the previous instruments, especially HST/ACS, which most previous work relied on at . To rectify the situation, in our previous work, we took advantage of a large FoV of the Subaru Suprime-Cam to find a factor of 7 overdensity of Lyman break galaxies (LBGs) around a luminous QSO at z=6.4, with a ring-like distribution centred on the QSO with a radius of 3 Mpc (Utsumi et al., 2010). Such a large scale structure could not be found without the large FoV of the Suprime-Cam.
However, the result was based on small statistics of 7 objects. Photometric redshifts of LBGs have a large uncertainty. Spectroscopic confirmation would be ideal, but the LBGs are faint ( and ). Spectroscopic confirmation is not trivial, especially when their Ly emission is weak.
An efficient alternative is to use a narrow-band filter and detect Ly emitters (LAEs). Being an imaging observation, one can survey a large area at once, focusing on the Ly emission line, where we expect a high S/N ratio.
For this purpose, we have developed a custom-made narrow-band filter, , to detect LAEs at z=6.4. This is the highest redshift, where the narrow-band imaging technique is used to investigate environment of a QSO with a large field of view of Supreme-Cam. The QSO-galaxy interaction can be more clearly seen at higher-z, where galaxies have less chance to form before the QSO turns on.
2 Observation
We have developed a custom-made narrow-band filter , whose central wavelength is 905nm (z = 6.4 for Ly) for Subaru/Suprime-Cam’s F/1.86 convergence light, with FWHM of 15.8nm (z = 0.1).
Using this filter, we observed a field centred on QSO CFHQS J23290301 at z=6.4 with Subaru Suprime-Cam. In this field, we have previously obtained deep images in and filters (Utsumi et al., 2010). The filter covers the redder side of the band and has a central wavelength of 9900Å(Shimasaku et al., 2005). The total exposure time of the observation was 23044 sec. After masking the halos and horizontal spikes surrounding bright stars, as well as the outer edge of the image, the effective area is 0.219 deg2. The data reduction was performed using the imcat111https://www.ifa.hawaii.edu/kaiser/imcat/. The FWHM of the combined image was 0.64”. Exposure times of all filters are summarized in Table 2.
| Band | PSF size (arcsec) | Exp time (s) | Limiting mag |
|---|---|---|---|
| (3 AB, 1.2” aperture) | |||
| 0.64 | 23044 | 25.73 | |
| 0.61 | 3600 | 26.95 | |
| 0.60 | 6900 | 26.13 | |
| 0.62 | 12532 | 25.46 |
3 Analysis and Results
3.1 LAE selection
We measure magnitudes using MAG_AUTO of SExtractor and -diameter aperture. The aperture size is chosen to be twice as large as the seeing FWHM to increase the S/N ratio. We adopt MAG_AUTO as total magnitudes, while we use a -diameter aperture magnitude to measure colours of objects in order to obtain colours of faint objects with a good signal-to-noise ratio. We correct the magnitudes of objects for Galactic extinction of (Schlegel et al., 1998).
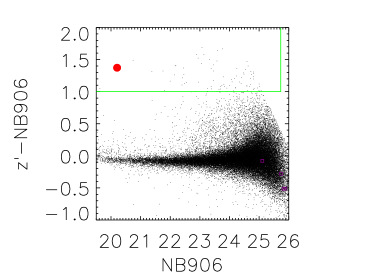
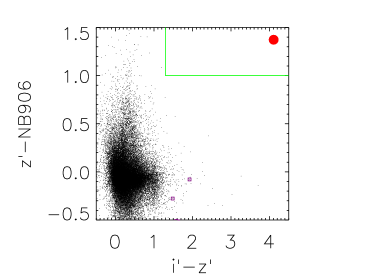
To reduce contamination by false detection, we only use the “detected cleanly” and “no blending” objects that have FLAGS=0 in SExtractor. We plot all such objects with the black dots in Figure 1, where the colour is shown as a function of magnitude. Figure 2 presents a colour-colour diagram based on the -detection catalog.
Following previous work (Taniguchi et al., 2005; Ouchi et al., 2010), we select LAEs with the narrow-band excess, and the existence of lyman break as follows,
| (1) |
When objects are not detected in the band, we used 3 limiting magnitude to evaluate the objects.
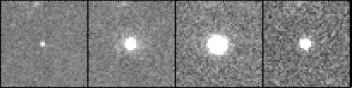
With these criteria, we did not find any LAE across the FoV of the Suprime-Cam, except the QSO CFHQS J2329-0309, which is shown with the red circle in Figs.1-2. Fig.3 shows 1010” images of the QSO. There were 6 detection without or -band detection. We have eye-balled them to find none of them were real objects (either a cosmic-ray, or affected by the edge of the field).
Note that FWHM of the filter is 15.8nm, which is larger than that of (13.2nm) used in Taniguchi et al. (2005); Ouchi et al. (2010). With the same colour criteria of 1.0, our selection criteria correspond to LAEs with the rest-frame equivalent width, EW0, of 43Å, instead of 36Å of Taniguchi et al. (2005); Ouchi et al. (2010). In an attempt to match the criteria in terms of EW0, we tried , which selects LAEs with EW36Å. Yet no LAE was found (see Schenker et al. (2014) for an example EW distributions of LAEs).
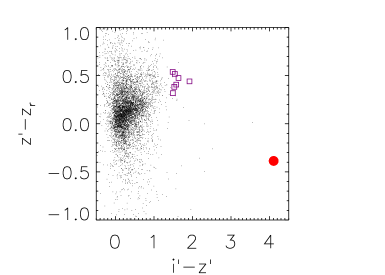
Utsumi et al. (2010) detected 7 LBGs within the field. All of them are identified in this work, with the same criteria of 1.3, and 0.3, as shown with purple squares in Fig. 4. These LBGs are also shown in Figs.1-2. Fig. 2 shows none of them has significant excess in , suggesting their EWs are less than 30Å(This assumes that they have redshifts with Ly falling in the NB filter).
3.2 Completeness
We estimate the detection completeness of image as a function of narrow-band magnitude. We construct a composite PSF using stars in the NB906 image. Then, we randomly distribute 1000 artificial PSFs with varying magnitude between 23.0 and 27.0 onto the NB906 image. We did not remove regions affected by bright stars. Therefore, the measured completeness includes the effective area correction, which is expected to be a few percent. Next, we try to detect them in the same manner as the detection of our LAEs with SExtractor. We plot the detection completeness as a function of magnitude in Figure 5. The detection completeness drops to % at around =25.4 mag.
3.3 LAE luminosity function
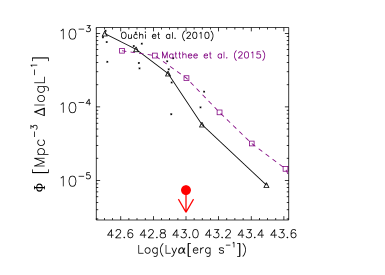
Next, we compare the number density of LAEs with those in the blank fields. We obtain the upper limit of the number density of LAE by simply dividing the number counts of LAEs by the effective survey comoving volume, defined as the FWHM of the bandpass (15.8 nm) times the area of the survey. Resulting one upper limit is shown in Fig.6. For a comparison, LAE LF at z=6.6 is shown with the black triangles (Ouchi et al., 2010). Our upper limit is lower by about an order than the LAE density in the fields.

4 Discussion
4.1 Notes on LBGs
We also identified 7 LBGs in Utsumi et al. (2010), and plotted their colours in Figs.1-2 with the purple squares. However, none of them has to satisfy the criteria to be LAEs. Four of them are not even detected in . This means either they are not in the redshift range of (), or they are but without a strong Ly emission. Because their broad-band colours are still very red (, and ), they are likely to be at . Previous observations reported the fraction of bright LBGs with a strong Ly emission is small at z. For example, Stark et al. (2011); Pentericci et al. (2011); Schenker et al. (2014) reported the fraction of bright LBGs (EW25Å, M-20.25) with a Ly emission is 20% at z6, and 10% at z7. Our LBGs are even brighter with MUV=22.221.7. The fraction would be even smaller. It is not too surprising if none of the six LBGs had a strong Ly emission. Further conclusions need spectroscopic confirmation of these LBGs.
4.2 Comparison to previous work
In previous work investigating the environment of QSOs, there exist both positive and negative results on the detection of overdensity of galaxies around QSOs. At lower redshift, QSOs’ duty cycles become relatively shorter compared with the age of the Universe. There are increasing chances that surrounding galaxies may have formed before the central QSO did. In addition, LBGs and LAEs are different in their mass, and thus, physical effects from the central QSOs might be also different (e.g., Kashikawa et al., 2007). Therefore, to simplify the discussion, below we compare with results at higher-z (z4), which used LAEs to investigate the QSO environment.
In previous work, Kashikawa et al. (2007) found that LBGs without Ly emission form a filamentary structure near QSO SDSS J02110009 at z=4.87, while Ly emitters are distributed around222Note that De Rosa et al. (2011) used MgII line to measure the redshift of J02100009 to be z=4.894. If so, Ly emissions could be out of the filter. but avoid QSO within a distance of 770 kpc. Swinbank et al. (2012) used the Taurus Tunable Filter to find a significant galaxy overdensity around a QSO at z=4.528 over 35 arcmin2. Mazzucchelli et al. (2017) and Bañados et al. (2013) investigated the environment of two z=5.7 quasars to find no enhancement of LAEs in comparison with blank fields. Kikuta et al. (2017) observed environments of LAEs around two QSOs at z4.9 using a narrow-band filter. They found that two QSOs are located near local density peaks (), but the number densities of LAEs in a larger spatial scale are not significantly different from those in blank fields.
While results of the previous studies vary, we would like to highlight differences in our work. Our QSO is at the highest redshift of z=6.4. At a higher redshift, the age of the Universe is younger. With less time available for halo formation, the effect of the QSO UV radiation would be clearer. This could be a reason why we found the number density of LAEs is even smaller than the general field by 3 . It is an important future task to investigate QSO luminosity dependence of LAE distribution using multiple QSOs at similar or higher redshifts.
Also previous work at z5.7 could not rule out the QSO environment could be overdense at large scale (10 Mpc) because of their smaller field of view (200 cMpc2 at most). Our larger area coverage of 5400 cMpc2, for the first time at z6, ruled this out by finding the lower density of LAEs is over a large scale of 10 Mpc across.
4.3 Physical interpretation
By finding the lack of LBGs near the QSO, Utsumi et al. (2010) discussed the strong UV radiation may have suppressed the formation of galaxies in the vicinity of the QSO. The QSO is associated with a giant Ly nebulae (Goto et al., 2009, 2011), reflecting a strong UV radiation from the QSO. In this work, we found the lack of LAE not just in the QSO vicinity but in the whole field.
Kashikawa et al. (2007) quantitatively estimated how much QSO’s UV radiation can suppress such galaxy formation. QSO CFHQS J23290301’s absolute magnitude is =-25.2 (Willott et al., 2007), which is about 1.2 magnitude fainter that in Kashikawa et al. (2007) at z=4.87 (=-26.4). Following their arguments, within 770 kpc, . The QSO can suppress star-formation (SF) in halos with , while halos with are almost unaffected (see their Fig.8). However, at the edge of the field (5Mpc away), is . Only SF in halos with can be suppressed. Previous estimates of halo mass of typical LAEs () are around (Gawiser et al., 2007; Ouchi et al., 2010; Garel et al., 2015). If so, the SF can be suppressed in halos near the QSOs, but it remains to be explained why LAEs are not detected around the edge of the field, where UV radiation is weaker.
There are several notable sources of uncertainty on the discussion. On the theoretical side, it was assumed that stars form at the centre of a spherical halo. If star formation takes place after a disk-like collapse or in substructures, the impact of photoionization will be greater and the inferred mass of the host halo can be larger. For example, some evidence was found that high-z sub-millimeter galaxies are rotationally-supported (e.g., Goto & Toft, 2015).
On the observational side, we should note that halo mass estimates of LAEs depends on the age of the stellar population, and thus there remains uncertainty. If the halo mass of LAEs are , the lack of LAEs in our QSO field is consistent with the suppression scenario.
The suppression scenario could explain the detection of LBGs in Utsumi et al. (2010). LBGs are thought to have older stellar population, and thus more massive than LAEs (Overzier et al., 2006). The host halo masses of typical LBGs are inferred to be one order of magnitude larger than those of LAEs from angular auto-correlation function measurements (Gawiser et al., 2007; Garel et al., 2015). The mass estimate of our LBGs is also uncertain because we do not have deep near-infrared data. However considering bright magnitude, they are likely to be massive galaxies with . If so, they could survive the UV radiation from the QSO (However, also see Bruns et al. (2012), who argue more massive halos up to 1.2 can be suppressed). Also being older galaxies, LBGs could have formed before the QSO turned on, while LAEs could not form after the QSO formation.
We should, however, keep in mind other possibilities. QSO’s radiation is thought to be strongly beamed. More suppression is expected in the beaming directions, while we do not see any angular dependence in LAEs and LBGs distributions. Among known z6 QSOs, our QSO is relatively faint, with =-25.2 and a black hole mass of 2.510 (Willott et al., 2010). The host galaxy of the QSO was not detected by ALMA (Willott et al., 2013), putting tight constraints on the SFR in the QSO host. It may therefore be possible that the QSO itself is in a low mass halo and therefore does not reside in a high density peak in the early Universe (Overzier et al., 2009).
Another possibility is that these LAEs in the field are dusty, and not detected in . It has been known that high-z ULIRGs and sub-millimeter galaxies are dusty and faint in optical, despite their large star-formation rate (e.g., Goto et al., 2015). If such galaxies are in the field, they could have escaped our observation.
However, to conclude any further, we need more reliable data in both quality and quantity. This work presented the first case at , where a QSO environment was investigated in a scale of 10 Mpc with a narrow-band filter. Even including studies with smaller FoV, there are only a few more examples of the narrow-band studies at z6, due to the rarity of QSOs and few available windows for narrow-band observations. With the emergence of recent large surveys, much larger number of high-z QSOs are being found (Bañados et al., 2016), some of which have redshift corresponding to the narrow-band filter’s (Bañados et al., 2013). For example, recently discovered are several QSOs at z=6.6 (Tang et al., 2017), whose Ly emission can be observed with a narrow-band filter, . It will be important future work to investigate environment of such QSOs using the narrow-band technique to obtain statistically robust results.
Acknowledgments
We thank the anonymous referee and R. Overzier for many insightful comments. We are very grateful to all of the Subaru Telescope staff. We acknowledge grant aid for the narrow band filter from the Department of Astronomical Sciences of the Graduate University for Advanced Studies (SOKENDAI). YU was supported by JSPS KAKENHI Grant Number JP26800103, JP24103003. TG acknowledges the support by the Ministry of Science and Technology of Taiwan through grant NSC 103-2112-M-007-002-MY3, and 105-2112-M-007-003-MY3.
References
- Bañados et al. (2013) Bañados E., Venemans B., Walter F., Kurk J., Overzier R., Ouchi M., 2013, ApJ , 773, 178
- Bañados et al. (2016) Bañados E., Venemans B. P., Decarli R., et al., 2016, ApJS , 227, 11
- Bruns et al. (2012) Bruns L. R., Wyithe J. S. B., Bland-Hawthorn J., Dijkstra M., 2012, MNRAS , 421, 2543
- De Rosa et al. (2011) De Rosa G., Decarli R., Walter F., et al., 2011, ApJ , 739, 56
- Djorgovski et al. (2003) Djorgovski S. G., Stern D., Mahabal A. A., Brunner R., 2003, ApJ , 596, 67
- Francis & Bland-Hawthorn (2004) Francis P. J., Bland-Hawthorn J., 2004, MNRAS , 353, 301
- Garel et al. (2015) Garel T., Blaizot J., Guiderdoni B., Michel-Dansac L., Hayes M., Verhamme A., 2015, MNRAS , 450, 1279
- Gawiser et al. (2007) Gawiser E., Francke H., Lai K., et al., 2007, ApJ , 671, 278
- Goto et al. (2015) Goto T., Oi N., Ohyama Y., et al., 2015, MNRAS , 452, 1684
- Goto & Toft (2015) Goto T., Toft S., 2015, AAp , 579, A17
- Goto et al. (2009) Goto T., Utsumi Y., Furusawa H., Miyazaki S., Komiyama Y., 2009, MNRAS , 400, 843
- Goto et al. (2011) Goto T., Utsumi Y., Hattori T., Miyazaki S., Yamauchi C., 2011, MNRAS , 415, L1
- Husband et al. (2015) Husband K., Bremer M. N., Stanway E. R., Lehnert M. D., 2015, MNRAS , 452, 2388
- Kashikawa et al. (2007) Kashikawa N., Kitayama T., Doi M., Misawa T., Komiyama Y., Ota K., 2007, ApJ , 663, 765
- Kikuta et al. (2017) Kikuta S., Imanishi M., Matsuoka Y., Matsuda Y., Shimasaku K., Nakata F., 2017, Accepted for publication in ApJ
- Kim et al. (2009) Kim S., Stiavelli M., Trenti M., et al., 2009, ApJ , 695, 809
- Matthee et al. (2015) Matthee J., Sobral D., Santos S., Röttgering H., Darvish B., Mobasher B., 2015, MNRAS , 451, 400
- Mazzucchelli et al. (2017) Mazzucchelli C., Bañados E., Decarli R., et al., 2017, ApJ , 834, 83
- Ouchi et al. (2010) Ouchi M., Shimasaku K., Furusawa H., et al., 2010, ApJ , 723, 869
- Overzier (2016) Overzier R. A., 2016, Astronomy and Astrophysics Reviews, 24, 14
- Overzier et al. (2006) Overzier R. A., Bouwens R. J., Illingworth G. D., Franx M., 2006, ApJL , 648, L5
- Overzier et al. (2009) Overzier R. A., Heckman T. M., Tremonti C., et al., 2009, ApJ , 706, 203
- Pentericci et al. (2011) Pentericci L., Fontana A., Vanzella E., et al., 2011, ApJ , 743, 132
- Schenker et al. (2014) Schenker M. A., Ellis R. S., Konidaris N. P., Stark D. P., 2014, ApJ , 795, 20
- Schlegel et al. (1998) Schlegel D. J., Finkbeiner D. P., Davis M., 1998, ApJ , 500, 525
- Shimasaku et al. (2005) Shimasaku K., Ouchi M., Furusawa H., Yoshida M., Kashikawa N., Okamura S., 2005, PASJ , 57, 447
- Springel et al. (2005) Springel V., White S. D. M., Jenkins A., et al., 2005, Nature , 435, 629
- Stark et al. (2011) Stark D. P., Ellis R. S., Ouchi M., 2011, ApJL , 728, L2
- Stiavelli et al. (2005) Stiavelli M., Djorgovski S. G., Pavlovsky C., et al., 2005, ApJL , 622, L1
- Swinbank et al. (2012) Swinbank J., Baker J., Barr J., Hook I., Bland-Hawthorn J., 2012, MNRAS , 422, 2980
- Tang et al. (2017) Tang J.-J., Goto T., Ohyama Y., et al., 2017, accepted for MNRAS
- Taniguchi et al. (2005) Taniguchi Y., Ajiki M., Nagao T., et al., 2005, PASJ , 57, 165
- Utsumi et al. (2010) Utsumi Y., Goto T., Kashikawa N., et al., 2010, ApJ , 721, 1680
- Willott et al. (2010) Willott C. J., Albert L., Arzoumanian D., et al., 2010, AJ , 140, 546
- Willott et al. (2007) Willott C. J., Delorme P., Omont A., et al., 2007, AJ , 134, 2435
- Willott et al. (2013) Willott C. J., Omont A., Bergeron J., 2013, ApJ , 770, 13
- Zheng et al. (2006) Zheng W., Overzier R. A., Bouwens R. J., et al., 2006, ApJ , 640, 574