The molecular environment of the pillar-like features in the HII region G46.5-0.2
Abstract
At the interface of Hii regions and molecular gas peculiar structures appear, some of them with pillar-like shapes. Understanding their origin is important for characterizing triggered star formation and the impact of massive stars on the interstellar medium. In order to study the molecular environment and the influence of the radiation on two pillar-like features related to the Hii region G46.5-0.2, we performed molecular line observations with the Atacama Submillimeter Telescope Experiment, and spectroscopic optical observations with the Isaac Newton Telescope. From the optical observations we identified the star that is exciting the Hii region as a spectral type O4-6. The molecular data allowed us to study the structure of the pillars and a HCO+ cloud lying between them. In this HCO+ cloud, which have not any well defined 12CO counterpart, we found direct evidence of star formation: two molecular outflows and two associated near-IR nebulosities. The outflows axis orientation is perpendicular to the direction of the radiation flow from the Hii region. Several Class I sources are also embedded in this HCO+ cloud, showing that it is usual that the YSOs form large associations occupying a cavity bounded by pillars. On the other hand, it was confirmed that the RDI process is not occurring in one of the pillar tips.
keywords:
(ISM:) HII regions – (ISM): photodissociation region (PDR) – ISM: molecules – ISM: jets and outflows – stars: formation1 Introduction
Hii regions can generate dense layers of gas and dust in their surroundings. Very often, in the interface between the photo-dissociation region (PDR) and the molecular gas peculiar structures can appear, some of them with pillar-like shapes and cometary globules of dense gas. The pillars, also called “elephant trunks”, usually present a column-like structure with a head and a tail that physically connects with the molecular cloud. In our Galaxy they typically have a size between 1 and 4 pc, and a width between 0.1 and 0.7 pc (Gahm et al., 2006). Most of the mass in these pillars is concentrated in their heads where, in some cases, signatures of star formation are found (Ohlendorf et al., 2013; Smith et al., 2010a, b; Sugitani et al., 1989). The pillars were proposed to be transient features, being part of a continuous outwardly propagating wave of star formation driven by feedback from massive stars (Smith et al., 2010b). One of the main mechanism of star formation in such regions is the radiation-driven implosion (RDI), first proposed by Reipurth (1983). This process begins when the ionization front from the Hii region moves over a molecular condensation such as the head of a pillar-like feature, creating a dense outer shell of ionized gas, the ionized boundary layer (IBL). If the IBL is over-pressured with respect to the molecular gas within the head of the pillar, shocks are driven into it compressing the molecular material until the internal pressure is balanced with the pressure of the IBL. At this stage the collapse of the clump begins a process leading to the creation of a new generation of stars (Lefloch & Lazareff, 1994; Bertoldi & McKee, 1990). Recent theoretical and observational studies of pillars related to Hii regions and possible star formation linked to them can be found in Hartigan et al. (2015) and Tremblin et al. (2013, 2012). These studies highlight the importance of understanding the origin of these structures in order to shed light on issues such as triggered star formation and the impact of massive stars on the initial mass function.
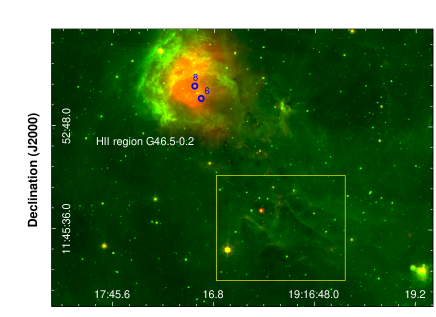
G46.5-0.2 (hereafter G46) is an Hii region located at a distance of about 4 kpc and spanning an angular size of 8′ (see Paron et al. 2015 and references therein). It lies on the border of the molecular cloud GRSMC G046.34-00.21 (Rathborne et al., 2009). In the south-west direction, about 10′ away from G46 and associated with the molecular cloud there are two pillar-like features that are bright at 8 m and are oriented such that they point towards the open border of G46. Figure 1 shows a two-colour composite image of the G46 field where the Spitzer-IRAC 8 m emission is displayed in green and the Spitzer-MIPSGAL at 24 m in red. The region of the pillar-like features is shown with a yellow rectangle. Based on the pillars orientation and the similarity between the recombination line velocity of the Hii region and the velocity of the molecular gas associated with the pillars, Paron et al. (2015) (hereafter Paper I) proposed that G46 and the pillar-like features are located at the same distance. Thus it was concluded that the pillars were carved and sculpted by the ionizing flux from G46. Through a photometric analysis presented in Paper I the authors look for candidates for the Hii region exciting star(s). They find that sources 6 and 8 are the most likely to be O-type stars (blue circles in Fig. 1). In addition, two concentrations of young stellar object (YSO) candidates were found and considered to be embedded in the molecular cloud GRSMC G046.34-00.21. One of these YSO concentrations is closer to the G46 open border and consists of Class II type source candidates, and the other is mostly composed of Class I type YSO candidates and is located just ahead of the pillar-like features, suggesting an age gradient in the YSO distribution. In an attempt to find a possible mechanism for star formation in the region, the authors performed a rough pressure balance study using publicly available 13CO J=1–0 data (46′′ in angular resolution) towards the tips of the pillars. They found that the internal pressure of the neutral gas in the pillar-like features heads is larger than the external pressure due to the ionized gas stalling at their tips, implying that RDI is not happening.
Taking into account that it is not common to find such large angular separation between Hii regions and their related pillars structures, and so well defined scenario without confusion from the usual clustering of Hii regions as in G46, this is an interesting case to revisit it using better data in order to physically and chemically characterize the pillars and study the influence of the radiation on them. This new study points to determinate whether the RDI process is ongoing or not, and to find direct evidence of star formation activity associated with the pillars and their surroundings. Thus, using new molecular line observations obtained with the Atacama Submillimeter Telescope Experiment (ASTE), optical spectroscopic observations from the IDS at the Isaac Newton Telescope (INT), and public near- and mid-IR data we performed a detailed study of the molecular environment towards the pillar-like features and the radiation flux arriving to them.
2 Observations and data reduction
2.1 Optical observations
In order to identify the source exciting G46 and obtain a more accurate estimate for the photon flux reaching the pillar tips, we performed spectroscopic optical observations of two stars, sources 6 and 8 from Paper I (blue circles in Fig. 1), which from photometric considerations were suspected to be O-type stars. These observations were performed on 2016 May 12 with the Intermediate Dispersion Spectrograph (IDS) at the Isaac Newton Telescope on La Palma, Spain. IDS observations were carried out using the EEV10 detector with the R632V grating (dispersion 0.9 Å pix-1) in a central wavelength at 4800 Å providing a resolution of R 2500. Exposure times were 2400 sec and 300 sec for source 8 and source 6 respectively. The images were reduced and spectra extracted with IRAF software111IRAF is distributed by the National Optical Astronomy Observatory, which is operated by the Association of Universities for Research in Astronomy (AURA) under a cooperative agreement with the National Science Foundation. following the standard procedures for long-slit optical spectroscopic observations. The spectra, in digital counts, were normalized to infer the spectral type of the stars.
2.2 Molecular observations
The molecular observations were performed on 2015 August 25-27 with the 10-m ASTE telescope (Ezawa et al., 2004). The CATS345 GHz band receiver, a two-single band SIS receiver remotely tunable in the LO frequency range of 324-372 GHz, was used. The XF digital spectrometer was set to a bandwidth and spectral resolution of 128 MHz and 125 kHz, respectively. The spectral velocity resolution was 0.11 km s-1 and the half-power beamwidth (HPBW) was 22′′ at 345 GHz. The system temperature varied from T to 250 K. The absolute intensity calibration was made with observations of W51D (19:23:39.85, +14:31:10.1, J2000) and the intensity variation was estimated to be less than 7%. The main beam efficiency was . The pointing accuracy was checked by observing RAql (19:06:22.254, +08:13:47.57, J2000) and it was within 5′′. The sky opacity varied from 0.04 to 0.06.
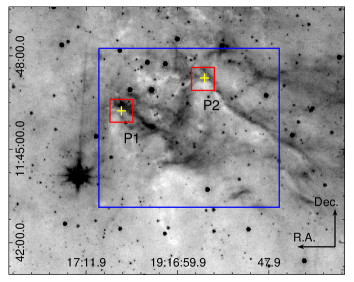
We observed a region of 5851 centered at 19:16:58.4, +11:45:41.6 (J2000) (blue box in Fig. 2) with a grid spacing of 22′′ in the 12CO J=3–2 and HCO+ J=4–3 transitions with an integration time of 25 sec per pointing. As shown in Fig. 2 the eastern pillar is called P1, while the western one is called P2. Additionally we observed two regions of with a grid spacing of 22′′ in the HCN J=4–3 line (red boxes in Fig. 2). The centers of these regions are: 19:16:56.6, +11:47:15.7 (J2000) (P1 head), and 19:17:07.3, +11:46:14.2 (J2000) (P2 head). The integration time was 500 sec per pointing. We also observed the heads of the pillar-like features with single pointings in the HNC J=4–3, 13CO J=3–2 and CS J=7–6 lines with an integration time of 500 sec per pointing for the HNC and 120 sec per pointing for the other lines. The observed positions, marked with yellow crosses in Fig. 2, are: 19:16:56.4, +11:47:17.5 (J2000), and 19:17:07.3, +11:46:15.0 (J2000). All observations were performed in position switching mode.


The data were reduced with NEWSTAR222Reduction software based on AIPS developed at NRAO, extended to treat single dish data with a graphical user interface (GUI). and the spectra processed using the XSpec software package333XSpec is a spectral line reduction package for astronomy which has been developed by Per Bergman at Onsala Space Observatory.. The spectra were Hanning smoothed to improve the signal-to-noise ratio, and in some cases a boxcar smoothing was also applied. Polynomials between first and third order were used for baseline fitting.
3 Results
3.1 Identifying the stars causing G46 excitation
From the optical spectroscopic analysis of sources 6 and 8 (see Fig. 1) we determine that source 6 cannot be the contributor to the ionization of the region. Following the Gray’s Digital Spectral Classification Atlas444http://ned.ipac.caltech.edu/level5/Gray/frames.html, its spectrum (Fig. 3 bottom) suggests that this source is a G-type star, which would be unable to generate an Hii region. Source 8 suffers high-extinction (B–R3.6) being relatively faint at blue wavelengths, hence the blue portion of the spectrum, which contains the He lines commonly used for O spectral classification is very noisy. Nevertheless, in the range from 5400 to 5900 Å the lines of He II 5411 and He I 5876 are clearly visible (see Fig. 3 up). The ratio [He II]/[He I] from these two lines corresponds well with the spectral-type sequence, in which, according to Walborn 1980, He I 5876 is present from type O4 to later types, and a ratio corresponds to a type O7. Therefore, according to the observed ratio [He II 5411]/[He I 5876] for source 8 and comparing with ratios of [He II 4541]/[He I 4471] and [He II 4541]/[He I 4387] in Walborn & Fitzpatrick 1990, we can infer that source 8 is a O4-6 star.
3.2 Molecular environment related to the pillars
As studied in Paper I and mention here in Sect. 1, the velocities of the molecular gas concentrations related to the pillars are similar to the recombination line velocity of the Hii region G46, thus along this work it is assumed that all of these structures are located at the same distance.
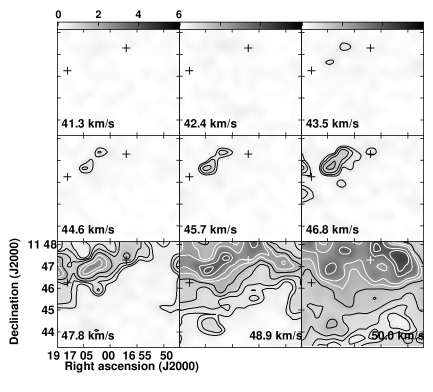
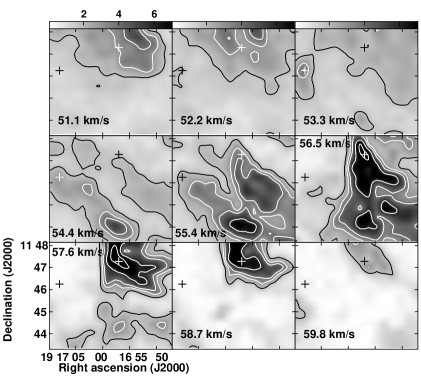
We analysed the 12CO J=3–2 data cube along the whole velocity axis in order to find molecular structures associated with the pillar-like features delineated by the IR emission at 8 m. In Fig. 4 the 12CO integrated emission is presented in channel maps in steps of 1.1 km s-1 along the velocity interval from 41 to 60 km s-1. The positions of the pillars heads are indicated with crosses in each panel. Abundant molecular gas towards the north of the surveyed region and not related to the pillars can be distinguished in the range 43–53 km s-1. Between 43.5 and 48.9 km s-1 there is an interesting structure with a bilobed shape towards the northeast and lying between both pillars, which will be studied in Sect. 3.3. It can be appreciated that in the velocity interval of 53.3–56.5 km s-1 there are some molecular structures that are likely associated with the pillar-like features, while in the other velocities it appears clumpy molecular structures without any morphological correspondence with the pillars.
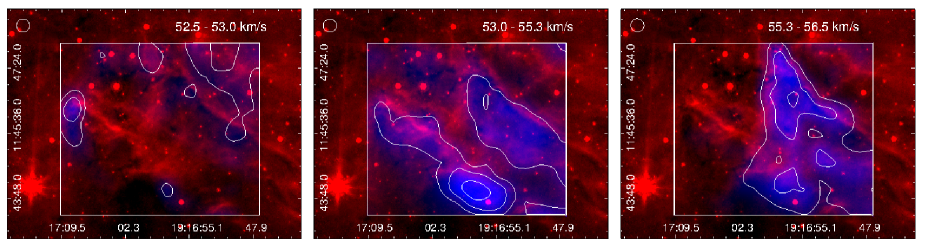
The molecular structures associated with the pillars extend along narrow velocity intervals. This is shown in Fig. 5 where the molecular gas emission is superimposed to the 8 m emission. The most remarkable morphological association between the molecular gas and the 8 m emission is between 55.3 and 56.5 km s-1 in the pillar P2 (right panel in the Figure). Then, between 53.0 and 55.3 km s-1 (middle panel), there is a weak feature related to P2, and another one associated with P1 with a peak towards its base. A clump associated with the P1 tip appears between 52.5 and 53.0 km s-1 (left panel), showing that the molecular gas associated with this pillar is more clumpy than the gas associated with P2.
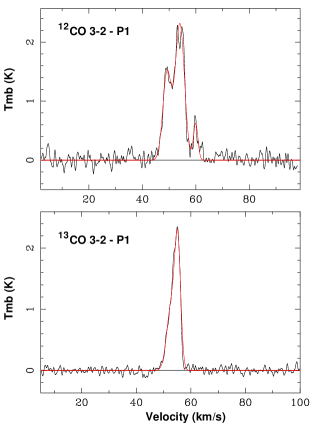
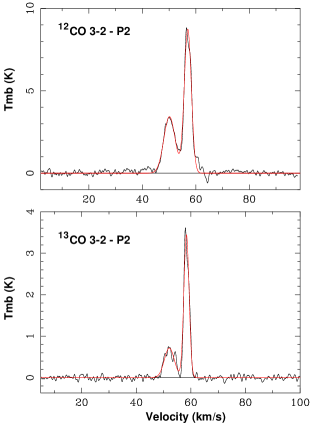
Figure 6 shows the 12CO and 13CO spectra obtained in the location of the yellow crosses shown in Fig. 2, i.e. the heads of the pillar-like features. The CS J=7–6 emission was not detected at these positions. Table 1 lists the line parameters obtained from Gaussian fits to these spectra (superimposed in red in the figure). The 12CO spectrum from the head of P1 was fitted with three Gaussians. Two main components within the velocity range 45–55 km s-1 can be seen with a smaller component centered at km s-1. The 13CO spectrum is less complex and could be fitted with two Gaussians, the counterparts of the 12CO main components. In the case of the P2 head, both CO isotopes were fitted with two Gaussians showing the presence of two molecular components towards this region.
| Line | Tmb | vLSR | v |
|---|---|---|---|
| (K) | (km s-1) | (km s-1) | |
| 12CO (3–2) - P1 | 1.48 | 49.23 | 3.70 |
| 2.30 | 54.03 | 5.00 | |
| 0.62 | 59.94 | 1.97 | |
| 13CO (3–2) - P1 | 1.06 | 52.82 | 3.83 |
| 1.91 | 55.20 | 2.53 | |
| 12CO (3–2) - P2 | 3.43 | 50.13 | 4.97 |
| 8.73 | 57.00 | 3.10 | |
| 13CO (3–2) - P2 | 0.71 | 52.10 | 4.30 |
| 3.44 | 58.36 | 2.24 |
To derive the molecular mass contained in the heads of the pillar-like features, local thermodynamic equilibrium (LTE) was assumed. Following the standard LTE procedures we obtain a 12CO column density, N(12CO), for each pillar head. For the details of the formulae see e.g. Paron et al. (2012). From the ratio of the (12CO) to (13CO) peaks can be derived the 12CO and 13CO optical depths (, ). As shown in Fig. 6 and in Table 1, the 12CO and 13CO spectra have more than one component, and thus at least a couple of and could be obtained for each pillar head. By inspecting the central velocities and v of each component (see Table 1) we selected the (12CO) and (13CO) peaks that are within the velocity intervals in which each pillar extends (see Fig. 4), thus we used the components at 55 km s-1 and 58 km s-1 for P1 and P2, respectively. Assuming a canonical [12CO]/[13CO] isotope abundance ratio of 50, we estimate the optical depths in and for the P1 head, and and for the P2 head. Due to the high optical depth of the 12CO emission, it is not possible to obtain reliable mass values from the 12CO column density. Thus using the derived values we calculate the 13CO column densities from each single pointing at P1 and P2. The excitation temperature (T K used in both cases) was obtained from the 12CO spectra at the tips of each pillars. Assuming that the 13CO emission is uniformly distributed in the pillars heads, i.e. it is assumed that the column density value is the same at all beam positions within a circle delimited by the curvature of the tip of the pillars, we estimate a total 13CO column density for each pillar head. Finally, the H2 column densities were derived from N(H2) N(13CO)/, where (e.g. Yamaguchi et al. 1999), and the mass is derived from:
| (1) |
where is the solid angle subtended by the beam size, is the distance of 4 kpc, is the hydrogen mass, and is the mean molecular weight, assumed to be 2.8 by taking into account a relative helium abundance of 25%. The obtained masses for the head of P1 and P2 are about 60 M⊙ and 30 M⊙, respectively.
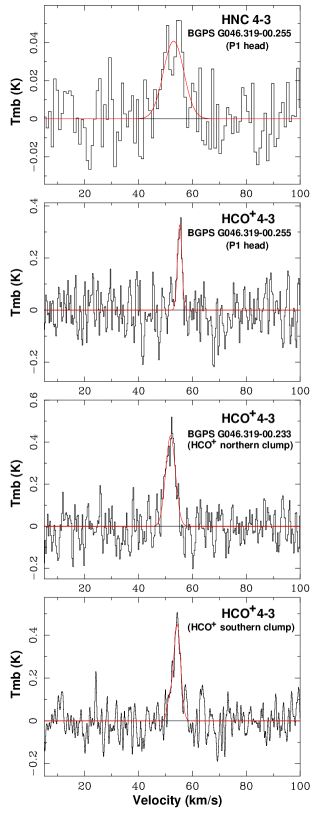
Analyzing the HCO+ J=4–3 cube we found emission in a region between the pillar-like features (see Fig. 7). The HCO+ structure is composed of two clumps (hereafter HCO+ northern and southern clumps). The centre of the northern one coincides in projection with the peak of the 1.1 mm emission source BGPS G046.319-00.233 (Rosolowsky et al., 2010) and with the 12CO bilobed structure described above. Besides this positional coincidence, it is worth noting that at the HCO+ structure position, i.e. the region between both pillars, there is not a well defined 12CO structure (see Fig. 4). In addition, some weak HCO+ emission appears towards the head of P1 in coincidence with the source BGPS G046.319-00.255. At this position we also detected HNC J=4–3, which is shown in Fig. 8 together with the HCO+ spectra towards the peak of the mentioned BGPS sources and the southern HCO+ clump. The line parameters obtained from Gaussian fits to these spectra are presented in Table 2. Towards the head of P2, which also coincides with a millimeter continuum source (BGPS G046.314-00.213), was not detected HCO+J=4–3. Finally, HCN J=4–3 emission was not detected in either of the pillar-like features.
With the parameters obtained from our data and those for the HCO+ J=3–2 from Shirley et al. (2013) also included in Table 2, we performed a non-LTE study of P1 head and the northern HCO+ clump using the Radex code (van der Tak et al., 2007). In order to compare both sets of data, our HCO+ J=4–3 spectra were convolved with a beam of 30′′ from the Shirley et al. HCO+ J=3–2 observations. The Radex calculations were made for different kinetic temperatures in the range between 20 and 100 K. The results are presented in Table 3. In the case of P1 head Radex does not converge for a T K.
| Line | Tmb | vLSR | v | |
|---|---|---|---|---|
| (K) | (km s-1) | (km s-1) | (K km s-1) | |
| BGPS G046.319-00.233 (HCO+ northern clump) | ||||
| HCO+(4–3) | 0.43 | 51.87 | 4.25 | 1.87 |
| HCO+(3–2)* | 0.53 | 52.40 | 3.80 | 2.27 |
| (HCO+ southern clump) | ||||
| HCO+(4–3) | 0.45 | 54.32 | 3.05 | 1.68 |
| BGPS G046.319-00.255 (P1 head) | ||||
| HCO+(4–3) | 0.33 | 55.26 | 1.90 | 0.68 |
| HCO+(3–2)* | 0.35 | 54.70 | 3.20 | 1.03 |
| HNC (4–3) | 0.04 | 53.02 | 8.90 | 0.37 |
| * from Shirley et al. (2013). | ||||
| Tk (K) | N (cm-2) | n (cm-3) |
|---|---|---|
| BGPS G046.319-00.233 (HCO+ northern clump) | ||
| 20 | ||
| 30 | ||
| 50 | ||
| 100 | ||
| BGPS G046.319-00.255 (P1 head) | ||
| 20 | ||
| 30 | ||
| 50 | ||
| 100 | – | – |
Additionally we estimate the dust temperature, , and the H2 column density for P1 head and the HCO+ northern clump from the Herschel public data at 160, 250, 350, and 500 m (OBsId 1342207054 and 1342207055) and the ATLASGAL data at 870 m (from Urquhart et al. 2014). Assuming dust emission in the optically thin regime the surface brightness, Iν, can be expressed as a gray-body function for a single temperature
| (2) |
where is the blackbody function for a dust temperature , the conversion factor from H2 to total gas mass, assumed to be 2.8 by considering an He abundance of 25%, the atomic hydrogen mass and the dust opacity per unit mass, where is assumed to be 0.1 cm2g-1 at 1 THz (Beckwith et al., 1990) under a gas-to-dust ratio of 100 and (Anderson et al., 2012). Then, we performed an SED fitting with and N(H2) as free parameters where the surface brightness was obtained from the level 2.5 Herschel data and from the catalogued ATLASGAL sources. All the emissions were convolved to the same resolution 44′′, and rebinned to the same pixel size 14′′. We determined that and N(H2) are about 18 K and cm-2, and 20 K and cm-2, for the HCO+ northern clump and the P1 head, respectively. The errors involved in the temperatures and column densities are about 10% and 40%, respectively. From these results, if we assume that the dust and gas are coupled, and thus , we can favour the Radex results for T K for both molecular concentrations. In this way we estimate the HCO+ abundances, and for the HCO+ northern clump and P1 head, respectively.
Additionally from the same SED fitting procedure it was obtained the and N(H2) for the P2 head (source BGPS G046.314-00.213) in about 18 K and cm-2. Using the N(H2) obtained in P1 and P2 from the SED fitting in Eq. 1 we estimate the masses in an independent way as done above with the 13CO emission, obtaining about 80 M⊙ for both pillars head.
3.3 Direct evidence of star formation in the region
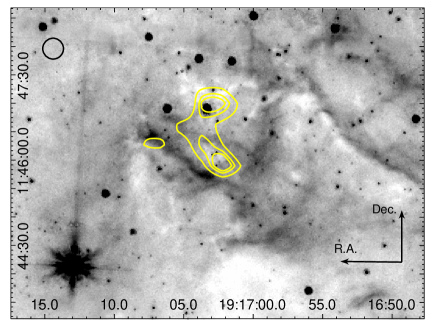
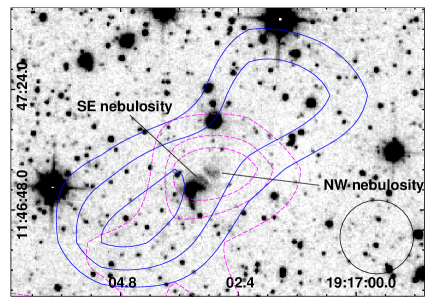
Given that in Paper I it was shown the existence of several YSO candidates in the region between the pillars, we inspected the Ks -band emission obtained from the UKIDSS Survey looking for signatures of extended emission likely to be related to outflow activity. We found an interesting structure composed of two nebulosities extending from southeast to northwest lying at the HCO+ northern clump related to the BGPS G046.319-00.233 source (see Fig. 9). The figure also demonstrates that both nebulosities are separated by a region of low Ks emission. Interestingly, this near-IR structure lies at the same position of the northeastern bilobed molecular feature that appears between 43.5 and 48.9 km s-1 shown in Fig. 4. By integrating the 12CO emission along the velocity range 42–50 km s-1, two conspicuous molecular lobes appear (blue contours in Fig. 9) that extend, as the near-IR features, from southeast to northwest. The near-IR features mentioned above are located, in projection, almost at the center of these lobes, which strongly suggest that we are observing molecular outflows generated by the same source that produced the near-IR features. The lengths of the outflows are 50′′ and 44′′, for the northwestern and southeastern lobes, respectively, which at the distance of 4 kpc implies about 0.9 and 0.8 pc, respectively.
4 Discussion
From the new molecular data presented in this work we confirm that the gas related to the pillar-like features embedded in the large molecular cloud GRSMC G046.34-00.21 and associated with the Hii region G46 extends along narrow velocity intervals. These pillars contain embedded cold submm cores as was found toward similar structures in the Eagle Nebula (White et al., 1999). The derived masses for P1 and P2 heads from the new molecular observations are about 60 and 30 M⊙, respectively. These values are in quite agreement with the mass obtained from the dust emission (about 80 M⊙ in both pillar heads). It is worth noting that these values are one order of magnitude lower than those obtained in Paper I using the 13CO J=1–0 line. Given that this discrepancy is large and it can not be explained just through the use of different lines, the values from Paper I were revised. After a carefully inspection of the mass estimate procedure done in Paper I we noticed that it was wrongly used a larger area than the actual extension of the pillars heads, yielding overestimated values. The actual mass values derived from the 13CO J=1–0 line are between 60 and 80 M⊙ for both pillars heads in completely agreement with the values obtained here. It is important to remark that the volumetric density values in Paper I do not change significantly, and hence the RDI analysis and its conclusion do not change.
We conclude that the mass of the pillars heads ranges from 30 to 80 M⊙, which is in agreement with masses of pillars heads found in several regions (Gahm et al., 2006; White et al., 1999) and with values obtained from 3D dynamical models used to study the formation of these kind of structures (Mackey & Lim, 2010).
In this work we have mainly analysed three molecular structures: the pillar-like features P1 and P2, and a cloud observed in the HCO+ J=4–3 line lying between both pillars and composed of two clumps. Even though these features are embedded in the same large molecular cloud, we found different physical conditions between them. We suggest that it could be due to the fact that these features may be exposed in different ways to the UV radiation. It is possible that P2 is more exposed to the radiation flow from G46 than P1. The non-detection of HCO+ towards P2, and the HCO+ abundances obtained in P1 and the HCO+ northern clump may be explained through different ionization rates within the region. As is stated in Goicoechea et al. (2009), HCO+ is mainly destroyed via dissociative recombination, and thus its abundance is inversely proportional to the electron abundance. The structures belonging to the large and clumpy molecular cloud that are more exposed to the radiation from the Hii region are expected to have a higher electron abundance than the less exposed ones. We remark that this is quite a simple conclusion based only in the HCO+ analysis, and as Goicoechea et al. (2009) pointed out, it is necessary to consider also the abundances of metals, PAHs, other ions, and cosmic rays. In the case of the HCO+ northern clump this situation is more complex because, as it is presented and discussed in Sects. 3.3 and 4.2, this clump presents outflow activity, which according to Rawlings et al. (2004) may increase the HCO+ abundance. Nevertheless our result gives support to different ionization rates along the region.
From the optical spectroscopic results of the star named source 8 (an O4-6 type star), together with the previous photometric analysis (see Paper I) and considering its location, exactly at the center of G46 Hii region, we can conclude that this source is indeed responsible for the ionization of the region. This more accurate determination of the spectral type of the ionizing star allows us to derive a better estimate of the amount of UV photons arriving at the pillars. Given that P2 could be the more exposed structure to the radiation from the Hii region, the analysis was done only for this structure. Following the same procedure as described in Paper I we estimate an upper limit for the predicted photon flux impinging on the P2 head in cm-2s-1. Thus, according to Bisbas et al. (2011), who suggested that triggered star formation through RDI occurs only when cm-2s cm-2s-1, we can conclude that in the head of P2 it is unlikely that triggered star formation is ongoing.
4.1 HCN and HNC in the pillars
The HCN J=4–3 line was not detected in any pillar and the HNC J=4–3 line was detected only at P1 tip. Taking into account that usually both isomeres are detected in the same region and it is expected that the HNC/HCN ratio is on the order of unity in cold regions (Herbst, 1978; Schilke et al., 1992), it is intriguing to consider why at the P1 tip, a region that coincides with a catalogued dark cloud, HNC is detected and not HCN. It could be that the HNC has higher abundance than the HCN, being the HCN abundance low enough to be below the detection limit for these observations. This is indeed possible because, according to Hirota et al. (1998), the recombination reaction HCNH+ + e- HNC + H, HCN + H, one of the main possible chemical paths for the formation of these isomeres, leads a higher abundance of HNC than of HCN. On the other hand, Chenel et al. (2016) point out that in the interstellar regions exposed to an intense UV radiation field, HCN should be more abundant than HNC. The destruction of both isomers in such regions is dominated by photodissociation rather than by chemical reactions with radicals or ions, and the authors found that HNC is destroyed faster than HCN. In the case of the P1 head, it is likely that this structure is not strongly irradiated by the UV photons and hence the UV destruction mechanism is not ongoing. At the P2 head, which may be more exposed to the radiation, it could be possible that the HCN and HNC have been totally destroyed by the UV radiation. This is in agreement with the results from the HCO+analysis discussed in the previous Section.
4.2 Confirming star formation
We find direct evidence of star formation at the HCO+ northern clump in both near-IR and molecular line emissions. The near-IR emission shows the presence of two nebulosities separated by a region of low emission. Taking into account that the discovered molecular outflows extend along the same direction as the near-IR nebulosities, we suggest that the IR emission arises from cavities cleared in the circumstellar material. These kind of cavities can be generated by the action of winds from the YSO (Shu et al., 1995; Reipurth & Bally, 2001), or by precessing jets that clear the circumstellar material (e.g. Kraus et al. 2006). The orientation of the nebulosities and the analysis of the molecular lobes strongly suggests that the outflows extend mainly in the plane of the sky. This may explain why a central point source is not seen at near-IR emission, it being probable that we are observing the YSO system in an edge-on orientation and the central source is likely hidden behind the disc (e.g. Perrin et al. 2006). In this scenario the central source and the disc must lie in the region of low near-IR emission between the two nebulosities. This YSO system and most of the Clase I YSO candidates found in Paper I are embedded in the mapped HCO+ cloud lying between both pillars, which based on what was observed by Smith et al. (2010a) in the Carina Nebula, seems to be common. As the authors concluded, the YSOs tend to form large associations occupying a cavity that is bounded by pillars. It is important to note that the observed HCO+ cloud has not a well defined counterpart in the 12CO emission, suggesting that the external layers of the molecular gas traced by the 12CO emission were disrupted by the massive star feedback.
The mass and size of the discovered molecular outflows are similar to those found at several sources catalogued as massive molecular outflows (Beuther et al., 2002), suggesting that we are indeed observing a massive YSO. It is worth noting that its outflows axis orientation is perpendicular to the direction of the Hii region open border, and hence to the direction of the radiation flow. This orientation was also found in several YSOs in the Carina Nebula (Smith et al., 2010a). Using 3D simulations, Lora et al. (2009) proposed that the interaction between an advancing ionization front and a neutral cloud, wherein compressed clumps of gas that form at the unstable interface tend to collapse and have angular momentum vectors perpendicular to the direction of the radiation flow. The YSO system described here could be considered as a new observational evidence of this phenomena, aiming for further theoretical studies in which the large distance (about 10 pc) between the YSO and the radiation source should be taken into account.
5 Summary and concluding remarks
Using the ASTE telescope and public IR data we investigated in detail the molecular environment related to two pillar-like features likely generated by the Hii region G46.5-0.2 (G46). Additionally, using the INT telescope we found the star that is exciting this Hii region. The main results of this study are summarized as follows:
(1) From the 12CO J=3–2 emission we found that the molecular structure of the pillar-like features extend along narrow velocity intervals. It was observed that P2 has the expected morphology of the pillars, while the molecular emission at P1 is more clumpy and the main mass concentration is not in its head. P1 may be in an earlier evolutionary stage in the formation of these kind of pillars.
(2) The HCO+ J=4–3 emission was found to be concentrated in a cloud lying between both pillars and composed of two clumps. This cloud has not any well defined 12CO counterpart. Faint HCO+ emission was detected towards the head of P1 where HNC J=4–3 emission was also detected. At the P2 tip, emission from these species was not detected. From a HCO+ abundance analysis it is suggested that P2 could be more exposed to the radiation from G46 than P1.
(3) From the optical spectroscopic observation it was determined that the so-called source 8 (from Paper I) is an O4-6 star. Thus, from its position and spectral type we conclude that this is the source responsible for ionizing the region.
(4) From the spectral type determination of the ionizing source we obtained a more accurate value for the amount of UV flux arriving at P2. We conclude that it is unlikely that the RDI process is ongoing in the P2 head.
(5) We found direct evidence of star formation towards the cloud mapped in the HCO+ emission. From the 12CO J=3–2 line we detected two massive molecular outflows extended mainly along the plane of the sky coinciding with two nebulosities separated by a region of low emission seen at near-IR emission. We propose that we are observing an YSO system in an edge-on position.
The confirmed star formation activity in the analysed region is occurring in a molecular clump that it is bounded by the pillar-like features, which it seems to be common to find in such regions, confirming that the pillars are transient structures that are part of a continuous outwardly propagating wave of star formation driven by the feedback from massive stars as proposed by Smith et al. (2010b). The mapped HCO+ cloud, in which it is embedded the discovered outflows source and most of the Class I sources shown in Paper I, has not a well defined counterpart in the 12CO emission. It suggests that the external layers of the molecular cloud were disrupted by the radiation from G46, which is in agreement with a scenario of star formation driven by the radiation from massive stars. Additionally, it was found that the outflows axis orientation of the discovered YSO is perpendicular to the direction of the radiation flow in agreement with the results of simulations performed by Lora et al. (2009). Taking into account the large distance (about 10 pc) between the massive star and the YSO, this can be an important observational evidence to motivate the study of this phenomena in such radiation source/YSO configuration.
These new results strengthen the suggestion of a star formation gradient presented in Paper I generated by the action of the Hii region G46, in which the formation processes have stopped at the pillars tips.
Acknowledgments
We thank the anonymous referee for her/his very helpful comments and suggestions. The ASTE project is led by Nobeyama Radio Observatory (NRO), a branch of National Astronomical Observatory of Japan (NAOJ), in collaboration with University of Chile, and Japanese institutes including University of Tokyo, Nagoya University, Osaka Prefecture University, Ibaraki University, Hokkaido University, and the Joetsu University of Education. The INT is operated on the island of La Palma by the Isaac Newton Group in the Spanish Observatorio del Roque de los Muchachos of the Instituto de Astrofísica de Canarias. S.P., M.O., and A.P. are members of the Carrera del investigador científico of CONICET, Argentina. M.C.P. is a doctoral fellow of CONICET, Argentina. This work was partially supported by grants awarded by CONICET, ANPCYT and UBA (UBACyT) from Argentina. A.P. aknowledges the support from the Varsavsky Foundation. M.R. wishes to acknowledge support from FONDECYT(CHILE) grant No1140839. S.P. and A.P. are grateful to Dr. Takeshi Okuda for the support received during the ASTE observations.
References
- Anderson et al. (2012) Anderson, L. D., Zavagno, A., Deharveng, L., et al. 2012, A&A, 542, A10
- Beckwith et al. (1990) Beckwith, S. V. W., Sargent, A. I., Chini, R. S., & Guesten, R. 1990, AJ, 99, 924
- Bertsch et al. (1993) Bertsch, D. L., Dame, T. M., Fichtel, C. E., et al. 1993, ApJ, 416, 587
- Bertoldi & McKee (1990) Bertoldi, F., & McKee, C. F. 1990, ApJ, 354, 529
- Beuther et al. (2002) Beuther, H., Schilke, P., Sridharan, T. K., et al. 2002, A&A, 383, 892
- Bisbas et al. (2011) Bisbas, T. G., Wünsch, R., Whitworth, A. P., Hubber, D. A., & Walch, S. 2011, ApJ, 736, 142
- Chenel et al. (2016) Chenel, A., Roncero, O., Aguado, A., Agúndez, M., & Cernicharo, J. 2016, JChPh, 144, 144306
- Ezawa et al. (2004) Ezawa H., Kawabe R., Kohno K., Yamamoto S., 2004, in Society of Photo-Optical Instrumentation Engineers (SPIE) Conference, Vol. 5489, Society of Photo-Optical Instrumentation Engineers (SPIE) Conference Series, Oschmann Jr. J. M., ed., pp. 763–772
- Gahm et al. (2006) Gahm, G. F., Carlqvist, P., Johansson, L. E. B., & Nikolić, S. 2006, A&A, 454, 201
- Goicoechea et al. (2009) Goicoechea, J. R., Pety, J., Gerin, M., Hily-Blant, P., & Le Bourlot, J. 2009, A&A, 498, 771
- Graninger et al. (2014) Graninger, D. M., Herbst, E., Öberg, K. I., & Vasyunin, A. I. 2014, ApJ, 787, 74
- Hartigan et al. (2015) Hartigan, P., Reiter, M., Smith, N., & Bally, J. 2015, AJ, 149, 101
- Herbst (1978) Herbst, E. 1978, ApJ, 222, 508
- Hirota et al. (1998) Hirota, T., Yamamoto, S., Mikami, H., & Ohishi, M. 1998, ApJ, 503, 717
- Kraus et al. (2006) Kraus, S., Balega, Y., Elitzur, M., et al. 2006, A&A, 455, 521
- Lan et al. (2015) Lan, T.-W., Ménard, B., & Zhu, G. 2015, MNRAS, 452, 3629
- Lefloch & Lazareff (1994) Lefloch, B., & Lazareff, B. 1994, A&A, 289, 559
- Lockman (1989) Lockman, F. J. 1989, ApJS, 71, 469
- Lora et al. (2009) Lora, V., Raga, A. C., & Esquivel, A. 2009, A&A, 503, 477
- Mackey & Lim (2010) Mackey, J., & Lim, A. J. 2010, MNRAS, 403, 714
- Ohlendorf et al. (2013) Ohlendorf, H., Preibisch, T., Gaczkowski, B., et al. 2013, A&A, 552, A14
- Paron et al. (2012) Paron, S., Ortega, M. E., Petriella, A., et al. 2012, MNRAS, 419, 2206
- Paron et al. (2015) Paron, S., Ortega, M. E., Dubner, G., et al. 2015, AJ, 149, 193
- Perrin et al. (2006) Perrin, M. D., Duchêne, G., Kalas, P., & Graham, J. R. 2006, ApJ, 645, 1272
- Rathborne et al. (2009) Rathborne, J. M., Johnson, A. M., Jackson, J. M., Shah, R. Y., & Simon, R. 2009, ApJS, 182, 131
- Rawlings et al. (2004) Rawlings, J. M. C., Redman, M. P., Keto, E., & Williams, D. A. 2004, MNRAS, 351, 1054
- Reipurth (1983) Reipurth, B. 1983, A&A, 117, 183
- Reipurth & Bally (2001) Reipurth, B., & Bally, J. 2001, ARA&A, 39, 403
- Rosolowsky et al. (2010) Rosolowsky, E., Dunham, M. K., Ginsburg, A., et al. 2010, ApJS, 188, 123-138
- Schilke et al. (1992) Schilke, P., Walmsley, C. M., Pineau Des Forets, G., et al. 1992, A&A, 256, 595
- Shirley et al. (2013) Shirley, Y. L., Ellsworth-Bowers, T. P., Svoboda, B., et al. 2013, ApJS, 209, 2
- Shu et al. (1995) Shu, F. H., Najita, J., Ostriker, E. C., & Shang, H. 1995, ApJL, 455, L155
- Smith et al. (2010a) Smith, N., Povich, M. S., Whitney, B. A., et al. 2010, MNRAS, 406, 952
- Smith et al. (2010b) Smith, N., Bally, J., & Walborn, N. R. 2010, MNRAS, 405, 1153
- Sugitani et al. (1989) Sugitani, K., Fukui, Y., Mizuni, A., & Ohashi, N. 1989, ApJL, 342, L87
- Tremblin et al. (2012) Tremblin, P., Audit, E., Minier, V., Schmidt, W., & Schneider, N. 2012, A&A, 546, A33
- Tremblin et al. (2013) Tremblin, P., Minier, V., Schneider, N., et al. 2013, A&A, 560, A19
- Urquhart et al. (2014) Urquhart, J. S., Csengeri, T., Wyrowski, F., et al. 2014, A&A, 568, A41
- van der Tak et al. (2007) van der Tak, F. F. S., Black, J. H., Schöier, F. L., Jansen, D. J., & van Dishoeck, E. F. 2007, A&A, 468, 627
- White et al. (1999) White, G. J., Nelson, R. P., Holland, W. S., et al. 1999, A&A, 342, 233
- Walborn (1980) Walborn, N. R. 1980, ApJS, 44, 535
- Walborn & Fitzpatrick (1990) Walborn, N. R., & Fitzpatrick, E. L. 1990, PASP, 102, 379
- Yamaguchi et al. (1999) Yamaguchi, R., Saito, H., Mizuno, N., et al. 1999, PASJ, 51, 791