ISM conditions in z 0.2 Lyman-Break Analogs.
We present an analysis of far–infrared (FIR) [CII] and [OI] fine structure line and continuum observations
obtained with /PACS, and 12CO(1-0) observations obtained with the IRAM Plateau de Bure Interferometer,
of Lyman Break Analogs (LBAs) at .
The principal aim of this work is to determine the typical ISM properties of Main Sequence (MS)
galaxies, with stellar masses between and ,
which are currently not easily detectable in all these lines even with ALMA
and NOEMA.
We perform PDR modeling and apply different IR diagnostics to derive the main physical
parameters of the FIR emitting gas and dust and we compare the derived ISM properties
to those of galaxies on and above the MS at different redshifts.
We find that the ISM properties of LBAs are quite extreme (low gas temperature, high density and thermal pressure)
with respect to those found in local normal spirals and more active local galaxies.
LBAs have no [CII] deficit despite having the high specific star formation rates (sSFRs)
typical of starbursts.
Although LBAs lie above the local MS, we show that their ISM properties are more similar to those
of high-redshift MS galaxies than of local galaxies above the main
sequence.
This data set represents an important reference for planning future ALMA [CII] observations of
relatively low-mass MS galaxies at the epoch of the peak of the cosmic star formation.
Key Words.:
galaxies: evolution - galaxies: high-redshift- galaxies: ISM - Infrared: ISM - ISM: lines and bands1 Introduction
In the last decade, increasing observational and theoretical studies at low and high redshift
have shown that the conditions of the Interstellar Medium (ISM) in galaxies have a primary role in their evolution.
In the stellar mass () star formation rate (SFR) plane, star-forming galaxies (SFGs)
at all redshifts sampled so far (up to 6, Salmon et al., 2015) follow a tight correlation called the Main Sequence (MS) such that the
SFR increases with redshift for a given stellar mass.
Nevertheless, at a given stellar mass, the efficiency of forming stars
(i.e., the SFR per unit of molecular gas mass) is broadly constant for MS
galaxies at all redshifts, and the increase of the SFR with
is primarily driven by an increasingly high gas fraction
(Daddi et al., 2010b; Saintonge et al., 2011; Tacconi et al., 2010, 2013; Genzel et al., 2015).
Observations have also shown that the gas distribution and dynamical state of MS galaxies evolves with redshift.
Kinematic and dynamical studies of the ionized and molecular gas in MS SFGs
at the epoch where the cosmic star formation peaks, i.e., =2-3, have shown that by this
time the more massive MS galaxies have already formed regularly rotating disks similar to those of local star-forming galaxies.
However, the gas is clumpier and has a higher velocity dispersion than the gas in local MS galaxies
(Wisnioski et al., 2015).
Thus, the ISM dynamical state, the gas content, and the rate at which a galaxy is turning gas into stars
are amongst the fundamental parameters that regulate the evolution of a galaxy.
Most past studies of the ISM in high-redshift galaxies have analyzed
ionized and molecular gas. The cold neutral atomic medium is another important phase of the ISM in galaxies,
and its study can provide complementary information on the physical conditions in the ISM and hence on galaxy evolution.
One way to study this phase of the ISM is with observations of the [CII] (2P1/22P3/2) line at 157.7 m and the
[OI] (3P23P1) line at 63.2 m, the
most luminous far-infrared (FIR) fine structure lines: in local SFGs these lines
represent 0.1-1 of the FIR luminosity (Malhotra et al., 2001; Graciá Carpio et al., 2011).
These lines are the major coolants of the ISM, and therefore they are very important
for the energetic balance of the ISM.
The recent availability of new sensitive submillimeter interferometers has opened the possibility of observing
[CII] in high-redshift galaxies (Carilli Walter, 2013) where observation of the HI hyperfine line at 21 cm
is not yet possible. However, these observations are still challenging at , and so far restricted
to the most luminous and massive systems (QSOs, submillimeter galaxies, massive MS galaxies).
What is ultimately needed is the study of the cold atomic gas in high-redshift
MS SFG samples matching those already studied in
ionized and molecular gas.
An ideal sample is represented by the Lyman break galaxies (LBGs, Steidel et al., 1996),
selected using color criteria sensitive to the presence of a Lyman continuum break in an
otherwise very blue rest far-UV continuum in the redshift range . LBGs have been extensively studied
at many wavelengths and represent an obvious population to be observed in the [CII] line.
However, observations of such relatively low-infrared-luminosity systems at high redshift are still very
difficult even with the state–of–the–art receivers of modern submillimeter interferometers.
In order to study the ISM conditions in such systems in more detail, we have undertaken
a program to observe a small sample of local ( 0.2) analogs of LBGs,
(Lyman–break analogs or LBAs;
(Heckman et al., 2005, 2011; Hoopes et al., 2007; Overzier et al., 2008, 2009, 2010, 2011; Basu-Zych et al., 2007, 2009; Gonçalves et al., 2010) in [CII] and [OI] line emission
as well as in FIR continuum emission. Our study uses the PACS spectrometer and photometer (Poglitsch et al., 2010)
on–board the satellite (Pilbratt et al., 2010) as part of a guaranteed–time program
(P.I. A. Contursi). We also present 12CO(1-0) IRAM Plateau de Bure (PdBI) observations of some of our targets in order to
extend our analysis to their molecular gas.
With this work, we aim also to provide a unique
reference for designing ALMA [CII] and continuum observations of SFGs at the epoch where cosmic star
formation peaks.
The paper is organized as follows. In Section 2, we introduce the sample. In Section 3, we describe the data reduction and the
extraction of the line and continuum fluxes. The derivation of the main parameters necessary for the analysis is given in
Section 4. In Section 5, we present the main results obtained by modeling the FIR fine structure
lines. In Section 6, we discuss these results in the
framework of galaxy evolution. A summary of the results and conclusions is given in Section 7.
2 The sample
2.1 Lyman Break Analogs
Lyman Break Analogs (LBAs) are ultra-compact UV luminous galaxies at redshift
0.1-0.3 selected to have
and very high UV
surface brightness
(Heckman et al., 2005).
With UV half-light radii between 0.5 and a few kpc (Overzier et al., 2010),
they are more compact and have higher SFR per unit area than large UV–bright local spirals (Hoopes et al., 2007).
They are more luminous than Blue Compact Dwarfs
in the UV and much more rare. Their SFRs span from to 100 , and their specific SFRs (sSFRs) are
higher than those of large UV–bright galaxies.
Overzier et al. (2009) propose that LBAs could represent a very short, relatively unobscured evolutionary phase of a
starburst.
Several of these galaxies show disturbed morphologies and tails,
indicating signs of interactions, with generally disk like structures featuring compact luminous
clumps. Some LBAs are dominated by very UV–bright, compact ( 102 pc), and massive (
109 M⊙) clumps. These galaxies are called ”Dominant Central Objects” (DCOs)
and exhibit higher sSFR than the rest of the sample
(Overzier et al., 2009). Some DCOs also show clear signs of high-velocity ionized gas outflows ( km s-1 ¡ v ¡ 1500
km s-1)
and a high percentage (up to
40) of escaping Lyman continuum photons thanks to a clumpy neutral medium (Heckman et al., 2011).
LBAs and LBGs share many properties, including their ranges of UV luminosity and surface brightness,
morphology, stellar mass, SFR and metallicity.
LBAs, like LBGs, suffer less attenuation than local galaxies with the same bolometric
luminosities (Overzier et al., 2011): in the IR/UV the stellar mass plane, LBAs
lie
well below the relation followed by local SDSS galaxies.
LBAs also follow three fundamental scaling relations that further show their similarity to LBGs.
First, in the stellar mass – metallicity relation shown in Figure 9 of Hoopes et al. (2007) (see also Lian et al., 2015),
LBAs follow the mass-metallicity relation of 2 UV star-forming galaxies (Erb et al., 2006b).
There is also some overlap between LBAs and local (Ultra) Luminous Infrared Galaxies ((U)LIRGs),
but LBAs have on average lower metallicities (sub-solar) than (U)LIRGs
(1-2 Inami et al., 2013) and lower extinction.
Second, Overzier et al. (2009) show that LBAs have [N II]/H
ratios higher than those of nearby warm IR galaxies with the same [O III]/H ratio
(Baldwin et al., 1981; Veilleux et al., 1987, BPT), but similar to the ratios of a variety of
star-forming galaxy samples (Steidel et al., 2014). This suggests
similar conditions in the ionized gas for LBAs and high– galaxies.
The LBAs that occupy the composite HII-AGN region
of the BPT diagram are also DCOs.
There is no clear evidence that these galaxies host hidden AGN,
except for SDSS092159, which most likely hosts a black hole with a mass (Alexandroff et al., 2012).
This does not exclude the presence of low-luminosity AGN in the other composite
sources, but if AGNs are present, they do not dominate the emission.
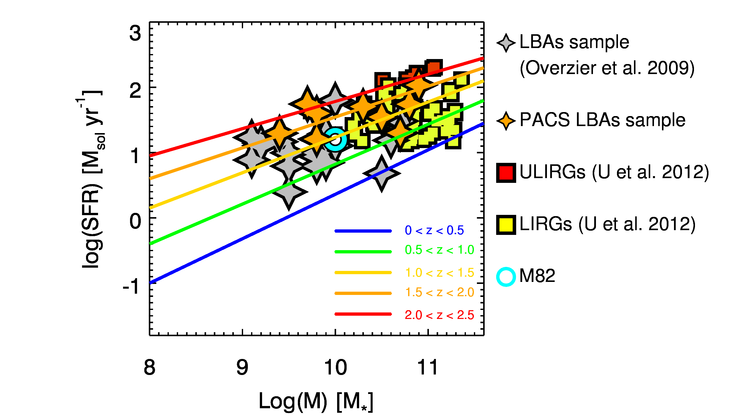
Third, Figure 1 shows the original sample of LBAs from Overzier et al. (2009)
in the SFR- plane.
The subsample of galaxies presented in this work is shown in orange diamonds (see next section for the sample selection
criteria). For comparison, we plot a sample of ULIRGs and LIRGs from U et al. (2012), the position
of the local starburst M82, and the main sequence at different redshifts as published by Whitaker et al. (2012).
LBAs lie above the local SFR-M∗ relation followed by normal star-forming galaxies.
The LBAs we have selected to be observed with PACS are LIRGs, and in fact they overlap in part with the
LIRGs sample of U et al. (2012), but they are on average less massive and have lower metallicities and IR/UV ratios.
2.2 Target selection
We selected nine LBAs from the Overzier et al. (2009) sample based on two criteria:
(1) the redshift must be
such that the [CII] line falls at a wavelength lower than 196
m, beyond which the leakage from the second order makes the flux calibration very
uncertain, and (2) the IR continuum emission must be
bright enough to reach S/N in a reasonable amount of time with PACS
(not more than 3 hours per line per source).
Table LABEL:Table1 lists the selected targets with their
main characteristics from Overzier et al. (2009) and Basu-Zych et al. (2007).
We observed all nine targets in
[CII] and five of the nine in the 63 m [OI] line.
We observed all nine targets with the
PACS photometer in the green (100 m) and red (160 m) broadband filters.
Since LBAs have been extensively studied at many wavelengths in previous works,
many of their properties are already known for all targets. We summarize the most important of these in Table LABEL:Table2.
Figure 1 shows that our sample (orange diamonds), despite being small
and not complete, spans most of the parameter space covered by
the original sample of Overzier et al. (2009), (gray diamonds), although is biased towards
slightly higher SFR and stellar mass.
By complementing the FIR data with IRAM PdBI 12CO(1-0) observations of four targets, presented here for the
first time, and with CARMA 12CO(1-0) data available for two additional galaxies from
Gonçalves et al. (2014), we are able to probe the neutral atomic and molecular gas and dust content of LBAs.
| Name | R.A. | Dec. | z | logM∗ | Z+ | SFR | logL24 | logL70 | ||
|---|---|---|---|---|---|---|---|---|---|---|
| J2000 | J2000 | (M⊙) | (M⊙/ yr) | (L⊙) | (L⊙) | |||||
| H+24m | ||||||||||
| 1 | 005527 | 00:55:27.46 | -00:21:48.71 | 0.16744** | 9.7 | 8.28 | 55.4 | 10.8 | 11.12 | |
| 2 | 015028† | 01:50:28.41 | 13:08:58.40 | 0.14668** | 10.3 | 8.39 | 50.7 | 10.8 | 11.47 | |
| 3 | 021348† | 02:13:48.54 | 12:59:51.46 | 0.21902** | 10.5 | 8.74 | 35.1 | 10.7 | — | |
| 4 | 080844 | 08:08:44.27 | 39:48:52.36 | 0.09123** | 9.8 | 8.74 | 16.1 | 10.3 | 10.53 | |
| 5 | 082001 | 08:20:01.72 | 50:50:39.16 | 0.217 | 9.8 | 8.15 | 40.0 | 10.6 | 11.00 | |
| 6 | 092159 | 09:21:59.39 | 45:09:12.38 | 0.23499** | 10.8 | 8.67 | 55.1 | 10.8 | 11.60 | |
| 7 | 093813 | 09:38:13.50 | 54:28:25.09 | 0.10208** | 9.4 | 8.19 | 19.8 | 10.2 | 10.54 | |
| 8 | 143417† | 14:34:17.16 | 02:07:42.58 | 0.180 | 10.7 | 8.65 | 20.0 | 10.1 | 10.86 | |
| 9 | 210358† | 21:03:58.75 | -07:28:02.45 | 0.13698** | 10.9 | 8.70 | 108.3 | 11.1 | 11.35 | |
| Data are from Overzier et al. (2009) except for updated redshifts when available () from Heckman et al. (2011) | ||||||||||
| + 12+log(O/H) estimated using the O3N2 estimator from Pettini et al. (2004). | ||||||||||
| † CO available | ||||||||||
| Name | DCO1 | Interacting | Ionized gas 3 | High escape | BPT 1 | AGN1 | ||
|---|---|---|---|---|---|---|---|---|
| /merger2 | fraction 3 | classification | signatures | |||||
| 005527 | no | no | -640 | no | HII | no | ||
| 015028 | no | tidal ? | -480 | no | HII | no | ||
| 021348 | yes | – | -1500 | yes | Comp. | no | ||
| 080844 | yes | companion | -1500 | yes | Comp. | no | ||
| 082001 | no | no | – | no | Comp. | no | ||
| 092159 | yes | – | -1500 | no | HII | yes | ||
| 093813 | no | merger | -610 | yes | HII | no | ||
| 143417 | no | interaction | – | no | Comp. | no | ||
| 210358 | yes | no | -1500 | no | Comp. | no | ||
| 1 Overzier et al. (2009) | ||||||||
| 2 Gonçalves et al. (2010) | ||||||||
| 3 Heckman et al. (2011) |
3 Observations and data reduction
3.1 PACS data
We list the details of all PACS observations in Table LABEL:Table3.
All spectrometer observations were executed in chop–nod line (small range) scan mode for [CII] ([OI]).
The [OI] integration times were typically 4 times longer than those of [CII], often approaching one hour.
The spectrometer data have been reduced in HIPE111HIPE is a joint development by the Herschel Science Ground
Segment Consortium, consisting of ESA, the NASA Herschel Science
Center, and the HIFI, PACS and SPIRE consortia. using the telescope background normalization method. This method
does not use the calibration block executed at the beginning of the observations to flux–calibrate the spectrum
but instead uses the telescope background spectrum itself. The advantage is that in this case, each chop on-off calculation
is normalized to the sum of chop on plus chop off, resulting in a signal normalized to the telescope
background emission for every chopping cycle, thereby correcting the responsivity drifts much more efficiently and at much higher
temporal sampling than is done with the calibration block reduction.
This method is particularly recommended for long observations (such as ours), and
it also usually works better in recovering baselines when targets are very faint or,
for point sources, where the continuum flux is expected to be zero.
We have verified that our targets are all point sources at all wavelengths with respect to the PACS beams (FWHM from 9 to 13”)
in agreement with their UV and optical extension of
(Gonçalves et al., 2010).
To extract a point source flux, there are two methods. One consists of extracting
the spectrum from the central spaxel only and applying a point source correction loss
to recover the total flux. This
offers the advantage that the spectrum of the central spaxel has the highest S/N. However, if the observation
is significantly mispointed (), one can sum the signal of the central 3 3 spaxels and
apply a correction from this to the total flux, thus reducing the effect of any possible
mispointing. The disadvantage with this method is that if the signal is faint, as is the case for most of our
targets, summing the central nine spaxels increases the noise.
Given the latter consideration, we have chosen to extract the final source spectra using the central spaxel for all targets
except when the mispointing is evident from the 5x5 spaxel flux distribution.
This is the case for two galaxies, SDSSJ210358 and SDSSJ015028, in which the
[CII] and [OI] lines, which should arise in the same gas, appear spectrally misaligned.
In fact, when a target is mispointed in a direction perpendicular to the slices, spectra are artificially
skewed, and thus their line profiles,
and hence velocity peaks and widths, are altered (see Figure 14.18 of the PACS spectroscopy Calibration Document222
http://herschel.esac.esa.int/twiki/pub/Public/PacsCalibrationWeb/
PacsSpectroscopyPerformanceAndCalibration_v2_4.pdf).
For these two galaxies, we extract the sum of the 3x3 central spaxels to recover the line profiles more correctly.
The nominal flux uncertainties ( 10) reported in the PACS spectrometer calibration
document are strictly valid only for
continuum flux Jy. In the much fainter regime of emission of our targets, uncertainties are
likely to be higher. Taking all these facts together, we estimate our flux uncertainties for the lines
to be 25.
All photometer observations were executed in small scan mode with two scan directions in the green and red filter. We reduced them with the standard pipeline and extract fluxes by using aperture photometry and applying the point source corrections. We have also derived the continuum flux densities from the spectrometer data on either side of the targeted lines and in the corresponding parallel channels. The errors on the continuum fluxes measured from the spectra are in general higher than those at the line centers because the sampling is lower there. Table LABEL:Table4 lists the continuum flux densities derived from the photometer and the spectrometer data.
| Name | Line/band | OBSID | Time on source | |
|---|---|---|---|---|
| (sec) | ||||
| 005527 | [CII] | 1342213130 | 860 | |
| [OI] | 1342213315 | 3920 | ||
| Green+red | 1342222493/4 | 180 | ||
| 015028 | [CII] | 1342213912 | 860 | |
| [OI] | 1342213750 | 3920 | ||
| Green+red | 1342223572/3 | 180 | ||
| 021348 | [CII] | 1342213911 | 3440 | |
| Green+red | 1342223654/5 | 360 | ||
| 080844 | [CII] | 1342220752 | 860 | |
| [OI] | 1342220141 | 2800 | ||
| Green+red | 1342220125/6 | 180 | ||
| 082001 | [CII] | 1342220751 | 3440 | |
| Green+red | 1342220121/2 | 360 | ||
| 092159 | [CII] | 1342221362 | 3440 | |
| Green +red | 1342220657/8 | 180 | ||
| 093813 | [CII] | 1342221632 | 860 | |
| [OI ] | 1342221631 | 2800 | ||
| Green+red | 1342220661/2 | 180 | ||
| 143417 | [CII] | 1342213757 | 3440 | |
| Green+red | 1342223838/9 | 360 | ||
| 210358 | [CII] | 1342208937 | 860 | |
| [OI] | 1342221358 | 3840 | ||
| Green+red | 1342218538/9 | 180 |
| Name | Flux density | ||
| m | mJy | ||
| 005527 | |||
| 73.76s | 152.5 78.7 | ||
| 92.11s | 178.0 145.0 | ||
| 100.00p | 109.9 10.9 | ||
| 147.52s | 77.3 25.9 | ||
| 160.00p | 76.7 18.2 | ||
| 184.17s | 103.7 193.1 | ||
| 015028 | |||
| 72.50s | 494.6 78.8 | ||
| 90.49s | 575.9 146.2 | ||
| 100.00p | 487.4 20.3 | ||
| 145.03s | 339.6 23.0 | ||
| 160.00p | 334.1 14.2 | ||
| 180.87s | 404.7 192.837 | ||
| 021348 | 96.18s | 145.4 83.2 | |
| 100.00p | 302.36 5.5 | ||
| 160.00p | 211.2 16.3 | ||
| 192.28s | 91.2 98.4 | ||
| 080844 | 68.95s | 145.7 70.6 | |
| 86.09s | 270.9 161.7 | ||
| 100.00p | 200.7 135.1 | ||
| 137.95s | 200.5 33.9 | ||
| 160.00p | 146.3 110.2s | ||
| 172.10s | 262.2 143.7 | ||
| 082001 | 96.04s | 64.6 119.1 | |
| 100.00p | 68.7 10.0 | ||
| 160.00p | 67.54 5.0 | ||
| 191.99s | 4.7 116.603 | ||
| 092159 | 97.41s | 61.2 125.8 | |
| 100.00p | 264.59 7.7 | ||
| 160.00p | 214.09 11.5 | ||
| 194.75s | 95.4 101.6 | ||
| 093813 | 69.66s | 102.2 65.3 | |
| 86.95s | 195.9 159.4 | ||
| 100.00p | 130.3 6.8 | ||
| 139.35s | 81.3 14.8 | ||
| 160.00p | 77.0 7.1 | ||
| 173.82s | 115.5 137.2 | ||
| 143417 | 93.14s | 76.3 82.51 | |
| 100.00p | 103.9 8.3 | ||
| 160.00p | 89.0 15.0 | ||
| 186.26s | 47.6 110.809 | ||
| 210358 | 71.87s | 419.9 102.5 | |
| 89.697s | 621.7 152.3 | ||
| 100.00p | 603.8 8.2 | ||
| 143.80s | 567.1 18.3 | ||
| 160.00p | 508.4 26.2 | ||
| 179.32s | 551.2 147.6 |
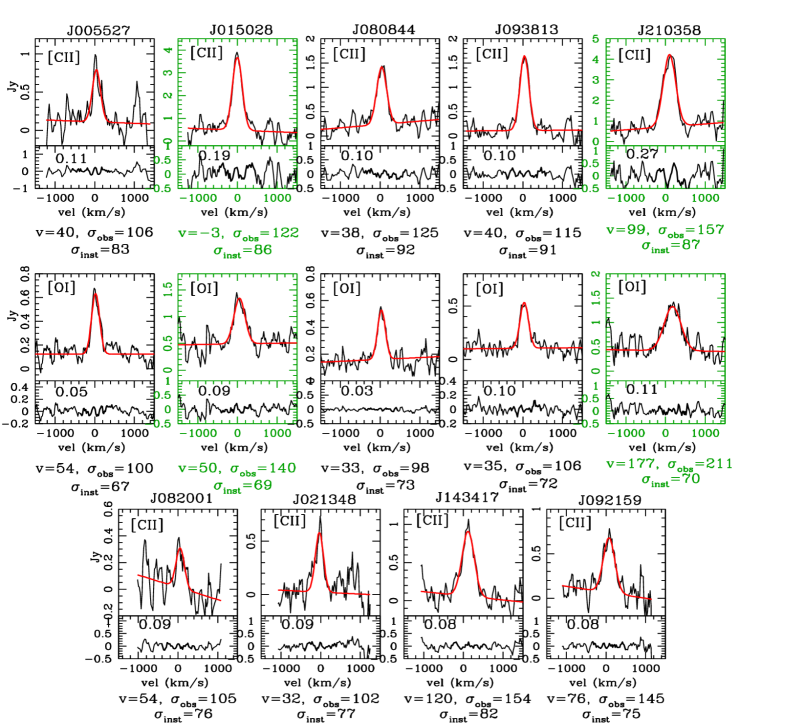
3.1.1 [CII] and [OI] fluxes and line profiles
Figure 2 shows the observed spectra as a function of velocity in ,
relative to the optical systemic velocity listed in column 5 of Table 1.
Both [CII] and [OI] lines were detected in all galaxies except in SDSSJ082001, which shows a marginal detection in [CII]
(it was not observed in [OI]) that we treat as upper limit.
The spectra were extracted as explained in section 3.1.
For each target we show fits to a single Gaussian plus linear baseline model and the corresponding residuals at the bottom
of each spectrum. In each residual panel, we show the standard deviation calculated in the spectral region indicated
with a thicker line. We also report the fitted velocity peak, the observed line dispersion and the instrumental dispersion
at the observed wavelength in .
Taking into account all uncertainties due to the nominal wavelength calibration and
to the line profile changes introduced by mispointing, we estimate that the overall uncertainty in
velocity is 50 in both lines.
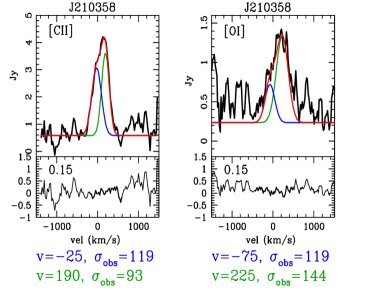
The fitted parameters of the two lines marginally agree for galaxy SDSSJ015028 but differ by more than the uncertainties for galaxy SDSSJ210358. The spectra of the latter galaxy clearly show two components, so we fit both [CII] and [OI] with two Gaussian components plus a linear continuum, and we obtain better agreement between the peak velocities for both components for the two lines. This is shown in Figure 3, where it is also clear that the dispersion of the residuals is much lower than that obtained in the case of one fit component.
For completeness, we have also performed double Gaussian fits for all targets,
to explore the presence of multiple or broad components, but we do not obtain improvement in the fits.
This result, however, does not rule out the existence of broad wings indicating outflowing neutral
atomic gas, given the low S/N.
Table LABEL:Table5 lists the line flux, the S/N, and the instrumental and observed FWHMs derived from the single-Gaussian fits.
We clearly resolve the lines in SDSSJ143417, SDSS092159,
SDSSJ210358 and SDSSJ015028. The other targets show line widths that are consistent with the instrumental spectral
resolution or marginally resolved.
3.2 12CO(1-0) data
We obtained IRAM PdBI (Guilloteau et al., 1992) observations of four LBAs in the array’s compact D configuration between 2005 August and 2007 June. The four targets were selected from the Heckman et al. (2005) sample on the basis of significant detections in 1.2 mm photometry with the Max-Planck Millimeter Bolometer (MAMBO) array on the IRAM 30 m telescope and in at least one IRAS band, on the assumption that dust emission would augur well for a gas detection experiment. Observations of SDSSJ015028 (five tracks with 4-5 antennas in operation) and SDSSJ143417 (three tracks with 5 antennas) were obtained in 2005–06 through program O060; observations of SDSSJ021348 (two track with 4–5 antennas) and SDSSJ210358 (three tracks with 4–6 antennas) were obtained through program Q073. All observations were calibrated with the CLIC package in the GILDAS environment (Guilloteau et al., 2000), using nearby quasars for gain calibration, bright but more distant quasars for passband calibration, and the radio star MWC349 (or a bright quasar bootstrapped to MWC349) for flux calibration. After modest editing, imaging was done in AIPS (van Moorsel et al., 1996) using moderately robust weighting that yielded synthesized beams of 4.9–7.6 arcsecond in diameter. All four sources showed CO(1–0) emission distributions sufficiently compact to allay any concerns about resolved-out flux. Table LABEL:TableCO presents line flux and velocity width measurements derived from integrated spectra of the four galaxies. We also include the data for two additional targets in common with the CARMA sample of Gonçalves et al. (2014). For SDSS015028, observed with both the PdBI and CARMA, we adopt the 50 higher flux from CARMA (which observed the source for longer) but we adopt the width derived from our fit, since Gonçalves et al. (2014) did not published the widths of the lines.
Figure 4 shows the IRAM PdBI CO spectra. The line velocity peaks of [CII] ([OI]) and CO agree well for all galaxies except for SDSSJ143417, where the CO profile peaks at a higher velocity than the [CII] profile. Basu-Zych et al. (2009) describe the kinematics of this galaxy as disturbed, with multiple cores probably arising from a recent merger. It is thus possible that the bulk of the [CII] and CO emission arise from different kinematic components.

4 Analysis
4.1 Comparison of the integrated velocity dispersions of the different gas phases
In this section we compare the velocity dispersion of the atomic, molecular, and ionized gas.
Because we do not have spatially resolved velocity dispersion maps of LBAs,
and hence we cannot separate rotation from dispersion, we will compare the velocity dispersions of the
different gas phases.
We obtain the neutral gas global velocity dispersions by correcting the single Gaussian fitted FWHM
(figure 2 and Table LABEL:Table3)
for the instrumental resolution and converting to velocity dispersion.
In figure 6 we compare these dispersions to those of H (from Table 1 of Overzier et al., 2009) and CO
when available. The dispersions of the neutral and molecular emission lines of LBAs agree
to within the uncertainties, indicating that the neutral atomic and molecular gas phases in the LBAs share the same
kinematics. The H velocity dispersions agree with these, to within the uncertainties,
for most of the galaxies except for SDSSJ005527 and SDSSJ080844,
for which is almost
twice the velocity dispersion of the neutral gas. These are also galaxies with optical tidal emission or companions (see Table LABEL:Table2). It
is thus possible that the neutral gas is more concentrated than the ionized gas and does not experience the turbulence of the gas flowing between
the interacting galaxies.
The LBAs integrated gas velocity dispersions are comparable to those of
LBGs (Erb et al., 2006a) and also to the average [CII] intrinsic velocity dispersion ( 95 )
of a sample of MS galaxies ( ) at 2 (Ibar et al., 2015).
They are significant lower than the [CII] intrinsic velocity dispersion of a sample of ULIRGs at ( 220
) published by Magdis et al. (2014).
4.2 Dust temperatures
To estimate the dust temperatures in our galaxies, we use the method developed by Magnelli et al. (2014) (see their Sect. 3.1). We fit the far-infrared (FIR) photometry (from PACS spectrometer and photometer) of each galaxy with the spectral energy distribution (SED) templates of Dale Helou (2002, DH). From the best fit to the template, we inferred the dust temperature by using the pairing between dust temperature and DH templates established by Magnelli et al. (2014). Compared to methods relying on direct single modified blackbody (MBB) fits, this technique reduces the bias due to differences in the rest-frame FIR photometric data available for each fit. Nevertheless, because the pairing established by Magnelli et al. (2014) corresponds to a fit of each DH template with a single MBB at , our estimates are still in good agreement with other studies in the literature that rely on such single MBB fits. We are thus able to compare our sample with those at high on the SFR- plane, as was done in Magnelli et al. (2014). We list the derived dust temperatures in column 1 of Table LABEL:Table7.
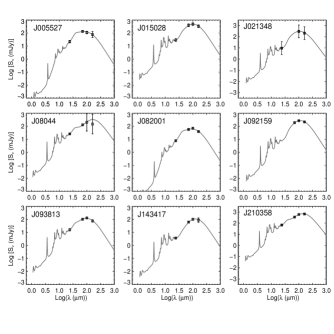
4.3 Dust masses and SFR determination
The IR spectral energy distributions (SEDs) of our sources were fitted
with Draine Li (2007, DL07) models, using the Spitzer photometry at 24 and 70 m and the Herschel photometry at
100 and 160 m (Figure 5). These models describe
interstellar dust as a mixture of carbonaceous and amorphous silicate
grains, whose size distributions are chosen to mimic the observed
extinction law in the Milky Way (MW), Large Magellanic Cloud (LMC), or Small
Magellanic Cloud (SMC) bar region.
In principle, the model includes six free parameters:
-
-
parameterizes the properties of grains and essentially defines the choice of the dust model;
-
-
and are the minimum and maximum stellar radiation field to which grains are exposed;
-
-
is the power of the dust mass dependence on the radiation field;
-
-
is the the fraction of dust mass locked into PDRs;
-
-
is the model mass normalization.
The DL07 parameter space has been limited to the range
suggested by Draine et al. (2007) for galaxies missing sub-mm data, as in our case.
We limit the analysis to MW dust mixtures;
; and .
Finally, we use the Li & Draine (2001) values of .
Berta et al. (2016) present a detailed discussion of the use of DL07 models with
incomplete SEDs and a thorough discussion of the uncertainties and possible
systematics in the determination of.
From each fit to an SED we also calculate (8–1000 m), and from this the SFR following the
prescription in Kennicutt & Evans (2012), but we divided by the factor 1.7 to convert from the Salpeter IMF
to the Chabrier IMF that we assume in this work in order to
be consistent with SFRs estimates for of some high- galaxy samples.
We list in Table LABEL:Table7 and (with 1 uncertainties) and SFR.
The SFRs derived in this work are a factor of 2 smaller than those given by
Overzier et al. (2009) and listed in Table LABEL:Table1, which are calculated from H and the 24 m flux. However,
the SFRs derived from the IR (8-1000 m ) luminosities given in Overzier et al. (2011)
are in much better agreement (within 20) with ours, and the discrepancy
can be ascribed to the different methods used to derive the IR
luminosities.
| Name | [CII] | S/N | [OI] | S/N | [CII] FWHMobs (instr) | [OI] FWHMobs (instr) | ||
|---|---|---|---|---|---|---|---|---|
| 1 | 005527 | 11.6 | 5.3 | 20.4 | 4.0 | 156.3 ( 196.1) | 175.5 ( 159.2) | |
| 2 | 015028* | 62.5 | 21.5 | 47.4 | 7.5 | 206.3 (202.0) | 287.2 ( 162.3) | |
| 3 | 021348 | 9.0 | 22.5 | — | — | 159.7 (180.7) | — | |
| 4 | 080844 | 23.5 | 12.0 | 14.5 | 4.3 | 199.3 (216.8) | 156.2 (17 1.3) | |
| 5 | 082001 | 5.0 | — | — | — | 169.6 (181.2) | — | |
| 6 | 092159 | 14.2 | 14.5 | — | — | 194.2 (175.4) | — | |
| 7 | 093813 | 28.1 | 10.5 | 18.0 | 4.3 | 166.0 (214.0) | 183.0 (169.5) | |
| 8 | 143417 | 20.8 | 5.2 | — | — | 307.4 ( 192.3) | — | |
| 9 | 210358* | 87.4 | 40.5 | 76.0 | 14.0 | 307.7 (159.2) | 402.6 (263.9) |
5 Results
5.1 Why study the neutral atomic gas in galaxies?
Until recently, the ISM of high-redshift galaxies has been principally probed via
their ionized (Glazebrook, 2013, and references therein) and molecular gas
(Tacconi et al., 2013; Carilli Walter, 2013).
In particular, the molecular gas fraction and its depletion timescale are
two fundamental parameters in determining galaxy evolution (Tacconi et al., 2010; Daddi et al., 2010b).
However, the neutral atomic medium is another important component of a galaxy’s ISM, and
the study of its evolution over cosmic time is complementary to that of the ionized and molecular
gas.
The bulk of the atomic medium is traced by the 21 cm HI line emission, which unfortunately
is not yet generally accessible at redshift 0.2.
The [CII] and [OI] lines are the main cooling lines of the cold neutral medium
(CNM; 10 cm-3 and few K), and therefore they
can also be used to trace the neutral atomic phase. With the advent of (sub)mm interferometers, this is now
possible up to very high ( 6-7).
The CNM is mostly concentrated at the interfaces between
HII regions and their parent molecular clouds ( Photo–Dissociated Regions or PDRs).
This means that [CII] and [OI] emission are related to star formation and can be used as SFR tracers.
This connection in particular has attracted much interest in recent years because
the detection of the [CII] line in high-redshift galaxies could potentially be used to derive their SFRs.
However, the two local [CII] – SFR calibration relationships (De Looze et al., 2014; Herrera-Camus et al., 2015) have high intrinsic dispersion ( 0.3 dex), and
the FIR continuum is usually detectable in less time than the [CII] line.
Moreover, there is growing evidence that the [CII]-SFR relationship followed by very high-redshift galaxies
is different from the local relationship. SFGs at usually have less [CII] emission for a given SFR
(i.e., they have a low [CII]/IR ratio) than local SFGs (Pentericci et al., 2016, and references therein).
Therefore, it is not clear whether the [CII]
emission is a better SFR tracer than the FIR continuum.
On the other hand, the study of the content and the dynamical state of the neutral gas
that can be obtained with observations of lines
gives complementary information on the more general state of the ISM in galaxies,
its interplay with the heating sources and its evolution over time.
In recent years, many authors have shown that normal star-forming galaxies (SFGs) from to 3,
lie on the Kennicutt-Schmidt relation (Genzel et al., 2010; Tacconi et al., 2010; Daddi et al., 2010a; Tacconi et al., 2013; Combes et al., 2013),
while only mergers, i.e., local ULIRGs and submillimeter galaxies (SMGs) at , depart from this relation.
However, the ISM conditions in local and high-redshift SFGs differ in several ways, with high-redshift galaxies showing
not only higher pressure and column density but also higher intrinsic
velocity dispersion of the ionized medium
(30-90 ) than local SFGs (5-10 )
(Law et al., 2007; Förster Schreiber et al., 2009; Cresci et al., 2009; Tacconi et al., 2010; Wisnioski et al., 2015). High velocity dispersion suggests
the existence of large amounts of turbulence most likely due to star formation feedback (Newman et al., 2012a).
Moreover, these systems often host very large ( 1 kpc) clumps
that could be as massive as few (Elmegreen et al., 2008; Genzel et al., 2011; Swinbank et al., 2012; Freundlich et al., 2013) and be sites of powerful outflows
(Newman et al., 2012b). The emission from these clumps is compatible with photoionization by star formation and shocks from the
outflowing material. These characteristics could influence the [CII] emission
in high SFGs in a different way than what is
observed in local SFGs.
In what follows, we analyze the [CII] (and [OI]) content of LBAs
in order to establish a reference for planning similar observations of high-redshift galaxies.
So far, the observations of [CII] in high-redshift galaxies, even if steadily increasing in number,
have mostly targeted very luminous galaxies (e.g. QSOs, SMGs ) and only in the last few years
the first attempts to observe this line in normal SFGs at high have started to yield the first clear detections
(Maiolino et al., 2015).
This work aims at characterizing the conditions in the CNM, and how it scales with other
fundamental properties of LBAs
in order to provide nearby analogs for ISM studies of high-redshift star-forming galaxies.
| Name | CO(1-0) | CO FWHM | |
|---|---|---|---|
| 015028∗ | 2.37 | 328.1 | |
| 021348 | 1.83 ( 0.2) | 79.2 | |
| 080844∗ | 1.74 | ||
| 092159∗ | 1.04 | ||
| 143417 | 1.94 (0.52) | 321.3 | |
| 210358 | 10.68 (0.72) | 413.9 | |
| ∗ Flux by Gonçalves et al. (2014) |
5.2 Physical conditions in the neutral atomic gas in LBAs
In PDRs, atomic gas cooling occurs mainly through
by the [CII] and [OI] lines while the heating is due to the
photoelectric effect on dust grains. Thus, the
ratio between the total emission from the FIR fine structure lines and the
total infrared emission from grains
gives the total photoelectric yield. By comparing the observed
ratio with that predicted by a model, one can derive fundamental physical
parameters of the neutral ISM associated with the PDRs.
In the five galaxies observed in both [OI] and [CII], we can rule out shocks as the major emission mechanism,
because the [OI]/[CII]
ratio is much smaller than what is expected for shocks (10; Hollenbach & McKee, 1989), and very similar to what is
expected in normal PDRs. We therefore proceed to model the neutral gas FIR fine structure lines and the continuum as arising in PDRs.
We adopt the model of Kaufman et al. (1999), which considers a one-dimensional semi-infinite
slab illuminated from one side that produces optically thin [CII], IR ( 30 m) and
optically thick [OI], such that only one side of the cloud emits [OI] at 63 m.
The PACS beam encompasses many
clouds, which is equivalent to considering many clouds randomly illuminated. Thus, we reduce the [OI] emission
predicted by the model by a factor of 2. We also integrate the IR flux under the
IR SED produced as described in Section 4.2.
Note that we do not attempt to correct the total [CII] emission for the contribution from ionized gas.
This is usually done by scaling from the [NII] line at 122 m or, even better, from the lower energy [NII]
line at 205 m. Measurements of these lines are not available for LBAs.
Thus, the observed [CII] is an upper limit to the [CII] arising in the neutral atomic medium.

We plot in Figure 7 the density of the neutral medium and the
far-UV (FUV) interstellar radiation field (ISRF)
expressed in G0 units333 G0 is the FUV (6–13.6 eV) ISRF
normalized to the solar neighborhood value expressed in Habing flux:
1.610 obtained for LBAs.
We also show the results obtained by applying the same PDR models to the same set of lines and total IR emission observed in
five other galaxy samples:
(1) a local sample of galaxies assembled from the PACS Guaranteed Time
Program SHINING (P.I, E. Sturm), published in part by Graciá Carpio et al. (2011), and in Herrera–Camus et al. in prep, which includes HII galaxies, Seyfert 1 and 2 galaxies, LINERs, LIRGs, ULIRGs and QSOs;
(2) the central regions of local star-forming, starburst, and (a few) AGN dominated galaxies observed with ISO-LWS published by
Malhotra et al. (2001) and Negishi et al. (2001);
(3) a sample of local low-metallicity dwarf irregulars observed with PACS presented in Cormier et al. (2015).
(4) some resolved regions in the disk and the
outflow of M82 (Contursi et al., 2013), and
(5) a sample of star-forming galaxies at observed with the ZEUS instrument at CSO and with ,
published by Brisbin et al. (2015). The latter have higher stellar masses and SFRs
than our targets, but they constitute the only available high-redshift sample of SFGs observed in [CII], [OI], and FIR continuum
for which it is possible to apply the same PDR modeling we have used for the LBAs.
We stress that, for the comparison samples, we do not use the published and values,
but we model the TIR continuum and the FIR fine structure line emission again,
in the same way and by applying the same correction factors as for the LBA sample.
This ensures a safe comparison amongst the different samples.
We find 10 and in LBAs,
placing them on the high density-high part of the correlation, and
comparable to the physical conditions in starbursts. This
is consistent with the starburst nature of most of
the original LBA sample as shown by Overzier et al. (2008, 2009).
On the other hand, the range of / ratios obtained for the LBAs, most of the dwarfs and the ZEUS
galaxies is lower than the main relationship followed by the other galaxies.
This could be due to a lower and/or a
higher .
Applying a 0.8 correction factor to the PDR [CII] fluxes
to account for contributions from ionized gas (e.g., Malhotra et al., 2001) has negligible effect on the
resulting and
parameters.
Brisbin et al. (2015) attribute this difference to a moderately low
value due to the large, several kpc extent of star formation in their sample.
This could also explain the low values of LBAs, since
their UV extent is 5 ( 5 kpc; Gonçalves et al., 2010) (see also additional
evidence discussed in Section 6.2).
On the other hand, we cannot rule out higher gas density as a contributing factor to the
low / values in LBAs and high- galaxies in comparison to local galaxies.
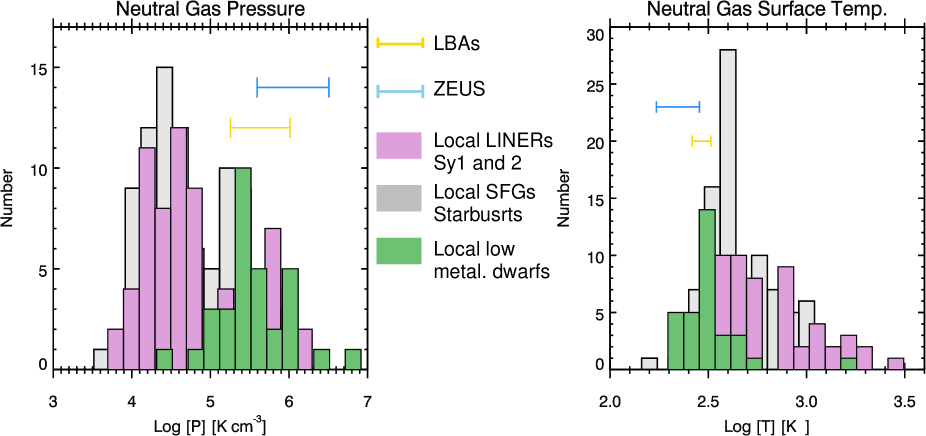
Figure 8 shows the histogram of thermal pressures and gas surface temperatures obtained from our
modeling.
We separate the local SFGs and starbursts (shown in grey) from the local LINERs, Seyfert 1 and 2 galaxies
present in the SHINING, Malhotra et al. and Negishi et al. samples (pink), and the low metallicity dwarf sample (green).
For the LBA and ZEUS samples, we indicate the ranges covered by these parameters,
since the number of galaxies in each sample is small.
LBAs and the high- galaxies of Brisbin et al. (2015) have pressures and temperatures
that are respectively on the high and low sides of the histogram ranges.
The distribution of the pressures of local SFGs and starbursts shows a bimodality, not present in the temperature distribution,
with the high-pressure second peak dominated by starbursts.
This second peak overlaps with the values found in dwarfs and corresponds to the range spanned by LBAs and high- SFGs.
The thermal pressures of the cold neutral medium derived for LBAs are within the range
of thermal pressures derived by Overzier et al. (2009) from the ionized gas for the whole LBA sample.
These pressures are much higher than the mean thermal pressure of the CNM in our galaxy ( K cm-3),
and of atomic dominated regions in nearby galaxies (Jankins & Tipps, 2011; Herrera-Camus et al., 2017), and higher than
those derived in the nuclei of the Antennae from X-ray observations (Fabbiano et al., 2003).
By assuming that thermal pressure is about 10 of the total hydrostatic pressure (Cox, 2005), we derive a total pressure of about
5 K cm-3 that is in the range of the total hydrostatic pressure at mid plane
measured in high- main sequence
galaxies (0.3-10 K cm-3, Swinbank et al., 2011; Genzel et al., 2010).
We conclude that the physical conditions of the neutral atomic gas in LBAs are quite extreme with
respect to the mean properties of the local sample of star-forming galaxies, exhibiting lower atomic gas temperatures,
higher pressure, and likely higher densities,
as found in low-metallicity dwarfs and starbursts. These same conditions are also seen in the
small sample of high- star forming galaxies observed to date.
We note that hosting a DCO does not necessarily imply the most extreme ISM conditions.
In fact, the only galaxy hosting a DCO observed in both [CII] and
[OI], for which PDR modeling is possible (SDSSJ08044), has among the lowest values of , and nH, and the
highest /nH ratio and . DCOs are very similar to the massive clumps detected in high- star
forming galaxies (Newman et al., 2012b) and therefore one would expect that their presence would be related to more extreme ISM
conditions. Unfortunately, with our limited number of objects, it is difficult to draw
conclusions about a potential connection between the conditions of the ISM and the presence of a DCO,
by analogy with the clumps observed in high- SFG disks.
| Name | LFIR | LTIR | Mdust | SFR | ||
|---|---|---|---|---|---|---|
| K | L⊙ | L⊙ | 108 | M⊙ yr-1 | ||
| 005527* | 49.5 (2.2) | 1.10 (0.26)e+11 | 2.17 (0.10)e+11 | 0.23 (0.09) | 21.99 | |
| 015028 | 35.9 (1.0) | 2.75 (0.31)e+11 | 4.02 (0.13)e+11 | 1.10 (0.12) | 40.799 | |
| 021348 | 30.2 (1.0) | 3.98 (0.61)e+11 | 5.10 (0.10)e+11 | 1.45 (0.16) | 51.74 | |
| 080844 | 49.4 (1.9) | 3.71 (0.75)e+10 | 8.62 (0.73)e+10 | 4.03 (1.00) | 8.75 | |
| 082001 | 44.3 (1.0) | 8.95 (1.00)e+10 | 1.60 (0.34)e+11 | 0.21 (0.01) | 16.23 | |
| 092159 | 35.9 (1.2) | 3.95 (0.69)e+11 | 5.07 (0.71)e+11 | 1.80 (0.41) | 51.44 | |
| 093813 | 39.6 (2.8) | 3.40 (1.30)e+10 | 6.08 (0.25)e+10 | 0.14 (0.32) | 6.17 | |
| 143417 | 29.3 (1.0) | 7.70 (1.40)e+10 | 1.08 (0.49)e+11 | 0.79 (0.27) | 11.01 | |
| 210358 | 33.4 (1.0) | 2.54 (0.40)e+11 | 5.11 (0.12)e+11 | 7.2 (1.10) | 51.90 |
5.3 The correlation of [CII] with other ISM tracers
In this Section we present and discuss correlations between the [CII] emission,
the infrared dust emission, and the molecular gas emission of LBAs and compare them
to those found in other galaxy samples at low and high redshifts.
We first present the diagnostic plot that relates the [CII]/FIR ratio with the FIR luminosity
(upper left panel of Figure 9).
We include in this figure the values for the LBA sample, the SHINING sample, a sample of low-redshift QSOs published by
Zhao et al. (2016),
a sample of intermediate- () ULIRGs published by Magdis et al. (2014), and a sample of
high- sources collected by Carilli Walter (2013) with recent updates (see figure caption for details).
The high- sample includes relatively recent high and very high-redshift [CII] detections, which have become
more numerous thanks to new very sensitive interferometers. However, these objects are still biased towards
very luminous () galaxies (typically QSOs and SMGs) even when the targets are lensed systems.
Nevertheless, these recent observations of high- systems shed new light on the [CII]-FIR relation,
vastly expanding its characterization in comparison with what was known
only a decade ago when the diagram was limited to very nearby () systems. Figure 9
shows that the [CII]/FIR ratio of local systems decreases with FIR luminosity (Malhotra et al., 2001; Luhman et al., 2003),
with a knee at beyond which the decline becomes even steeper. Extrapolating this
behavior,
we might expect galaxies with to have low [CII]/FIR ratios.
Observations of high- very IR-luminous galaxies show that this is not the case: many high- very FIR-bright sources show [CII]/FIR ratios
comparable to those of local, less luminous galaxies. This was first shown by
(Maiolino et al., 2009; Hailey-Dunsheath et al., 2010; Stacey et al., 2010)
and confirmed later by many other authors
(Maiolino et al., 2012; Wagg et al., 2012; Gallerani et al., 2012; Venemans et al., 2012, and reference therein).
The high- galaxies tend to lie in a sequence parallel to that
observed at low redshift, shifted to higher FIR luminosities. In this sequence, the objects with confirmed AGNs tend to have
lower [CII]/FIR ratios than those without AGN contributions (Hailey-Dunsheath et al., 2010).
Thus, at high there are galaxies with luminosities as high as or higher than those of local ultraluminous galaxies, but with ”normal” [CII]/FIR ratios.
LBAs follow a correlation similar to that of the low-luminosity systems, exhibiting a range in [CII]/FIR
ratio decreasing with that however never reaches the range of [CII]-deficient galaxies.
LBAs are not [CII]-deficient, and
it is likely that star forming galaxies also have normal [CII]/FIR ratios, enhancing the likelihood that we can study their [CII] properties
with ALMA (see Section 6.4).
The upper right panel of Figure 9 shows the [CII]/FIR ratio as a function of CO/FIR ratio and the
and grids
of the Kaufman et al. model. With the exception of SDSSJ015028, which has a particularity low CO/FIR ratio,
LBAs overlap the local SFGs but lie in ranges of and higher than what we obtain by modeling
the [CII] and [OI] lines.
This is likely due to the fact that we are using a different pair of lines and that the Kaufman et al. model requires
as input the total IR luminosity and not the FIR luminosity used in this diagnostic.
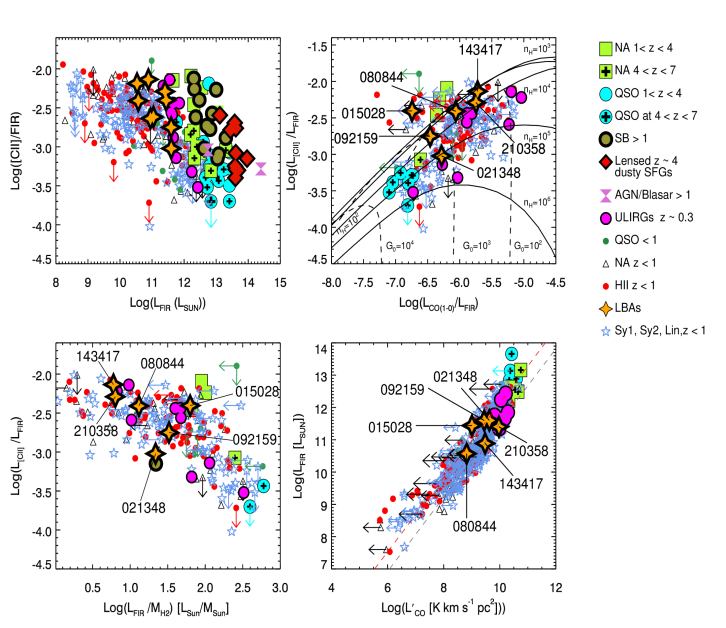
In the lower left panel of Figure 9, we show the [CII]/FIR ratio as a function of the ratio
for galaxies with [CII] and CO(1-0) data (the latter used to estimating H2 masses) available.
This diagram was first shown by Graciá Carpio et al. (2011).
The values of for LBAs have been obtained using a Milky Way conversion factor
to derive from the CO luminosity
( ( K (km s-1 pc). If we use a ULIRG conversion factor,
( ( K (km s-1 pc, ) Downes Solomon, 1998), the derived H2 masses would be smaller and
the ratio larger, such that
for some galaxies it would exceed the threshold of the high-efficiency SF mode. However, as we discuss in Section
6.1, our analysis
favors the Milky Way conversion factor for LBAs.
We note that of the four LBAs with DCOs,
only SDSS021348 falls below the tight correlation, although this is not the case if a ULIRG CO-H2 conversion
factor is used.
The dichotomy between very luminous and less luminous systems shown before
is less evident when the [CII]/FIR ratio is plotted as a function of .
In galaxies in which is predominantly powered by star formation,
the ratio is, to first approximation,
the ratio between the energy released by the star formation and the gas reservoir
from which the stars form, and therefore is a parameter directly related to the
star formation efficiency (González-Alfonso et al., 2008, 2015; Graciá Carpio et al., 2011).
On this diagram, low and high-redshift galaxies follow the same correlation.
This suggests that the physical mechanism responsible for the different
[CII] emission regimes is the same locally and in the distant Universe.
Graciá Carpio et al. (2011) find that the far-infrared fine-structure line deficit
(relative to the FIR) increases as the star formation efficiency (LFIR/M) rises. They
attribute this to higher ionization parameters, resulting in the absorption of a higher fraction
of the available UV photons by dust, leaving fewer photons to ionize and heat the gas
(Luhman et al., 2003; Abel et al., 2009; Fischer et al., 2014; Goicoechea et al., 2015).
Graciá Carpio et al. (2011) and Díaz-Santos et al. (2013) show that
galaxies with a [CII]/FIR deficit lie above the MS. Thus, LBAs, that are above the local MS in
Figure 1, nevertheless have a [CII]/FIR ratio typical of MS galaxies.
We discuss this point further in Section 6.2.
The lower left panel of Figure 9 shows that the LBAs for which we have CO data occupy the relatively high-[CII]/FIR
region of the diagram with ratio lower than the threshold found by
Graciá Carpio et al. (2011), .
This is not what one might have expected in regions of high sSFR, such the clumps in DCOs.
The last relationship that we analyze is between and FIR luminosity
(lower right panel of Figure 9), in which we
also show, plotted with red and gray dashed lines, the scaling relations for mergers and the star-forming galaxies that Genzel et al. (2010)
obtain by fitting data for local and high redshift () galaxies.
Most of the six LBAs for which we have CO data are consistent with typical MS SFEs.
The only exceptions are SDSSJ015028 and SDSSJ021348 (a DCO), which lie on the merger sequence:
for a given amount of molecular gas, they have FIR emission and hence SFR
much higher than that of a star-forming galaxy.
SDSSJ14347 and SDSSJ015028 are probably interacting systems based on a kinematic integral field spectroscopic study
of their ionized gas by Gonçalves et al. (2010), but only the latter shows
the ”high”efficiency mode of star formation typical of
merging systems. Note that the PACS beam is large enough to include both interacting components. On the contrary, SDSSJ021348,
which contains a DCO, is on the merger
sequence even though no clear signs of merging or interactions have been detected in the ionized gas or the UV light distribution.
We conclude that most LBAs exhibit an efficiency in turning gas into stars similar to that of MS galaxies, despite the fact
that they are starbusts and lie above the local MS.
Finally, we have investigated if the [CII]/FIR and LIR/CO ratios depend on galaxy morphology, i.e., whether galaxies are
isolated or in some stage of interaction/merging (see Table LABEL:Table1).
There is a tendency for the three isolated galaxies to have
lower ratios than the others, although the small sample size prevents
us from making a strong statement.
5.4 [CII] and [OI] as SFR tracers
In this section we explore the locations of LBAs in the SFR – [CII] and [OI] planes and we compare them to observed relationships
at low and high redshifts.
The two most recent works on the local SFR-[CII] ([OI]) relationship are those of De Looze et al. (2014) and Herrera-Camus et al. (2015).
De Looze and co-authors explore these relations for a wide sample of local galaxies spanning several magnitudes
in metallicity, and for a large variety of galaxy types, including dwarfs, low-metallicity galaxies, HII/starbursts, composite and
AGNs, ULIRGs as well ad some high–z very IR luminous sources.
They use SFRs derived from the FUV plus –MIPS at 24 m for the dwarf galaxy sample and
SFRs derived from LIR
for the other galaxy populations, all assuming a Kroupa IMF (Kroupa et al., 2003).
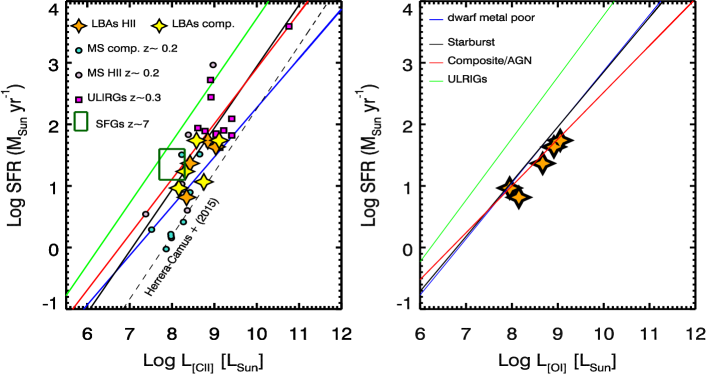
Figure 10 shows these relationships for the [CII] and the [OI] lines.
On the left panel, the locations of the LBAs are plotted together with those of two galaxy samples
at comparable redshift:
a sample of MS galaxies ( ) at redshift from Ibar et al. (2015)444From
the original sample of Ibar et al. (2015), we have excluded the galaxies classified as Elliptical and Elliptical Irregular., and the
0.3 ULIRG sample of Magdis et al. (2014).
We plot with different colors galaxies classified as composite/AGN and HII on the BPT diagram.
In order to be consistent with the derivation of the De Looze et al. relationships, we have calculated
the SFRs of all galaxies from using a Kroupa IMF, following the prescription from Table 3 of Kennicutt & Evans (2012).
Figure 10 shows that LBAs are well below the relationship followed by ULIRGs (green lines), which in general have a
significant [CII]-deficit. But it also shows that there is a high spread in the values of all samples,
and that galaxy locations are not always consistent with their BPT classifications.
Most LBAs are above the relationship followed by local dwarfs. The
two LBAs with lower SFRs closer to the dwarf relationship, SDSSJ093813 and SDSSJ080844,
have the lowest and the highest metallicity of the sample, respectively (Table LABEL:Table1).
Herrera-Camus et al. (2015) explore the SFR–[CII] relation for the KINGFISH
sample of local star-forming galaxies, both within each galaxy and globally.
They emphasize that it is better to use the
relation between the surface brightnesses of SFR and [CII] rather than the luminosities.
Since LBAs are point sources for the PACS beams we cannot use this approach.
Instead, we use their equation 3 relating SFR and [CII] luminosities. This relation
is shown as a dashed black line on Figure 10 after correction of
SFR values from the Salpeter to the Kroupa IMF.
This relation is lower by a factor of 4 in SFR with respect to
that derived by De Looze et al. for HII/starburst galaxies.
This is probably due to a higher percentage of starburst systems in the HII/starburst sample of
De Looze et al. relative
to the more normal star-forming galaxies in the KINGFISH sample
(see figure 10 in Herrera-Camus et al., 2015).
The relation falls too low to match most LBAs and most memebrs of the other two galaxy samples.
The green box in figure 10 represents the location of MS star-forming galaxies with stellar masses
between at from
Pentericci et al. (2016). They show that for a given SFR, the [CII] emission is lower than
what is predicted by the local SFG relationship. This is not the case for LBAs, which although with high dispersion,
are closer to the local starburst relationship.
We conclude that in LBAs and in SFGs at 1-2, [CII] can be used as a rough SFR estimator. However,
the fact that FIR continuum emission is detectable in less time than the FIR fine structure lines makes
the use of [CII] as a SFR tracer less attractive.
5.5 Summary of main results
In this section we have presented the following results. (1) LBAs do not show a [CII] line deficit relative to or (2) The physical conditions in their neutral atomic gas are different from those of local SFGs, and more similar to those found in local starbursts, low metallicity dwarfs, and high- galaxies in terms of thermal pressure, temperature, and / ratio. There is some evidence that this difference is independent of the presence of a DCO. (3) LBAs do not overlap with starbursts in the density-FUV ISRF diagram, but rather with local low-metallicity dwarfs and with 2 SFGs observed with ZEUS at CSO. (4) Most LBAs have SFEs similar to those of MS galaxies, despite their high sSFRs. (5) LBAs roughly follow the local HII/Starburst SFR-[CII] relationships. This means that the [CII] emission in LBAs and in similar galaxies at high redshift can be used to estimate their SFRs, although with uncertainties of order of a factor of 2-3.
6 Discussion: the neutral ISM properties of LBAs in the context of galaxy evolution
6.1 Total molecular gas fraction
In recent years, many authors have shown that the molecular gas fraction of star forming galaxies in a given stellar mass range,
defined as the ratio of the total H2 mass
to the sum of the stellar plus molecular gas mass,
increases from 0.08 to0.47 as the redshift increases (Tacconi et al., 2013), with a possible
flattening at higher redshifts (Saintonge et al., 2013; Magdis et al., 2012a), although
the flattening is not yet confirmed Béthermin et al. (2014).
The question we address in this section is whether our targets have a high gas fraction, strengthening also in this respect their
analogy with SFGs at .
Using different methods, we have calculated the total molecular gas fraction for LBAs for which we have CO(1-0)
data. We estimate the H2 mass with three different
CO-H2 conversion factors: one used for ULIRGs ( = 0.8 (
km s-1)-1), one for the Milky Way ( = 4.3 (
km s-1)-1), and one depending on gas metallicity as given by
Genzel et al. (2012): log() = -1.27 + 1.18. We also calculate the H2
masses from the dust masses listed in Table LABEL:Table7, by using a dust to gas mass ratio formula verying with metallicity
given by Genzel et al. (2015).555In order to be consistent with the dust to gas mass ratio we use,
the metallicity should be derived from the method given in Pettini et al. (2004), which is the case for the
metallicities we
use for the LBAs as given in Overzier et al. (2009).
This formula calculates the dust to molecular gas ratio by assuming that in the galaxies
the molecular gas dominates the atomic phase. The column density values for the atomic
to molecular gas transition is 14 pc-2 (Bigiel Blitz, 2012).
We can derive the average for three LBAs (SDSS0150283, SDSS093813, and SDSS2103583)
for which we have PDR model results and FIR sizes from Lutz et al. (2016). We calculate the mass of the atomic hydrogen
associated with the [CII] and [OI] emission by applying :
| (1) |
(see Janssen et al., 2016, for details), where we have linearily scaled the abundance by the ratio between the
solar metallicty assumed by Pettini et al. (2004) (=8.66) and the metallicity listed in Table LABEL:Table1.
We obtain equal to 113, 15 and 159 M⊙
pc-2 respectively, close or above the transition threshold. Hence, we can safely assume that the dominant gas phase in LBAs
is molecular and derive gas masses from dust masses.
We find an average gas fraction similar to that of local SFGs only when using
the ULIRG conversion factor. In all the other cases, the derived gas fraction are )
depending on the adopted conversion, i.e. ,close to the typical gas
fraction found in high redshift galaxies (Tacconi et al., 2013). Gonçalves et al. (2014) have presented CO(1-0) data for another sample of LBAs with which we have
four galaxies in common, and they reach similar conclusions.
6.2 LBAs and the main sequence
As already mentioned in Section 2.1 and shown in Figure 1, LBAs lie above
the main sequence at .
In this section we address the following question: do LBAs have the typical ISM properties of local galaxies
above the main sequence, or do they behave as typical high-redshift main sequence galaxies?
In order to answer this question, we analyze quantities tracing different
LBA ISM properties as a function of distance from the main sequence at , 1, and 2 and we compare the
LBAs to other galaxy samples at low and high redshifts.
To be consistent with our derivation of SFRs and dust temperatures, we show the distances calculated with respect to the MS defined in Magnelli et al. (2014) and listed in column 3 of Table LABEL:Table8. Table LABEL:Table8 also lists the distances from other MS definitions, namely those derived in Speagle et al. (2014) Whitaker et al. (2012), and Magdis et al. (2012b) for redshifts 0, 1, and 2. This table shows that the smallest distances are obtained when the Magnelli MS is adopted (points in figures 11 and 12), strengthening our conclusion.
| Name | Magnelli+14 | Magdis+12 | Speagle+14 | Whitaker+12 | ||
|---|---|---|---|---|---|---|
| 005527 | 0 | 20.03 | 49.86 | 41.33 | 33.28 | |
| 1 | 3.88 | 7.66 | 3.42 | 2.94 | ||
| 2 | 1.40 | 2.15 | 1.51 | 0.62 | ||
| 015028 | 0 | 12.14 | 23.23 | 38.70 | 23.47 | |
| 1 | 2.63 | 3.57 | 2.44 | 2.48 | ||
| 2 | 1.13 | 1.00 | 0.99 | 0.63 | ||
| 021348 | 0 | 10.89 | 18.59 | 39.07 | 21.56 | |
| 1 | 2.56 | 2.86 | 2.25 | 2.42 | ||
| 2 | 1.11 | 0.80 | 0.88 | 0.65 | ||
| 080844 | 0 | 6.56 | 15.76 | 14.67 | 11.27 | |
| 1 | 1.27 | 2.42 | 1.16 | 1.02 | ||
| 2 | 0.48 | 0.68 | 0.51 | 0.22 | ||
| 082001 | 0 | 12.17 | 29.24 | 27.22 | 20.91 | |
| 1 | 2.37 | 4.49 | 2.15 | 1.90 | ||
| 2 | 0.89 | 1.26 | 0.94 | 0.41 | ||
| 092159 | 0 | 6.61 | 9.26 | 27.60 | 13.22 | |
| 1 | 1.85 | 1.42 | 1.38 | 1.62 | ||
| 2 | 0.76 | 0.40 | 0.52 | 0.48 | ||
| 093813 | 0 | 10.30 | 27.93 | 27.93 | 15.15 | |
| 1 | 2.05 | 4.29 | 4.29 | 1.22 | ||
| 2 | 0.61 | 1.20 | 1.20 | 0.23 | ||
| 143417 | 0 | 1.66 | 2.50 | 6.62 | 3.32 | |
| 1 | 0.43 | 0.38 | 0.35 | 0.39 | ||
| 2 | 0.18 | 0.11 | 0.13 | 0.11 | ||
| 210358 | 0 | 5.69 | 7.42 | 24.85 | 11.35 | |
| 1 | 1.70 | 1.14 | 1.19 | 1.43 | ||
| 2 | 0.68 | 0.32 | 0.44 | 0.43 |
The first parameter we consider is dust temperature. Magnelli et al. (2014) have shown
that dust temperature increases with distance above the MS and as a function of
redshift for a sample of galaxies with a wide range of stellar masses and SFRs from GOODS-N, GOODS-S and COSMOS from redshift 0
to .
Figure 11 shows the dust temperatures of LBAs, derived in the same way as for the galaxies in
Magnelli et al. (2014, see Section 4.2), as a function of the LBAs distances from the main sequences at , 1, and
2. The figure also shows the region
occupied by the Magnelli et al. sample at all redshifts (blue solid box) and that occupied
by a sample of low-metallicity lensed star forming galaxies at from
Saintonge et al. (2013, red dashed box). LBAs could represent relatively low-mass galaxies above the local main sequence with
high dust temperatures but still be in rough agreement with the galaxies above
the main sequence at in the Magnelli sample. If the main sequences at and 2 are considered, LBAs have even
higher temperatures than the Magnelli sample, but have very similar temperatures to those found for the lensed star-forming galaxies at from
Saintonge et al. (2013).
Although we cannot discriminate between these two scenarios, we note that the
metallicity range of LBAs is very similar to that of the high- lensed star forming galaxies.
Moreover, with the exception
of the very high dust temperature and metallicity galaxy SDSSJ080844 (Table LABEL:Table7),
dust temperature of the LBAs roughly anti-correlates with metallicity for LBAs, in agreement with the results of Saintonge et al.
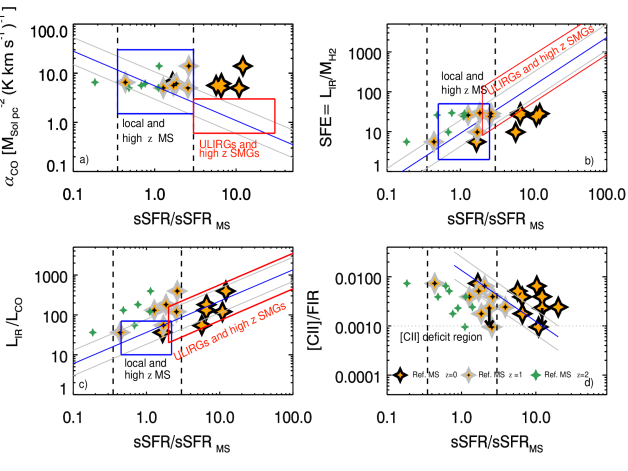
Figure 12 shows other parameters related to the ISM as a function of
distance from the main sequence, for comparison with the similar diagrams in Magdis et al. (2012b, panels , , and ),
and
Díaz-Santos et al. (2013, panel ).
Panel shows
CO calculated as a function of metallicity following the relation given in the previous
section from Genzel et al. (2012); panel shows SFE (= ); panel shows the
ratio;
and panel shows the [CII]/ ratio.
In the first three panels, we plot: (1) the values for the LBAs calculated with respect to the main sequence at ,
1, and 2; (2) the regions occupied by the local and high-redshift MS galaxies (blue box)
and the local ULIRGs and high-redshift SMGs (red box)
from Magdis et al. (2012b);
(3) the best-fit and the values
obtained from Magdis et al. for their full sample.
When we consider the LBA values with respect to the main
sequence at , only the ratio follows the fit (panel ).
In particular, all the LBA values have ratios similar to those observed in ULIRGs and SMGs.
However, as shown in figure 9,
at least two of the LBAs lie on the relationship followed by the main sequence
galaxies, and this is not reflected in panel of figure 12.
When we consider the values calculated with respect to the
main sequence at these two galaxies are within one of the Magdis relation, in agreement with
the findings of figure 9.
In panels and , the values of LBAs calculated with respect to the
local main sequence are outside the regions for both MS galaxies and ULIRGs/SMGs,
while they agree with those
derived taking the main sequence galaxies at high redshift as a reference.
Panel of figure 12 shows the [CII]/FIR ratio
as a function of distance from the main sequence, analogous to Figure 7 of Díaz-Santos et al. (2013).
These authors analyze a sample of local LIRGs from the Great Observatories All-sky LIRG Survey (GOALS) sample
and show that there exists a relation between the position of the galaxies with respect to the main sequence
and their [CII]/FIR ratio.
Galaxies with sSFR greater than 3 times the sSFR of the local MS (vertical solid line in the figure)
are starburst systems with high efficiency star formation and a
progressively low [CII]/FIR ratio. Galaxies are considered to be [CII]-deficient when their [CII]/FIR ratio
is less than (horizontal dotted line).
Panel of Figure 12 also shows the fit obtained considering only the GOALS galaxies without known AGNs
(solid blue diagonal line) and its
1 uncertainties (gray solid lines).
The [CII]/FIR values of the LBAs relative to the local MS are higher than those of the GOALS galaxies
at similar distances from the main sequence; alternatively for a given [CII]/FIR ratios, LBAs seem
to lie farther above the MS than the GOALS sample.
In this scenario LBAs seem to be extreme starburst galaxies with anomalously high [CII]/FIR ratio
when compared to galaxies in the GOALS sample. We note that LBAs are also LIRGs, and therefore they match the
GOALS sample in terms of infrared emission. In this scenario, LBAs would also have very
low SFE ( , panel ) for their starbursting nature.
On the other hand, when the main sequence at is considered, LBAs follow the fitted
relation much better.
Díaz-Santos et al. (2013) show that [CII]/FIR ratio decreases with the compactness of the starburst traced by
the FIR surface brightness (Area). We have measured IR sizes as half light radii at 70 m, for only four
of our targets (Lutz et al., 2016). Díaz-Santos et al. (2013) calculate sizes using the half light radius in the
MIR (). However, the bulk of the heating
sources responsible for the emission at 70 m and in the MIR should be sufficiently similar to allow a fair comparison.
We find that the four LBAs for which we have reliable FIR sizes lie on the relation
presented by these authors (their Figure 5) with low FIR surface brightness ( ¡
kpc-2), indicating that LBAs likely have extended star formation, as already suggested by the analysis of the values in Section 5.2,
and in agreement with their high [CII]/FIR ratio.
We conclude that LBAs represent a very peculiar local population with ISM properties
very different from those of local galaxies in the same region of the -SFR plane and with the
same infrared emission.
Indeed, the ISM properties of LBAs seem to be more similar to those of
main sequence galaxies. This result is consistent with the finding of Section 5.2, where we have shown
that in LBAs, the physical parameters of the CNM are similar to those found in
high-redshift galaxies rather than in local SFGs.
6.3 [CII] ALMA observations of main sequence galaxies at
We have shown that the ISM properties of LBAs are very similar to those of main sequence galaxies at
higher redshifts. In light of this analogy we can use the observed [CII] fluxes of LBAs to
predict how much time is necessary to observe [CII] in main sequence galaxies at = 2 with ALMA.
The expected [CII] peak flux of an LBA redshifted to ranges
from 10 to 50 mJy.
This refers to the emission of the entire galaxy because LBAs are unresolved by PACS.
We assume an intrinsic galaxy extent of 6, the typical
H size of main sequence galaxies.
The time required just to [CII] with ALMA with S/N 10
and a velocity bin equal to 50 km s-1 is 2 with 43 12–m antennae.
Assuming the flux surface brightness decreases exponentially and matching the 70 km s-1
typical velocity resolution of H observations,
the time required to a main sequence galaxy is
12 -18 h depending whether 50 or the current 43 offered antennae are considered.
We conclude that in its final state of development, ALMA will be able
to detect a large number of relatively low-mass main sequence galaxies at and to map a small subsample.
7 Summary and conclusions
We have presented an analysis of the neutral interstellar medium of a sample of
Lyman Break Analogs (LBAs) at 0.2 observed in [CII], [OI], and FIR continuum
with the /PACS instrument and in the 12CO(1-0) line with the IRAM PdBI.
By definition, LBAs share many fundamental properties with Lyman Break Galaxies at high redshift.
All our targets are in the LIRG regime, but they have UV/FIR ratios much higher than
LIRGs.
The main goal of this paper was to investigate whether the ISM physical conditions in LBAs
resemble those of their high-redshift analogs and thus to offer a unique reference sample for
planning future submillimeter observations of high-redshifts star-forming galaxies.
The main conclusions of this analysis are the following:
-
-
We have detected all galaxies in line and FIR continuum emission. The atomic, molecular, and ionized gas share the same global kinematics as traced by the integrated line velocity dispersions. We have not detected outflows in the FIR fine structure lines, even in targets where high-velocity ionized gas outflows have been observed (Overzier et al., 2009; Heckman et al., 2011), possibly because the S/N of the FIR lines is too low to detect relatively faint line wings.
-
-
By modeling the FIR [CII] and [OI] lines and TIR dust continuum as arising in PDRs, we show that the physical conditions of the neutral atomic gas in LBAs are quite extreme with respect to the mean properties of local spiral galaxies: LBAs have lower gas temperatures and higher densities and pressures, similar to the conditions in high-redshifts star-forming galaxies. The ratios of LBAs are lower than in local starbursts, analogous to what has been found in some high-redshift galaxies by Brisbin et al. (2015), and consistent with the interpretation that star formation in these galaxies is spread over several kpc and/or the gas density is higher than that in local SFGs. This interpretation is also supported by the low values (that trace starburst compactness) in at least four targets of our sample.
-
-
LBAs do not suffer from the [CII]-deficit shown by infrared-bright galaxies, especially those with a significant AGN contribution. This is important for planning future observations of high-redhifts main sequence galaxies with available submillimeter interferometers in the [CII] line.
-
-
The [CII] emission of LBAs roughly follow the local HII-starburst [CII]-SFR relationship published by De Looze et al. (2014). Despite the fact that LBAs show dense and warm gas similar to the gas in local dwarf galaxies, with which they also share stellar masses and metallicities, their [CII]/SFR ratio is higher than in local dwarfs, suggesting that LBAs belong to a distinct local population. We stress however, that the SFR-[CII] relationship has high dispersion, so SFRs cannot be derived with a precision better than a factor of , and that the FIR continuum is a more efficient way to derive SFRs.
-
-
The CO/FIR ratios of LBAs are typical of MS SFGs, except for two targets that lie on the merger sequence.
-
-
We derive the total molecular gas fraction in LBAs with four methods, obtaining significantly higher fractions than in local SFGs with all methods except when ULIRG-like CO to H2 conversion factors are used. This again strengthens the analogy between LBAs and high-redshift SFGs.
-
-
LBAs lie above the local main sequence, but we find that, when their ISM properties are plotted as a function of their distance from the local MS, they do not lie in any of the regions occupied by other local samples. On the other hand, when the MS at is considered, LBA values fall on the same regions occupied by high-redshift main sequence galaxies. This suggests that LBAs have ISM properties unique and never encountered in local galaxies above and on the MS, but similar to those of main sequence galaxies at high-redshift.
In summary, LBAs are distinct in their ISM properties from local spirals, dwarfs, and ULIRGs although they share
some properties with each of these populations. Nevertheless, many ISM properties of LBAs are
similar to those found in high-redshift main sequence galaxies. Therefore, we confirm that LBAs are, as in other respects, true
analogs of these galaxies in their ISM properties as well.
In light of this conclusion, we have calculated the observing time needed to detect a typical Lyman Break Galaxy
(i.e., a high redshift main sequence galaxy wit ) at redshift
2 in [CII] with band 9 of ALMA.
We find that one can detect such a target in a few
hours with S/N =10 and map it in 12-18 hr (depending on the number of antennae).
Acknowledgements.
The authros wish to thank the anonymous referee for the very useful comments and suggestions that improved the paper.PACS has been developed by a consortium of institutes led by MPE (Germany) and including UVIE (Austria); KU Leuven, CSL, IMEC (Belgium); CEA, LAM (France); MPIA (Germany); INAF-IFSI/OAA/OAP/OAT, LENS, SISSA (Italy); IAC (Spain). This development has been supported by the funding agencies BMVIT (Austria), ESA-PRODEX (Belgium), CEA/CNES (France), DLR (Germany), ASI/INAF (Italy), and CICYT/MCYT(Spain).
A.J.B. acknowledges support from NFS grant AST-0955810.
A.Verma acknowledges support from the Leverhulme Trust in the form of a Research Fellowship a grant from the University of Oxford’s Returning Carers Fund.
References
- Abel et al. (2009) Abel,. N. P., Dudley, C., Fischer J., et al., 2009, ApJ, 701, 1147
- Alexandroff et al. (2012) Alexandroff, R., Overzier, R. A., Paragi Zsolt, et al., 2012, MNRAS, 423, 1325
- Baldwin et al. (1981) Baldwin, J., A., Phillips, M., M., and Terlevich, R., PASP,1981 , 93, 5D
- Bañados et al. (2015) Baados, E.; Decarli, R.; Walter, F., et al., 2015, ApJ, 805,8
- Basu-Zych et al. (2007) Basu-Zych, A., Schiminovich, D., R.,Johnson, B., D., et al., ApJS, 2007, 173,457
- Basu-Zych et al. (2009) Basu-Zych, A., Gonçalves, T., S., Overzier, R., et al., ApJ, 2009, 699, L118
- Berta et al. (2016) Berta, S., Lutz.,D., Genzel, R., et al. 2016, A%A,,587,73
- Béthermin et al. (2014) Béthermin, M. Daddi, e., Magdis, G., et al., 2014, ,A&A, arXiv:1409.5796
- Bigiel Blitz (2012) Bigiel, F. and Blitz, L., 2012, ApJ, 756, 183
- Bothwell et al. (2016) Bothwell, M. S., Aguirre J. E., Aravena M., et al., 2016, MNRAS, arXiv:1612:04380
- Brisbin et al. (2015) Brisbin, D., Ferkinhoff, C., Nikola, T., et al., 2015, ApJ, 799,13
- Carilli Walter (2013) Carilli, C.L. and Walter, F., 2013,ARA&A,51,105
- Combes et al. (2013) Combes, F., García-Burillo, S., Braine, J., et al., 2013, A&A, 550,41
- Contursi et al. (2013) Contursi, A., Poglitsch, A., Graciá Carpio, J., et al., 2013, A&A, 549,118
- Cormier et al. (2015) Cormier, D., Madden, S. C., Lebouteiller, V., et al., 2015, A&A, 578, 53
- Cox (2005) Cox, D., 2005, ARAA, 43, 337
- Cresci et al. (2009) Cresci, G., Hicks, E. K. S., Genzel, R., et al., 2009, ApJ, 697,115
- Daddi et al. (2010a) Daddi, E., Elbaz, D., Walter, F., et al., 2010a, ApJ, 714, 118
- Daddi et al. (2010b) Daddi, E., Bournaud, F., Walter, F., et al., 2010b, ApJ, 713, 686
- Dale Helou (2002) Dale, D.,A., and Helou G., 2002, ApJ, 576,159
- De Breuck et al. (2014) De Breuck,C., Williams, R.J., Swinbank, M., et al., 2014, AA, 565, A59
- De Looze et al. (2014) De Looze I., Cormier D, Lebouteiller V., et al., 2014, A&A, 568A, 62
- Díaz-Santos et al. (2013) Díaz-Santos, T., Armus, L., Charmandaris, V. et al., 2013, ApJ, 774, 68
- Downes Solomon (1998) Downes, D Solomon P.M., ApJ, 1998, ApJ, 507, 615
- Draine Li (2007) Draine B.T and Li A., 2007, ApJ, 657,810
- Draine et al. (2007) Draine B.T, Dale, D.,A.,Bendo, G., et al., 2007, ApJ, 663,866
- Elbaz et al. (2007) Elbaz, D., Daddi, E., Le Borgne D., 2007 , A&A, 468,33
- Elmegreen et al. (2008) Elmegreen, B. G., Bournaud, F., and Elmegreen, D. M. , 2008, ApJ, 688, 67
- Erb et al. (2006a) Erb, D.,K., Steidel, C., Shapley, A. E., et al., 2006a, ApJ, 646, 107
- Erb et al. (2006b) Erb, D., K., Shapley, A,, E., Pettini, M., et al., 2006b, ApJ,644,813
- Fabbiano et al. (2003) Fabbiano, G., Krauss M., Zeras A., et al. 2003, ApJ, 598,272
- Fischer et al. (2014) Fischer, J., Abel, A.P., González-Alfonso, E., et al., 2014, ApJ, 795, 117
- Förster Schreiber et al. (2009) Förster Schreiber, N.M., Genzel, R., Bouché, N., et al., 2009, ApJ, 706,1364
- Freundlich et al. (2013) Freundlich, J., Combes, F., Tacconi, L.,J., et al., 2013, A&A,553, 130
- Glazebrook (2013) Glazebrook, K., 2013, PASA, 30, 56
- Gallerani et al. (2012) Gallerani, S., Neri, R., Maiolino, R., et al., 2012, A&A, 543,114
- Genzel et al. (2010) Genzel, R., Tacconi, L. J., Graciá-Carpio, J. 2010, MNRAS, 407, 209
- Genzel et al. (2011) Genzel, R., Newman, S., Jones, T., et al., 2011, ApJ, 733,101
- Genzel et al. (2012) Genzel, R., Tacconi, L., Combes.,F. et al., 2012, ApJ, 746, 69
- Genzel et al. (2015) Genzel, R.,Tacconi, L.J., Lutz D., et al., 2015, ApJ, 800, 20
- Goicoechea et al. (2015) Goicoechea, J. R., Teyssier, D., Etxaluze, M., et al., 2015,ApJ, arXiv150803801G
- Gonçalves et al. (2010) Gonçalves,T., S., Basu-Zych, A. , Overzier, R., et al., 2010,ApJ, 724, 1373
- Gonçalves et al. (2014) Gonçalves,T., S., Basu-Zych, A. , Overzier, R., et al., 2014, MNRAS, 442,1429
- González-Alfonso et al. (2008) González-Alfonso, E., Smith, H. A., Ashby, M. L. N.,et al., 2008, ApJ, 675, 303
- González-Alfonso et al. (2015) González-Alfonso, E., Fischer, J., Sturm, E., et al., 2015, ApJ, 800, 69
- Graciá Carpio et al. (2011) Graciá Carpio, J., Sturm, E., Hailey-Dunsheath, S., et al., 2011, ApJL, 728,7
- Guilloteau et al. (1992) Guilloteau S., Delannoy, J., Downes, D., et al., 1992, A&A, 262, 624
- Guilloteau et al. (2000) Guilloteau S. & Lucas, R., 2000, ASP Conference Proceedings, 217,edited by J.G. Magnum and S.J.E. Radford, Astronomical Society of the Pacific
- Hailey-Dunsheath et al. (2010) Hailey-Dunsheath, S., Nikola, T., Stacey, G. J., et al., 2010, ApJL, 714, 162
- Heckman et al. (2005) Heckman, T. M., Hoopes, C. G., Seibert, M., et al., 2005, ApJ, 619, L35
- Heckman et al. (2011) Heckman, T. M., Borthakur, S., Overzier, R., et al., 2011, ApJ, 730, 2011
- Helou et al. (1988) Helou, G., Khan, I. R., Malek, L., et al. 1988, ApJS, 68, 151
- Herrera-Camus et al. (2015) Herrera-Camus, R., Bolatto, A. D., Wolfire, M., et al., 2015, ApJ, 800,1
- Herrera-Camus et al. (2017) Herrera-Camus, R., Bolatto, A. D., Wolfire, M., et al., 2017, ApJ, 835, 201
- Hollenbach & McKee (1989) Hollenbach, D. J. & McKee, C. F. 1989, ApJ, 342, 306
- Hoopes et al. (2007) Hoopes, C. G., Heckman, T. M., Salim, S., et al., 2007, ApJS, 173, 441
- Ibar et al. (2015) Ibar, E., Lara-López, M. A., Herrera-Camus, R., et al., 2015, MNRAS, 449 , 2498
- Inami et al. (2013) Inami, H., Armus, L., Charmandaris, V., et al., 2013, ApJ, 777, 156
- Jankins & Tipps (2011) Jankins, E.,B., and Tipps, T.,M., 2011, ApJ, 734,65
- Janssen et al. (2016) Janssen A. W. ,Christopher N., Sturm E., et al., 2016, ApJ, 822,43
- Kaufman et al. (1999) Kaufman, M. J., Wolfire, M. G., Hollenbach, David J., et al., 1999, ApJ, 527, 795
- Kennicutt & Evans (2012) Kennicutt, Robert C., Jr and Evans, N.J., 2012, ARA&A, 50, 531
- Kroupa et al. (2003) Kroupa, P., and Weidner, C., 2003, ApJ,598,1076
- Law et al. (2007) Law, D. R., Steidel, C. C., Erb, K. D., et al., 2007, 669, 929
- Leroy et al. (2011) Leroy, A. K., Evans, A. S., Momjian, E., et al., 2011, ApJ, 739, 25
- Li & Draine (2001) Li A. and Draine, B.T 2001, ApJ, 554,778
- Lian et al. (2015) Lian, J. H., Li, J. R., Yan, W., Kong, et al., 2015, MNRAS,446,1449
- Luhman et al. (2003) Luhman, M. L., Satyapal, S., Fischer, J., et al., 2003, ApJ, 594, 758
- Lutz et al. (2016) Lutz, D., Berta, S., Contursi, A., et al. 2016, A&A, 591,136
- Magdis et al. (2012a) Magdis, G. E., Daddi, E., Sargent, M. et al. 2012, ApJ ,758,L9
- Magdis et al. (2012b) Magdis, G. E., Daddi, Béthermin, M.. et al., 2012, ApJ ,760,6
- Magdis et al. (2014) Magdis, G. E., Rigopoulou, D., Hopwood, R., et al., 2014, ApJ, 796,63
- Magnelli et al. (2014) Magnelli, B., Lutz D., Saintonge A., et al., 2014, A&A, 561, 86
- Maiolino et al. (2009) Maiolino, R., Caselli P., Nagao, T.,et al., 2009, A&A, 500, L4
- Maiolino et al. (2012) Maiolino, R., Gallerani, S., Neri, R., 2012, MNRAS, 425, 66
- Maiolino et al. (2015) Maiolino, R., Carniani, S., Fontana A., 2015, MNRAS, 452, 54
- Malhotra et al. (2001) Malhotra, S., Kaufman, M. J., Hollenbach, D., et al., 2001, ApJ, 561, 766
- Negishi et al. (2001) Negishi, T., Onaka, T., Chan, K.-W., et al., 2001, A%A, 357, 566
- Newman et al. (2012a) Newman, S. F., Genzel, R., Förster-Schreiber, N. M., et al., 2012, ApJ, 761,43
- Newman et al. (2012b) Newman, S. F., Shapiro Griffin, G., K.; Genzel, R., et al., 2012, ApJ, 752,111
- Overzier et al. (2008) Overzier, R.,A., Heckman T. M. , Kauffmann, G., et al., 2008, ApJ, 667, 37
- Overzier et al. (2009) Overzier, R.,A., Heckman T. M. , Tremonti,C.,, et al., 2009, ApJ, 706, 203
- Overzier et al. (2010) Overzier, R.,A., Heckman T. M. , Schiminovich, D., et al., 2010 ApJ, 710, 979
- Overzier et al. (2011) Overzier, R.,A., Heckman T. M. , Wang, J., et al., 2011,ApJ, 726,L7
- Pentericci et al. (2016) Pentericci, L., Carniani, S., Cstellano, M., et al., 2016, ApJL, 829, L11
- Pettini et al. (2004) Pettini, M., and Pagel, B. E. J., 2004, MNRAS, 348, L59
- Pilbratt et al. (2010) Pilbratt, G. L., Riedinger, J. R., Passvogel, T., et al., 2010, A&AL, 518, 1
- Poglitsch et al. (2010) Poglitsch, A., Waelkens, C., Geis, N. et al., 2010, A&AL, 518, 2
- Saintonge et al. (2011) Saintonge, A., Kauffmann,G., Kramer, C., et al., 2011, MNRAS, 415,32
- Saintonge et al. (2013) Saintonge, A., Lutz, D., Genzel, R., et al., 2013, ApJ, 778, 2
- Salmon et al. (2015) Salmon, B., Papovich, C., Finkelstein S. L., 2015, ApJ, 799, 183
- Schaerer et al. (2015) Schaerer, D., Boone, F., Jones, T., et al., 2015, A&A, 576, 2
- Speagle et al. (2014) Speagle J. S., Steinhardt C. L., Capak P. L., et al., 2014, ApJS, 214,15
- Stacey et al. (2010) Stacey, G. J., Hailey-Dunsheath, S., Ferkinhoff, C., et al., 2010, ApJ, 724,957
- Steidel et al. (1996) Steidel, C. C.,Giavalisco, M., Dickinson, M., et al., 1996, AJ,112,352
- Steidel et al. (2014) Steidel, C. C., Rudie G. C., Strom, A. L., et al., 2014, ApJ,795, 165S
- Swinbank et al. (2011) Swinbank, A. M., Papadopoulos P. P., Cox, P., 2011, ApJ, 742,11
- Swinbank et al. (2012) Swinbank, A. M., Smail, Ian, Sobral, D., et al., 2012, ApJ, 760, 130
- Tacconi et al. (2010) Tacconi, L. J., Genzel, R., Neri, R., , et al., 2010, Nature, 463,781
- Tacconi et al. (2013) Tacconi, L. J., Neri, R., Genzel, R., et al., 2013, ApJ, 768,74
- U et al. (2012) U, V., Sanders, D.B., Mazzarella, J.M., et al., 2012, ApJS, 203, 9
- van Moorsel et al. (1996) van Moorsel, G., Kemball, A., & Greisen, E., 1996, ADASS, A.S.P. Conference Series, 101, 37
- Veilleux et al. (1987) Veilleux, S., and Osterbrock, D.E., 1987, ApJS,63,295,295
- Venemans et al. (2012) Venemans, B. P., McMahon, R. G., Walter, F., et al., 2012, ApJ, 751,L25
- Zhao et al. (2016) Zhao, Y., Yan, L. Tsai, C., 2016, ApJ, 824, 2016
- Wagg et al. (2012) Wagg, J., Wiklind, T., Carilli, C., et al., 2012, ApJ, 752, L30
- Wang et al. (2013) Wang, R., Waag, J., Carilli, C., et al., 2013, ApJ, 773, 44
- Whitaker et al. (2012) Whitaker K.,E., van Dokkum, P.G., Brammer G., et al., 2012, ApJL, 754
- Wisnioski et al. (2015) Wisnioski, E., Førster–Schreiber, N., Wuyts, S., et al., 2015, ApJ, 799, 209
- Yun et al. (2015) Yun, Min S., Aretxaga, I., Gurwell, M. A., 2015, MNRAS, 454,3485