Interactions between Silica Particles in the Presence of Multivalent Coions
Abstract
Forces between charged silica particles in solutions of multivalent coions are measured with colloidal probe technique based on atomic force microscopy. The concentration of 1: electrolytes is systematically varied to understand the behavior of electrostatic interactions and double-layer properties in these systems. Although the coions are multivalent the Derjaguin, Landau, Verwey, and Overbeek (DLVO) theory perfectly describes the measured force profiles. The diffuse-layer potentials and regulation properties are extracted from the forces profiles by using the DLVO theory. The dependencies of the diffuse-layer potential and regulation parameter shift to lower concentration with increasing coion valence when plotted as a function of concentration of 1: salt. Interestingly, these profiles collapse to a master curve if plotted as a function of monovalent counterion concentration.
I Introduction
Interactions between charged objects in electrolyte solutions are important for many biological systems Strey et al. (1998), and in processes such as paper making Iselau et al. (2015), waste water treatment Bolto and Gregory (2007), ceramic processing Cerbelaud et al. (2010), ink-jet printing Kuscer et al. (2012), particle design Zanini et al. (2017), and concrete hardening Labbez et al. (2006). Electrostatic interactions across such solutions are strongly influenced by the type of ions present and their concentration. One of the most important ion properties in this respect is the ionic valence. Furthermore, it is important whether the multivalent ions are counterions, which are oppositely charged than the surface, or coions, which carry the same charge as the surface.
The forces between charged colloidal particles or charged surfaces across aqueous solutions can now be routinely measured with variety of experimental techniques such as surface force apparatus (SFA) Israelachvili et al. (2010); Espinosa-Marzal et al. (2012), colloidal probe atomic force microscopy (AFM) Ducker et al. (1991); Butt (1991), total internal reflection microscopy (TIRM) Prieve (1999); von Grunberg et al. (2001), and optical tweezers Gutsche et al. (2007); Crocker and Grier (1994).
Direct force measurements in the presence of multivalent counterions received increased attention lately, especially in the view of the validity of their description within the mean-field Poisson-Boltzmann theoryPashley (1984); Besteman et al. (2004); Zohar et al. (2006); Sinha et al. (2013); Danov et al. (2016); Montes Ruiz-Cabello et al. (2014); Moazzami Gudarzi et al. (2015); Valmacco et al. (2016a); Trefalt et al. (2017a). Multivalent counterions typically strongly influence the electrostatic forces already at very minute concentrations Besteman et al. (2004); Zohar et al. (2006); Sinha et al. (2013); Montes Ruiz-Cabello et al. (2014); Moazzami Gudarzi et al. (2015); Valmacco et al. (2016a). These studies showed that mean-field PB theory can be used with confidence at larger separation distances, while at smaller separations of few nanometers, the experimental forces deviate from the PB description. These deviations can be caused by ion-ion correlations and/or other short-range forces Montes Ruiz-Cabello et al. (2014); Trefalt et al. (2017a); Zohar et al. (2006); Trulsson et al. (2006); Kanduč et al. (2017).
While systems containing multivalent counterions are relatively well investigated, literature is much scarcer in the case of multivalent coion systems. Force profiles across solutions containing multivalent counterions are usually exponential, which is typical for double-layer forces. Interestingly, their coion counterparts invoke non-exponential and soft long-ranged forces, which can be well described with the PB theory Kohonen et al. (2000); Montes Ruiz-Cabello et al. (2014). Extreme case of such non-exponential force profiles can be induced by like-charged polyelectrolytes, which can be modelled as coions with extremely high effective valence Moazzami-Gudarzi et al. (2016, 2017). This non-exponential behavior is induced by the expulsion of the multivalent coions from the slit between two charged surfaces. At large-separation distances, both counterions and coions enter in the slit. When distance between the surfaces is reduced, the electrostatic repulsion between the surface and multivalent coions is increased, which finally leads to the expulsion of the latter from the slit and only monovalent counterions are left between the charged surfaces. These counterion-only double-layer results in a power-law dependence of the force Langmuir (1938); Briscoe and Attard (2002); Montes Ruiz-Cabello et al. (2014). Therefore, the forces in multivalent coion systems are exponential only at large distances and transition to a power-law behavior at smaller separations. Furthermore, the influence on these type on interactions on the aggregation of colloidal particles can have non-expected results. For example, for aggregating suspension critical coagulation ionic strength (CCIS) strongly decreases with increasing counterion valence Trefalt et al. (2017b). This behavior is known for over a century and is referred to as the classical Schulze-Hardy rule. Surprisingly, if one uses the multivalent coions as an aggregating agent as opposed to the counterions, an inversion is observed as it was shown recently Cao et al. (2015). In multivalent coion systems the CCIS is increasing with increasing valence, coagulating power of coions decreases with increasing valence. Due to this inversion, the phenomenon was given a name: inverse Schulze-Hardy rule Cao et al. (2015); Trefalt (2016); Trefalt et al. (2017b).
Although, some information about these forces exists, to the best of our knowledge there are no studies which systematically investigate the forces and properties of the double-layer in a large range of concentrations for different coion valences. In particular, no detailed information exists on the regulation of charged surfaces in these systems.
In this work we focus on interactions between silica particles across solutions containing multivalent coions. We systematically study the influence of the concentration and valence of the coions on double-layer forces. We further examine the properties of the electric double-layer, such as diffuse-layer potential and regulation parameter, and try to pinpoint crucial factors which determine its behavior. Furtheremore a direct comparison of force curves at same salt concentration, counterion concentration, and ionic strength reveals how the structure of the double-layer changes when the valence of the coion changes.
II Experimental
II.1 Materials
For force measurements spherical silica particles (Bangs Laboratories Inc., USA) were used. The producer reports an average size of 5.2 m. Before the measurements particles were heated at 1200 ∘C for 2 hours. During heat treatment the particles shrink for about 15 % which yields an average diameter of 4.4 m as reported earlier Valmacco et al. (2016b). The root mean square (RMS) roughness of 0.63 nm was measured by AFM imaging in liquid Valmacco et al. (2016b). Forces were measured in aqueous solutions of KCl (Sigma Aldrich), K2SO4 (Acros Organics), K3Fe(CN)6 (Sigma Aldrich), and K4Fe(CN)6 (Sigma Aldrich). The pH was kept at with addition of 1 mM KOH (Acros Organics) and was checked before and after each measurement. Mili-Q water (Millipore) was use throughout.
II.2 Force Measurements
Force measurements were carried out with colloidal probe technique in the symmetric sphere-sphere geometry Trefalt et al. (2017a). The particles were first glued to the tip-less cantilevers (MikroMasch, Tallin, Estonia) which were beforehand cleaned in air plasma (PDC-32G, Harrick, New York) for 5 min. Tiny drop of glue (Araldite 2000+) and few silica particles were placed on a glass slide. The cantilever was mounted in the AFM head and manipulated to touch the glue then a silica particle was picked up and glued on the cantilever. The particles were separately spread on a quartz substrate (Ted Pella inc.), which was cleaned with piranha solution (3:1 mixture of H2SO4 (98 %) and H2O2 (30 %)). Both a quartz slide and a cantilever were then heated side-by-side in an oven at 1200 ∘C for 2 h. The heating procedure resulted in a firm attachment of the particles to the substrate and the cantilever. During this process the glue is also completely removed.
All the measurements were done at room temperature ∘C with a closed-loop AFM (MFP-3D, Asylum Research) mounted on an inverted optical microscope (Olympus IX70). The quartz slides and cantilevers with attached probes were rinsed with water and ethanol, dried in air, and plasma-treated for 20 min. The quartz substrate was glued (Pattex 100% Repair Gel) onto the glass slide sealing the AFM cell. The AFM fluid cell was mounted and flushed thoroughly with the respective electrolyte solution. The particle on the cantilever was centered above one particle on the substrate with the precision of about 100 nm. The deflection of the cantilever was recorded for 100-200 approach-retract cycles with the sampling rate of 5 kHz and cantilever velocities of 300 nm/s, cycling frequency was 0.5 Hz. The zero separation distance was assumed when the force reached a value of 10 mN/m for repulsive curves, and 4 mN/m for attractive curves. Cantilever deflection was converted to the force using Hook’s law, where the spring-constant of the cantilever was determined by the method described by Sader et al. Sader et al. (1999). The approach part of the raw force curves obtained with the procedure described above were averaged. The averaging of about 150 curves leads to the noise level of about 2 pN. Only such averaged force profiles are used in subsequent analysis. For each condition forces between 3-5 different pairs of particles were measured.
III Charging of the Silica Surface
Basic Stern model is used to model the surface charge of silica particles at different solution compositions. For simplicity we just use 1-p model, where only one type of silanol groups can undergo deprotonation according to the following reaction Hiemstra et al. (1989); Kobayashi et al. (2005); Behrens and Grier (2001)
| (1) |
The equilibrium between bulk protons and silanol groups is established according to the following equation,
| (2) |
where () is the equilibrium constant, () is the bulk concentration of protons, is the elementary charge, is the inverse thermal energy, is the surface potential, and and are the surface densities of deprotonated and protonated silanol groups, respectively. The total number of silanol groups on the surface is given by
| (3) |
The surface charge density can be calculated from the number of deprotonated silanol groups as
| (4) |
The potential drop over the Stern plane is determined by Stern layer capacitance, ,
| (5) |
where is the diffuse layer potential. Finally, the charge-potential relationship closes the above set of equations:
| (6) |
is the dielectric constant, is the vacuum permittivity, is the ion concentration, and ion valence. The following parameters were used to calculate the diffuse-layer potential from the basic Stern model: ionization constant p, silanol groups site density nm-2, and Stern capacitance Fm-2.
IV Analysis of the Force Curves
The force measurements are done in a sphere-sphere, while the calculations in a plate-plate geometry. The Derjaguin approximation is used for the transformation between these two geometries
| (7) |
where is the force between the two spherical particles, is the energy per unit area in the plate-plate geometry, and is the effective radius, which is equal to for particles with radii .
The forces are modelled within DLVO theory
| (8) |
where is the van der Waals and is the double-layer force. The former is calculated with non-retarded expression
| (9) |
where is the Hamaker constant and is the surface-surface separation.
The double-layer force is calculated by solving the Poisson-Boltzmann equation in the plate-plate geometry
| (10) |
where is the electric potential, and is the coordinate normal to the plates. The plates are positioned at and . The PB equation can be solved only in the half-space due to symmetry. The constant regulation (CR) boundary conditions are used
| (11) | |||
| (12) |
where and are surface charge density and diffuse layer potential of the isolated surface, and is the inner layer capacitance. Instead of using inner layer capacitance we introduce regulation parameter as
| (13) |
where diffuse layer capacitance is defined as
| (14) |
Regulation parameter enables to easily interpret the boundary conditions, represents constant charge (CC) conditions, while represents constant potential (CP) conditions.
The disjoining pressure is then calculated using a potential at the mid-plane
| (15) |
The integration of the pressure profile results in the energy per unit area
| (16) |
Derjaguin approximation Eq. (7) is used to calculate the double-layer force, , from energy per unit area, , and the total force is calculated via Eq. (8).
The PB equation is solved numerically and the solution is modelled as a mixture of 1:1 electrolyte stemming from pH adjustment with KOH and 1: electrolyte for the respective added salt.
For comparison and easier interpretation the Debye-Hückel (DH) theory is also used to calculate far-field approximation of the double layer force
| (17) |
where is the effective potential and is the inverse Debye length, where is the ionic strength calculated as . For 1: electrolyte the ionic strength is , while monovalent counterion concentration is proportional to the valence as , where is the concentration of 1: salt.
Finally, experimental force profiles are interpreted by fitting DLVO theory and extracting the following parameters: salt concentration, diffuse-layer potential, regulation parameter, and Hamaker constant. In all cases the difference between the fitted and nominal salt concentration is typically below 10-15 %. Note that in the present case of 1: salts, the sign of the diffuse-layer potential of silica particles can be unambiguously determined from the force profile, since the curves would have a different shape if the surfaces would have been positively charged. Variations of diffuse-layer potentials and regulation parameters for different pairs of particles at the same conditions are typically between 10 and 20 %.
V Results and Discussion
Forces between pairs of silica particles were measured with colloidal probe technique based on AFM. These forces were measured in the presence of KCl, K2SO4, K3Fe(CN)6, and K4Fe(CN)6 at pH 10.
Forces measured between silica particles in KCl are shown in Fig. 1a.
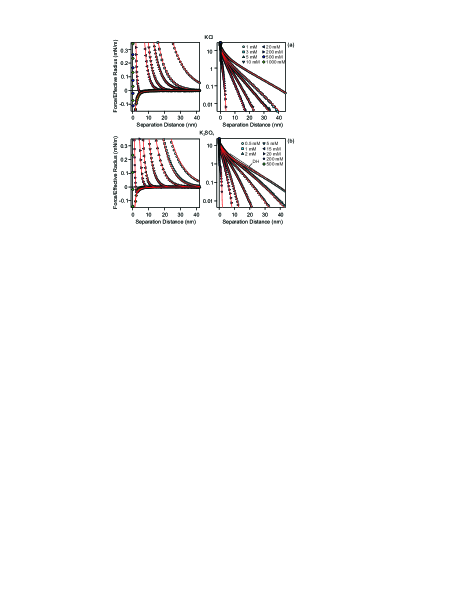
On the left and right panel forces are plotted in linear and logarithmic representations, respectively. At low salt concentrations the forces are repulsive and they decay exponentially as expected for double-layer interactions. With increasing salt concentration forces become shorter-ranged and finally at high concentrations above 500 mM they turn attractive as the vdW force becomes dominant. In the log-lin representation one can also observe that the slope of the forces in increasing with increasing concentration as the decay length shortens. DLVO fits are shown as lines in the Fig. 1. The fitting strategy is the following. First the Hamaker constant is fitted at KCl concentrations above 200 mM. An average value of J is obtained, which is in agreement with our earlier results Valmacco et al. (2016b). The measured Hamaker constant is also close to the theoretical estimate of J calculated from accurate dielectric spectra Ackler et al. (1996). This high value of the measured Hamaker constant is due to extremely small surface roughness of the silica particles heated at 1200 ∘C Valmacco et al. (2016b). The fitted value of the Hamaker constant is fixed for lower concentrations and it is also consistent with all other used salts. For the double-layer component of the force curve, the background 1:1 electrolyte concentration is fixed to 0.1 mM. The remaining fitting parameters are: salt concentration, diffuse-layer potential, and regulation parameter. The same fitting procedure is used also for other salts. The fitted curves are presented as lines in Fig. 1. The DLVO theory describes the force curves perfectly, except at very short separations below few nanometers, where the experimental curves are more repulsive then predicted by the theory. This short-range repulsion is probably due to the hydration forces Vigil et al. (1994); Valle-Delgado et al. (2005); Grabbe and Horn (1993); Acuna and Toledo (2011) or overlapping hairy layers of polysilicilic acid Kobayashi et al. (2005) and it is not part of our theoretical description.
In Fig. 1b forces in the presence of K2SO4 are shown. Similar behavior as in the case of KCl is observed. The forces are repulsive at low salt concentration and become attractive at high levels of salt. However, the onset of attractive vdW force is observed at lower concentrations as compared to the KCl case. Again the DLVO theory fits the data very well. The double-layer forces in the presence of divalent coions are not exponential anymore as evident for the log-lin presentation. The exponential Debye-Hückel curve is presented with the dashed line for the lowest concentration, see Fig 1b right. One can observe that the experimental force at 0.5 mM of K2SO4 is only exponential at distances beyond 30 nm. At smaller separations the force deviates from the exponential behavior. Such long-range sigmoidal curves in the presence of mulitvalent coions were already observed by some of us Montes Ruiz-Cabello et al. (2014) and they can become extremely non-exponential for the coions with large effective charge Moazzami-Gudarzi et al. (2016, 2017). The source of this behavior is the exclusion of the multivalent coions from the area between the charged surfaces at close proximity. At large distances both monovalent counterions and mulitvalent coions are in the slit between two charged surfaces and the force between the respective surfaces is exponential with the decay length corresponding to the inverse Debye length for electrolyte. When the surfaces approach, the multivalent coions feel strong electrostatic repulsion from the charged surfaces and get excluded from the slit. At this point only the monovalent counterions are left in the slit. Such system behaves as salt-free (counterions-only) and results in the power-law decay of the force as first proposed by Langmuir Langmuir (1938). Further details on these non-exponential force profiles can be found in Montes Ruiz-Cabello et al. (2014).
Forces measured in solutions of K3Fe(CN)6 and K4Fe(CN)6 are presented in Fig. 2.
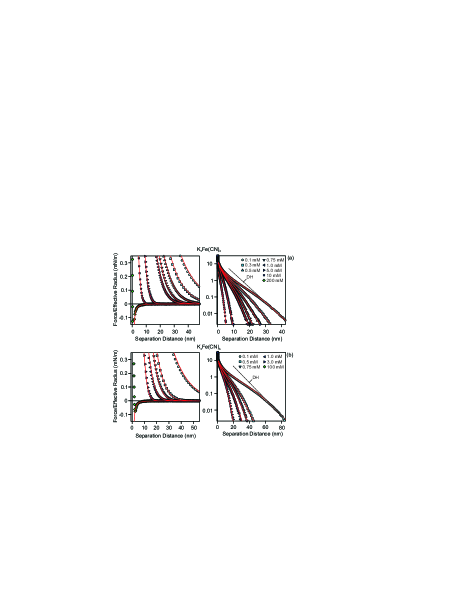
Subfigures 2a and b show the trivalent and tetravalent coion case, respectively. For both cases forces are repulsive at low salt and attractive at high salt levels. The DLVO theory, shown as full lines, nicely fits the experimental data. Again, for the two lowest concentrations in the log-lin representations the DH approximation is presented with dashed lines. The deviation from the non-exponential behavior is even more evident as for the K2SO4 case. Furthermore, this deviation is shifted to larger distances with increasing valence of the coions. The exclusion of the coions happens at larger distances because the repulsion between charged surfaces and coions is increasing with increasing valence Trefalt (2016).
To get a further insight in the interactions between silica particles in the presence of multivalent coions we compare the forces for different coion valences at the same (a) salt concentration, (b) counterion concentration, and (c) ionic strength in Fig. 3.
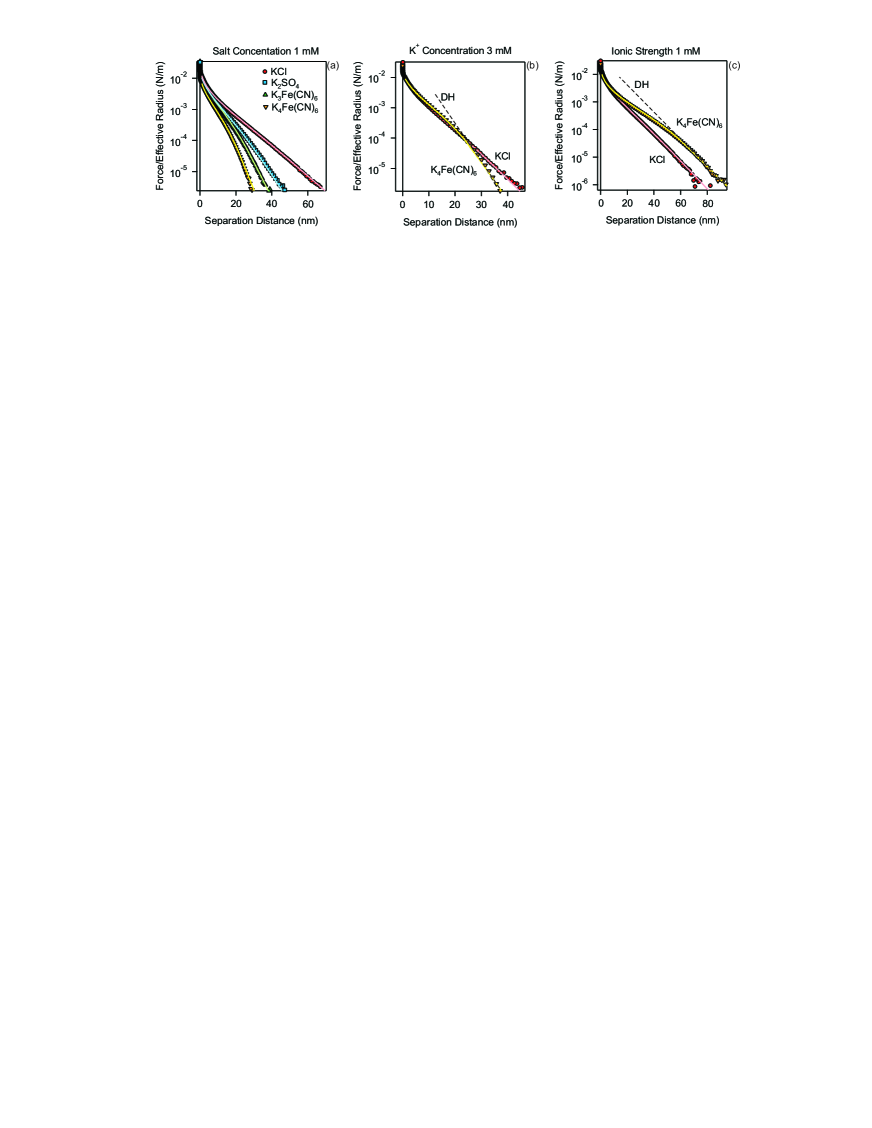
For all the cases conditions are chosen such that the vdW force is negligible and only the double-layer component of the force is present.
At constant salt concentration of 1 mM all forces for coion valences between 1 and 4 are repulsive, see Fig. 3a. Two features can be observed. First, only the force for monovalent coion, namely Cl-, is exponential, while the interactions for the multivalent coions are non-exponential. Second, the forces get progressively screened by increasing coion valence. This behavior is due to the increase of both the ionic strength as well as counterion (K+) concentration with increasing coion valence when the salt concentration is fixed.
If we now compare the force for KCl and K4Fe(CN)6 at constant counterion concentration of 3 mM of K+, an interesting behavior is revealed. At large separation distances the K4Fe(CN)6 repulsion is weaker as compared to the KCl case, while at distances below nm the two forces are comparable. As noted earlier large-distance behavior can be described by DH approximation, therefore the force is exponential with its decay length being . Since in the present case of constant counterion concentration the ionic strength for K4Fe(CN)6 salt is higher than for KCl, the K4Fe(CN)6 force decays faster at large separations. Also the slope in log-lin plot, which repersents this decay length is bigger for the tetravalent case. At smaller separations where coions are expelled the force is determined only by counterions in this case K+ and the two force curves collapse.
The third case, presented in Fig. 3c, shows forces at constant ionic strength of 1 mM. Here the long-distance behavior is similar for both KCl and K4Fe(CN)6 salts. Since, the ionic strength is constant the decay length of the exponential DH behavior is the same, resulting in the same slope for both curves in the log-lin representation. On the other side, the short-distance behavior is different, while the KCl force stays exponential down to few nanometers, the K4Fe(CN)6 force does not decay exponentially at short distances. Only at very short distances below nm, where tetravalent as well as monovalent coions are expelled from the slit the two curves collapse. This situation is again dominated by counterions.
Let us now look at the diffuse-layer potentials extracted from the force curves. In Fig. 4 the potentials are shown for all salts at different conditions.
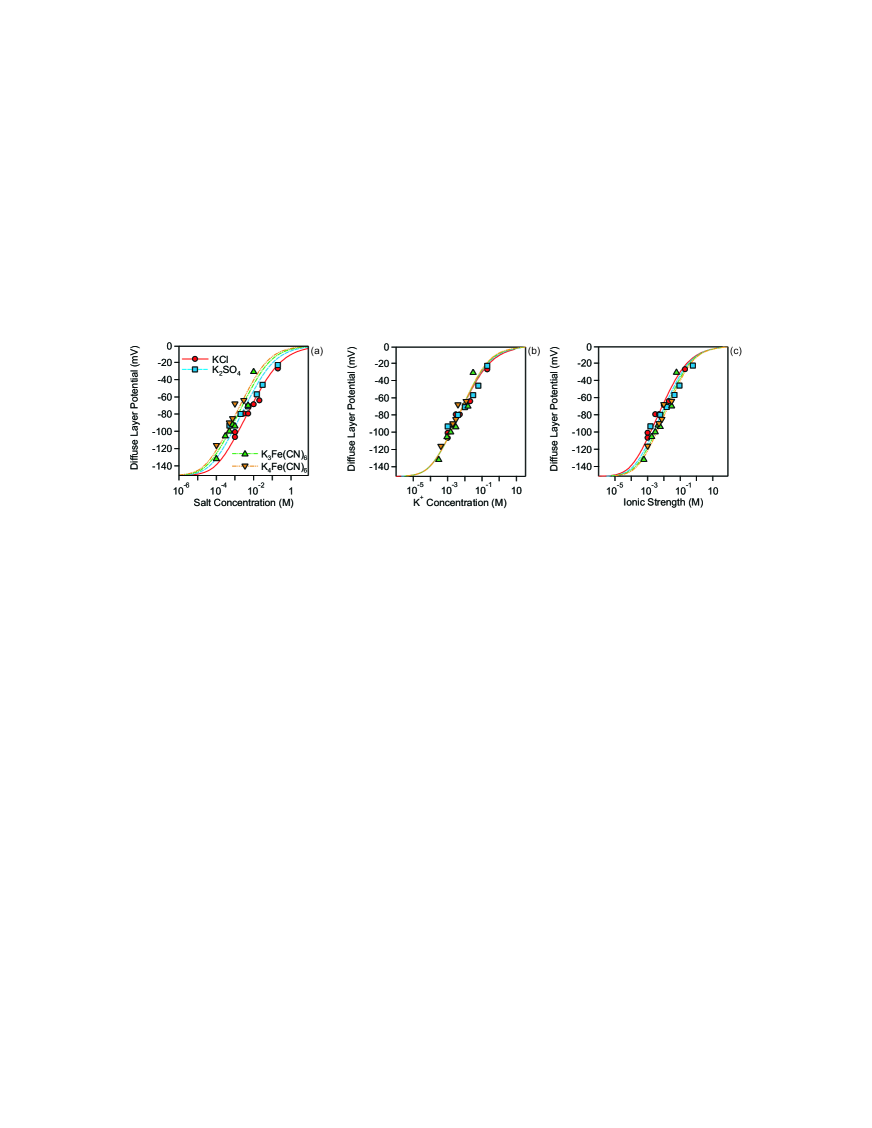
The results for coions of different valences are presented at: (a) the same salt concentration, (b) the same K+ concentration, and (c) the same ionic strength. The results of basic Stern model are shown as lines for comparison. In all cases the diffuse-layer potential is negative at low concentrations due to charged silanol groups on the silica surface, see Eq. 1. With increasing concentration the potential increases and is neutralized at very high salt levels. The diffuse-layer potential curves are shifted to lower concentrations when the coion valence is increased, see Fig. 4a. Although there is some scatter in the experimental data they nicely follow the basic Stern model. The presented coion valence trend can be rationalized in the following way. At constant salt concentration, the K+ concentration increases as , the surface charge is screened more strongly when K+ concentration is increased, and this leads to lower magnitude of the diffuse-layer potential. This rationale is confirmed by Fig. 4b where the potentials are plotted as a function of the K+ concentration. All the experimental data as well as basic Stern model calculations collapse on a single curve, showing that the potential is only a function of the counterion concentration. In a recent study by Trompette Trompette (2017), the type of monovalent coion is shown to have an effect on silica nanoparicle aggregation. This behavior suggests specific adsorption of coions to the silica surface, on the contrary our results suggest no specific adsorption of the coions. In our case the coions are multivalent and feel stronger repulsion from the silica surface which probably hinders their adsorption. In Fig. 4c the diffuse-layer potential is plotted as a function of ionic strength. Here the trend is reversed, the potential curves are shifted to higher ionic strength as coion valence increases, however in this case the trend is weaker. Similar reversal is observed in stability of colloidal suspensions as a function of coion valence and is referred to as the inverse Schulze-Hardy rule Cao et al. (2015); Trefalt et al. (2017a).
Finally we examine another important property of charged surfaces, namely its regulation behavior. In Fig. 5 regulation parameter is presented in a similar manner as the diffuse-layer potential above.
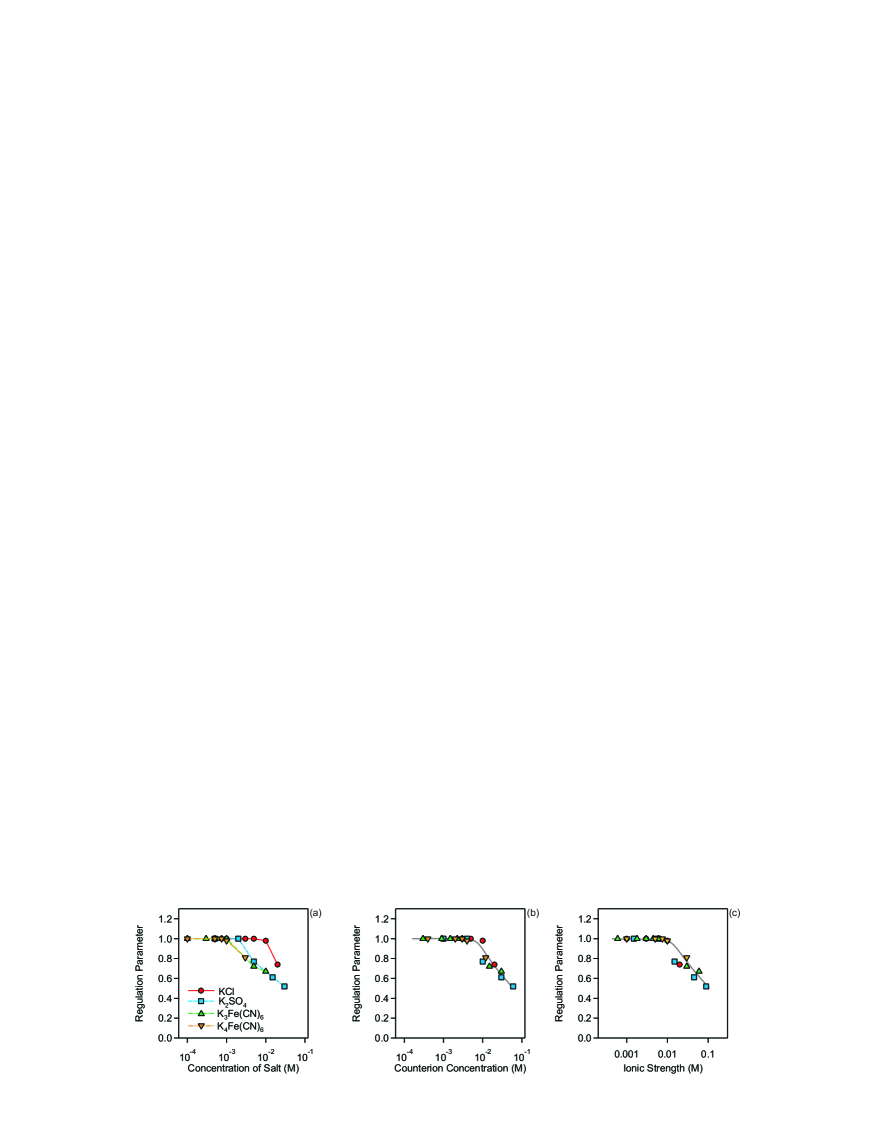
Regulation parameter describes how the charge on the surface is changing upon approach of the two particles. If regulation parameter, , is close to unity, the charge on the surface is constant upon approach. On the other hand for , the surface regulates/adjusts its charge upon approach Trefalt et al. (2016). Fig. 5 reveals that the general trend for all salts is the same, regulation parameter is close to unity at low salt concentration and it decreases with increasing concentration. One would expect an increase in regulation parameter in a situation where the inner layer capacitance, , is constant or it is decreasing with increasing concentration Trefalt et al. (2016). However, it has been recently shown with X-ray photoelectron spectroscopy in a liquid microjet, that the inner layer capacitance of silica surface is increasing with increasing concentration Brown et al. (2016). If is increasing with concentration the regulation parameter decreases with concentration, see Eq. (13). Such behavior is in line with our observations of decreasing regulation parameter with increasing concentration. At low concentrations below about 1 mM we have fixed in our fits in order to avoid the values above unity which are not consistent with the regulation model. Due to this modification the measured forces were slightly more repulsive than the calculated ones at short distances, and this behavior if probably connected to the short-range hydration repulsion which is known to be present for silica surfaces in aqueous solutions Vigil et al. (1994); Valle-Delgado et al. (2005); Grabbe and Horn (1993); Acuna and Toledo (2011); Valmacco et al. (2016a).
Similarly to the diffuse-layer potential, regulation parameter curves also shift to lower salt concentrations with increasing coion valence, see Fig. 5a. When the is plotted as a function of either K+ concentration or ionic strength the data points collapse on a single curve. Since there is relatively large scatter in the experimental points it is not possible to determine which collapse is correct. Regulation behavior is determined by adsorption of K+ ions to the surface and therefore the collapse on K+ concentration is probably a relevant one.
VI Conclusions
We have measured forces between negatively charged silica particles in the presence of 1: salts. In these systems the multivalent ions have the same charge as the surface and therefore play the role of coions. The measured forces are repulsive at low concentrations where the double-layer forces are strong, while at high concentration the attractive vdW forces are dominant as the electrostatic interactions are screened away. The double-layer force profiles assume a non-exponential shape, where transition between a long-range exponential and short-range power-law behavior is observed. This transition is due to the electrostatic exclusion of multivalent coions from the slit at smaller separation distances. At large separation distances the forces are parallel at constant ionic strength if plotted in log-lin representation. On the other hand at closer separations the forces overlap for different coion valences if the counterion concentration is constant. This behavior suggests that the monovalent counterion concentration determines the near-field force. The diffuse-layer potentials are increasing with increasing concentration for all investigated salts. The potential curves shift to lower salt concentrations with increasing coion valence, since the salts with higher valence is more effective in screening the surface charge. This behavior is in line with 1-p basic Stern model predictions. The order of the potential curves gets reversed if they are plotted as a function of ionic strength, the potential curve for lower valence comes first. Finally, if one plots the potentials as a function of monovalent counterion concentration all the experimental data as well as the basic Stern model calculations collapse on a single master curve. Similar shifts to lower salt concentrations with increasing coion valence are also observed for the regulation parameter. Furthermore, the collapse on a single master curve is also observed if regulation parameter is plotted as a function of monovalent counterion concentrations. From this behavior one can conclude that for a asymmetric 1: electrolytes, where represents the coion, the double-layer properties are mainly determined by the concentration of the monovalent counterions.
Acknowledgements
This research was supported by the Swiss National Science Foundation through grant 162420 and the University of Geneva. The authors are thankful to Michal Borkovec for providing access to the instruments in his laboratory and to Plinio Maroni for the help with AFM measurements.
References
- Strey et al. (1998) H. H. Strey, R. Podgornik, D. C. Rau, and V. A. Parsegian, Curr. Opin. Struct. Biol. 8, 309 (1998).
- Iselau et al. (2015) F. Iselau, P. Restorp, M. Andersson, and R. Bordes, Colloids Surf., A 483, 264 (2015).
- Bolto and Gregory (2007) B. Bolto and J. Gregory, Water Research 41, 2301 (2007).
- Cerbelaud et al. (2010) M. Cerbelaud, A. Videcoq, P. Abelard, C. Pagnoux, F. Rossignol, and R. Ferrando, Soft Matter 6, 370 (2010).
- Kuscer et al. (2012) D. Kuscer, G. Stavber, G. Trefalt, and M. Kosec, J. Am. Ceram. Soc. 95, 487 (2012).
- Zanini et al. (2017) M. Zanini, C.-P. Hsu, T. Magrini, E. Marini, and L. Isa, Colloids Surf., A in press (2017), 10.1016/j.colsurfa.2017.05.084.
- Labbez et al. (2006) C. Labbez, B. Jonsson, I. Pochard, A. Nonat, and B. Cabane, J. Phys. Chem. B 110, 9219 (2006).
- Israelachvili et al. (2010) J. Israelachvili, Y. Min, M. Akbulut, A. Alig, G. Carver, W. Greene, K. Kristiansen, E. Meyer, N. Pesika, K Rosenberg, and H. Zeng, Rep. Prog. Phys. 73, 036601 (2010).
- Espinosa-Marzal et al. (2012) R. M. Espinosa-Marzal, T. Drobek, T. Balmer, and M. P. Heuberger, Phys. Chem. Chem. Phys. 14, 6085 (2012).
- Ducker et al. (1991) W. A. Ducker, T. J. Senden, and R. M. Pashley, Nature 353, 239 (1991).
- Butt (1991) H. J. Butt, Biophys. J. 60, 1438 (1991).
- Prieve (1999) D. C. Prieve, Adv. Colloid Interface Sci. 82, 93 (1999).
- von Grunberg et al. (2001) H. H. von Grunberg, L. Helden, P. Leiderer, and C. Bechinger, J. Chem. Phys. 114, 10094 (2001).
- Gutsche et al. (2007) C. Gutsche, U. F. Keyser, K. Kegler, and F. Kremer, Phys. Rev. E 76, 031403 (2007).
- Crocker and Grier (1994) J. C. Crocker and D. G. Grier, Phys. Rev. Lett. 73, 352 (1994).
- Pashley (1984) R. M. Pashley, J. Colloid Interface Sci. 102, 23 (1984).
- Besteman et al. (2004) K. Besteman, M. A. G. Zevenbergen, H. A. Heering, and S. G. Lemay, Phys. Rev. Lett. 93, 170802 (2004).
- Zohar et al. (2006) O. Zohar, I. Leizerson, and U. Sivan, Phys. Rev. Lett. 96, 177802 (2006).
- Sinha et al. (2013) P. Sinha, I. Szilagyi, F. J. Montes Ruiz-Cabello, P. Maroni, and M. Borkovec, J. Phys. Chem. Lett. 4, 648 (2013).
- Danov et al. (2016) K. D. Danov, E. S. Basheva, and P. A. Kralchevsky, Materials 9, 145 (2016).
- Montes Ruiz-Cabello et al. (2014) F. J. Montes Ruiz-Cabello, G. Trefalt, P. Maroni, and M. Borkovec, Langmuir 30, 4551 (2014).
- Moazzami Gudarzi et al. (2015) M. Moazzami Gudarzi, G. Trefalt, I. Szilagyi, P. Maroni, and M. Borkovec, J. Phys. Chem. C 119, 15482 (2015).
- Valmacco et al. (2016a) V. Valmacco, M. Elzbieciak-Wodka, D. Herman, G. Trefalt, P. Maroni, and M. Borkovec, J. Colloid Interface Sci. 472, 108 (2016a).
- Trefalt et al. (2017a) G. Trefalt, T. Palberg, and M. Borkovec, Curr. Opin. Colloid Interface Sci. 27, 9 (2017a).
- Trulsson et al. (2006) M. Trulsson, B. Jonsson, T. Akesson, J. Forsman, and C. Labbez, Phys. Rev. Lett. 97, 068302 (2006).
- Kanduč et al. (2017) M. Kanduč, M. Moazzami-Gudarzi, V. Valmacco, R. Podgornik, and G. Trefalt, Phys. Chem. Chem. Phys. 19, 10069 (2017).
- Kohonen et al. (2000) M. M. Kohonen, M. E. Karaman, and R. M. Pashley, Langmuir 16, 5749 (2000).
- Moazzami-Gudarzi et al. (2016) M. Moazzami-Gudarzi, T. Kremer, V. Valmacco, P. Maroni, M. Borkovec, and G. Trefalt, Phys. Rev. Lett. 117, 088001 (2016).
- Moazzami-Gudarzi et al. (2017) M. Moazzami-Gudarzi, P. Maroni, M. Borkovec, and G. Trefalt, Soft Matter 13, 3284 (2017).
- Langmuir (1938) I. Langmuir, J. Chem. Phys. 6, 873 (1938).
- Briscoe and Attard (2002) W. H. Briscoe and P. Attard, J. Chem. Phys. 117, 5452 (2002).
- Trefalt et al. (2017b) G. Trefalt, I. Szilagyi, G. Téllez, and M. Borkovec, Langmuir 33, 1695 (2017b).
- Cao et al. (2015) T. Cao, I. Szilagyi, T. Oncsik, M. Borkovec, and G. Trefalt, Langmuir 31, 6610 (2015).
- Trefalt (2016) G. Trefalt, Phys. Rev. E 93, 032612 (2016).
- Valmacco et al. (2016b) V. Valmacco, M. Elzbieciak-Wodka, C. Besnard, P. Maroni, G. Trefalt, and M. Borkovec, Nanoscale Horiz. 1, 325 (2016b).
- Sader et al. (1999) J. E. Sader, J. W. M. Chon, and P. Mulvaney, Rev. Sci. Instrum. 70, 3967 (1999).
- Hiemstra et al. (1989) T. Hiemstra, W. H. van Riemsdijk, and G. H. Bolt, J. Colloid Interface Sci. 133, 91 (1989).
- Kobayashi et al. (2005) M. Kobayashi, F. Juillerat, P. Galletto, P. Bowen, and M. Borkovec, Langmuir 21, 5761 (2005).
- Behrens and Grier (2001) S. H. Behrens and D. G. Grier, J. Chem. Phys. 115, 6716 (2001).
- Ackler et al. (1996) H. D. Ackler, R. H. French, and Y. M. Chiang, J. Colloid Interface Sci. 179, 460 (1996).
- Vigil et al. (1994) G. Vigil, Z. H. Xu, S. Steinberg, and J. Israelachvili, J. Colloid Interface Sci. 165, 367 (1994).
- Valle-Delgado et al. (2005) J. J. Valle-Delgado, J. A. Molina-Bolivar, F. Galisteo-Gonzalez, M. J. Galvez-Ruiz, A. Feiler, and M. W. Rutland, J. Chem. Phys. 123, 034708 (2005).
- Grabbe and Horn (1993) A. Grabbe and R. G. Horn, J. Colloid Interface Sci. 157, 375 (1993).
- Acuna and Toledo (2011) S. M. Acuna and P. G. Toledo, J. Colloid Interface Sci. 361, 397 (2011).
- Trompette (2017) J.-L. Trompette, J. Phys. Chem. B 121, 5654 (2017).
- Trefalt et al. (2016) G. Trefalt, S. H. Behrens, and M. Borkovec, Langmuir 32, 380 (2016).
- Brown et al. (2016) M. A. Brown, A. Goel, and Z. Abbas, Angew. Chem., Int. Ed. 55, 3790 (2016).