Surprisingly different starspot distributions on the near equal-mass equal-rotation-rate stars in the M dwarf binary GJ 65 AB
Abstract
We aim to understand how stellar parameters such as mass and rotation impact the distribution of starspots on the stellar surface. To this purpose, we have used Doppler imaging to reconstruct the surface brightness distributions of three fully convective M dwarfs with similar rotation rates. We secured high cadence spectral time series observations of the AU separation binary GJ 65, comprising GJ 65A (M5.5V, d) and GJ 65B (M6V, d). We also present new observations of GJ 791.2A (M4.5V, d). Observations of each star were made on two nights with uves, covering a wavelength range from µm. The time series spectra reveal multiple line distortions, which we interpret as cool starspots and which are persistent on both nights suggesting stability on the timescale of 3 days. Spots are recovered with resolutions down to at the equator. The global spot distributions for GJ 791.2A are similar to observations made a year earlier. Similar high latitude and circumpolar spot structure is seen on GJ 791.2A and GJ 65A. However, they are surprisingly absent on GJ 65B, which instead reveals more extensive, larger, spots concentrated at intermediate latitudes. All three stars show small amplitude latitude-dependent rotation that is consistent with solid body rotation. We compare our measurements of differential rotation with previous Doppler imaging studies and discuss the results in the wider context of other observational estimates and recent theoretical predictions.
keywords:
stars: low-mass stars: imaging stars: starspots stars: atmospheres techniques: spectroscopic techniques: imaging spectroscopy1 Introduction
The surface brightness distributions of many G and K dwarfs have been reconstructed using Doppler imaging techniques (Strassmeier, 2009), but there are very few brightness images of M dwarfs, largely due to their intrinsic faintness. In rapidly rotating G and K stars, a solar-like dynamo mechanism under the action of rapid rotation (Moreno-Insertis et al., 1992; Schüssler et al., 1996) has been inferred from spot patterns (e.g. Barnes et al. 1998; Jeffers et al. 2007; Marsden et al. 2006a). The simultaneous presence of low latitude spots implies that distributed dynamo activity is also present. This possibility has been investigated by Brandenburg (2005) from a theoretical perspective in light of helioseismology findings. The first images of early-M dwarfs revealed that spots are distributed relatively uniformly in longitude and latitude (Barnes & Collier Cameron, 2001; Barnes et al., 2004), with no evidence for the strong polar spots seen in earlier spectral types.
| Star | SpT | Vmag | Exp | S/N | S/N | Number of spectra |
|---|---|---|---|---|---|---|
| [s] | (extracted) | (deconvolved) | observed / used | |||
| GJ 791.2A (HU Del) | M4.5V | 13.13 | 180 | 56 6 | 3120 316 | 163 / 163 |
| GJ 65A (BL Cet) | M5.5V | 12.7 | 180 | 105 10 | 5970 528 | 178 / 178 |
| GJ 65B (UV Cet) | M6V | 13.2 | 180 | 91 10 | 5076 526 | 178 / 154 |
As stars become fully convective, at spectral type M3.5V, distributed dynamo activity is expected to be the sole mechanism by which magnetic fields can be generated and sustained. Brightness images of only three fully convective mid-M stars have been published: V374 Peg (Morin et al., 2008a) and G 164-31 (Phan-Bao et al., 2009) are both M4V stars, while GJ 791.2A (HU Del) is an M4.5V star (Barnes et al. 2015; hereafter B15). V374 Peg reveals weak spots at intermediate latitudes. Little coherence of spot patterns was seen from observations made a night apart, though the moderate S/N ratio and phase coverage may have contributed to a lack of consistency between the image reconstructions. In contrast to V374 Peg, G 164-31 revealed only polar filling, but no low or intermediate spots, despite observations with good S/N ratio. A map of GJ 791.2A resolved numerous spots with high latitude circumpolar structure, and spots concentrated at low-latitudes and distributed at all phases or longitudes. Two-temperature modelling was used by B15, requiring low contrast spots with - = 300 K (derived from model atmospheres). B15 also interpreted line profile variations in the late-M star, LP 944-20 (M9V), as cool spots and recovered only high latitude spots using low spot/photosphere contrasts of - = 100 - 200 K, confirming the earlier trend of decreasing spot contrast with decreasing photospheric temperature noted by Berdyugina (2005).
Despite the expectation of distributed dynamo activity, Zeeman broadening of absorption lines using unpolarised spectra has been used to infer large magnetic fields of 2 - 4 kG (Saar & Linsky 1985; Johns-Krull & Valenti 1996) on M3.5 and M4.5V stars. The large scale magnetic field topology of stars can be studied in more detail using polarised Stokes V time series observations. Large scale fields with preferentially toroidal and non-axisymmetric poloidal configurations are found in the case of M0V - M3V stars (Donati et al., 2008), while axisymmetric large-scale poloidal fields are found at the M4V fully convective boundary (Morin et al., 2008b). For M5 - M8V stars, firmly in the fully convective regime, some stars exhibit strongly axisymmetric dipolar fields while others show weak fields with a significant non-axisymmetric component (Morin et al., 2010). Simulations by Gastine et al. (2012) have subsequently found a bifurcation of the magnetic field geometry. This was investigated in the context of M dwarfs by Gastine et al. (2013), who found that the dynamo bistability is most pronounced for stars with small Rosby numbers, resulting in either a dipolar field or multipolar field configuration. Stronger magnetic fields lead to dipolar field geometry while weaker magnetic fields give rise to multipolar geometry. Although they show different starspot patterns in their brightness images, G 164-31 and V374 Peg both show axisymmetric dipolar magnetic fields with one polarity predominantly in the polar region. On the other hand, the almost identical components of GJ 65, reveal magnetic field structure that is axisymmetric in the case of GJ 65B (M6V) and non-axisymmetric for GJ 65A (M5.5V) modes.
Differential rotation arises as a result of convection in the presence of rotation (due to Coriolis forces). Convection zone depth and stellar rotation rate might thus be considered important parameters governing its magnitude. Following the first measurement of differential rotation using Doppler images from closely separated epochs (Donati et al., 1997), a parameterised solar-like differential rotation model was incorporated directly into the line modelling and image recovery process by Petit et al. (2002) and subsequently by Barnes et al. (2005). Reiners & Schmitt (2003) also used Fourier transform techniques to study absorption line profile morphology and found that F dwarfs possess even higher degrees of differential rotation than G dwarfs. Subsequent work, specifically on G and K dwarf stars, by a number of authors using Doppler imaging methods (Jeffers et al. 2007; Marsden et al. 2006b and Marsden et al. 2011) have added to the sample of stars with differential rotation measurements. While F and G stars with a relatively small convection zone were found to exhibit the strongest differential rotation, by early M spectral type, the differential rotation was consistent with solid body rotation (i.e. no latitude dependent rotation) within the measurement uncertainties (Barnes et al., 2004; Barnes et al., 2005). Further measurements of differential rotation on M dwarfs using the sheared image technique have also been made by Donati et al. (2008) who find significant differential rotation for early-M dwarfs (contrary to the results reported by Barnes et al. 2005) and by Morin et al. (2008b) who find differential rotation rates for mid-M dwarfs that are typically ten times smaller.
The variation in differential rotation with spectral type and rotation rate has also been modelled using mean field hydrodynamics by Küker & Rüdiger (2011) and Kitchatinov & Olemskoy (2012). Browning (2008) found that magnetic fields strongly quench the differential rotation. Gastine et al. (2013) predict that stars in the dipolar field branch should yield very weak differential rotation, while multipolar field configurations might in fact allow significant differential rotation. Yadav et al. (2015) similarly investigated a fully convective stellar model with differential rotation reduced by a strong magnetic dipolar field orientated with the rotation axis. Thus while significant non-solid body rotation is possible in fully convective stars, those stars that are more rapid rotators (with smaller Rosby numbers) and therefore more magnetically active, are likely to exhibit the lowest differential rotation rates.
Here we present Doppler images of three fully convective stars, including new brightness maps of GJ 791.2A following our image derived a year earlier (B15). While GJ 791.2A and GJ 65A, both show similar starspot patterns, our image of GJ 65B shows shows a markedly different spot distribution and a greater degree of spot filling. A brief introduction to the individual targets is presented in §2 followed by a description in §3 of the observations and techniques used to derive the Doppler images. Images and differential rotation measurements are presented in §4 with further discussion and concluding remarks in §5.
2 Targets
The three targets in this study are nearby, bright, fully convective M4.5 - M6 dwarfs, with (Table 1). They are relatively young and exhibit rapid rotation, making them suitable objects for brightness Doppler imaging.
2.1 GJ 791.2A
GJ 791.2AB is a nearby unresolved astrometric binary with apparent magnitudes of and (Hosey et al., 2015). Based on kinematics, Montes et al. (2001) do not consider it to be a member of the 0.6 Gyr Hyades Supercluster. More recently, Benedict et al. (2016) find that the components lie close to the 0.1 Gyr model of Baraffe et al. (2015). The astrometric orbit of the unresolved GJ 791.2AB system determined by Benedict et al. (2000) has been re-analysed by Benedict et al. 2016 who find an orbit with d. GJ 791.2B is 3.27 magnitudes fainter (20.3 times smaller flux) in the V-band, though as in B15, we do not see the secondary component in the photospheric absorption lines. The Benedict et al. 2016 respective component masses for GJ 791.2A and GJ 791.2B of and are slightly lower than the earlier Benedict et al. 2000 estimates. B15 found a rotation period of d and obtained Doppler images revealing numerous low contrast spots. Despite exhibiting significant activity, Hosey et al. (2015) find only 8.2 mmag variability in the band (from 148 observations spanning 30 nights over a 7.25 yr time span), in common with other targets of similar spectral type, as might be expected from a star with low contrast spots distributed across its surface (B15).
2.2 GJ 65A and GJ 65B
GJ 65 (Luyten 726-8) was first reported as a new binary with a large proper motion by Luyten (1949) who also identified flaring activity on the fainter component, GJ 65B (UV Cet). Subsequent flaring activity was reported by a number of authors, while Bopp & Moffett (1973) considered that since both components, GJ 65A (BL Ceti) and GJ 65B are of similar spectral type (M5.5V and M6V respectively), they should both be treated as flare stars. Photometry and spectroscopy by Bopp & Moffett (1973) enabled detailed study of flaring events on the unresolved pair. UV Cet has become the class prototype of stars that undergo rapid photometric brightening due to dramatic flaring activity.
GJ 65 is a visual binary, which at a distance of only 2.68 pc (Henry et al., 1997)111http://recons.org is the 6th closest stellar system to the Sun, with unresolved magnitudes of (Zacharias et al., 2012) and (DENIS Consortium, 2003). Mason et al. (2001) give respective magnitudes for GJ 65A and GJ 65B of V = 12.70 and 13.20. Montes et al. (2001) found that GJ 65 is a possible member of the 600 Myr Hyades supercluster moving group. More recently, Kervella et al. (2016) discussed the age and population membership of GJ 65 in detail, showing it to be consistent with a 200 - 300 Myr old thin disk system. Benedict et al. (2016) find and . These masses are in agreement with those given by Kervella et al. (2016) who also give respective projected rotation velocities of sin = km s-1 and km s-1. The binary orbital period of yrs (Kervella et al., 2016) implies a semi-major axis of 5.5 AU, while the astrometric eccentricity, . Because the orbital separation is large compared with the stellar radii, tidal effects will be small and they are unlikely to undergo the increased activity levels commonly observed in RS CVn binaries. The projected separation of GJ 65A and GJ 65B in 2015 September was 2.18 arcsec, close to the maximum separation of 2.19 arcsec. Magnetic maps of both GJ 65A and GJ 65B have been derived by Kochukhov & Lavail (2017), who find different global magnetic field topologies.
| Star | sin | P | ||
|---|---|---|---|---|
| [degs] | [km s-1 ] | [d] | [rad d-1] | |
| GJ 791.2A (HU Del) | ||||
| GJ 65A (BL Cet) | ||||
| GJ 65B (UV Cet) |
3 Observations and Analysis methods
GJ 791.2A, GJ 65A and GJ 65B were observed on the nights of 2015 September 25/26 and 28/29 at the Very Large Telescope (vlt) with the Ultraviolet and Visual Échelle Spectrograph (uves)222ESO programme 095.D-0291(A). The observations were made with a 0.4 arcsec slit in the red-optical (R ), with a spectral range of 0.6447 µm - 1.0252 µm. GJ 791.2A was observed on the first half of each night, while the second half was dedicated to observations of the GJ 65AB binary system. With the 2.18 arcsec separation in 2015 September, GJ 65A and GJ 65B were observed simultaneously by placing both targets on the slit. Favourable seeing conditions throughout the two nights, with typically arcsec seeing, resulted in good spatial separation of the spectral profiles. During extraction, each observation was checked individually to ensure that the spatial extent of the two profiles were appropriately defined to avoid cross-contamination. The spectra were extracted using optimal extraction (Horne, 1986) with the Starlink package, echomop (Mills et al., 2014). A total of 86 and 77 spectra of GJ 791.2A were obtained on each respective night using 180 sec exposures. For GJ 65A and GJ 65B, 91 and 87 spectra with 180 sec exposures were obtained.
|
|
|
|---|---|---|
 |
 |
 |
 |
 |
3.1 Least squares deconvolution
Least squares deconvolution was applied to each spectrum to derive a single line profile from the several thousand absorption transitions. Our implementation of the procedure (Barnes et al., 1998), first described in Donati et al. (1997), was applied to M dwarf spectra using empirically derived line lists in Barnes et al. (2012). The line lists were derived from observations of GJ 105B (M4.5V) (B15) and sec observations of the slowly rotating star, GJ 1061 (M5.5V), made on 2015 September 25 and 28. In B15, we used the same procedure to derive time series spectra and perform Doppler imaging of GJ 791.2A and the M9 dwarf LP 944-20. It is important to exclude lines that do not arise in the photosphere; specifically telluric bands and those lines with a strong chromospheric contribution, including H, He i, the infrared Na i lines and Ca ii triplet are removed before deconvolution is carried out. Any photospheric lines adjacent to these chromospheric lines that fall within the velocity range over which deconvolution is performed are also excluded. This procedure is particularly important in active M dwarfs where large chromospheric emission variability is seen during flaring events. At the start of observations, GJ 65B was undergoing a strong flaring event. The deconvolved line shapes were strongly distorted, becoming asymmetric with increased equivalent width, necessitating that the first 24 spectra be excluded in the subsequent imaging procedure. A weaker flare was also seen on GJ 791.2A at the end of the first night and which can be seen as a continuum tilt in the deconvolved time series spectra. We retained the affected spectra and corrected the continuum tilt. Table 1 summarises the observations: the input S/N ratios over the range used for deconvolution and the effective S/N of the mean deconvolved profiles are listed, indicating effective gains in S/N of 56 - 57 compared with a single line.
3.2 Doppler imaging fully convective stars with a two-temperature model
As with stars with higher , and the fully convective stars in B15, we have assumed that a two-temperature model can adequately describe the temperature inhomogeneities on active stars. We applied the two-temperature, maximum-entropy regularised imaging algorithm, DoTS (Collier Cameron, 2001) to recover Doppler images of our targets. DoTS uses a spot filling factor, (taking values in the range 0.0 - 1.0), for each image pixel, . Since the absorption lines present in the spectra of mid-late M stars are dominated by molecular transitions, we investigated the behaviour of the line intensities and equivalent widths in B15. Synthetic spectra were computed using the BT-Settl model atmospheres of Allard et al. (2012) with the WITA code (Gadun & Pavlenko, 1997) which uses opacity sources listed in Pavlenko et al. (2007); see also Pavlenko (2014) and Pavlenko & Schmidt (2015). To determine intensity ratios and centre-to-limb variations in the continua and line equivalent widths for the appropriate effective temperatures, the model spectra, calculated for different limb angles, were interpolated onto the observed wavelengths and multiplied by the blaze function. Deconvolution was then performed in exactly the same way as for the observed spectra. Since the synthetic spectra are not a perfect match to the observed spectra of each of our targets, we used appropriate line lists derived from the synthetic spectra. Here we applied the same procedure to GJ 65A and GJ 65B as that described more fully in B15. In addition, the local intensity profile used for Doppler imaging was derived from the same slowly rotating stars, GJ 105B and GJ 1061, from which we derived the empirical line lists.
4 Results
We find optimal fitting parameters, including axial inclination, , rotation period, , equatorial rotation velocity, sin , and differential rotation shear, (§4.5) by minimising using a fixed number of iterations (Barnes et al., 2001). A summary of properties for each target derived from Doppler imaging are given in Table 2.
|
|
|
|---|---|---|
 |
 |
 |
 |
 |
 |
 |
 |
 |
4.1 GJ 791.2A (HU Del) - 2015 September 25 and 28
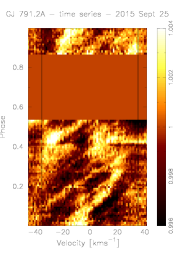
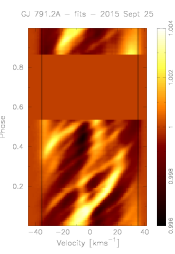
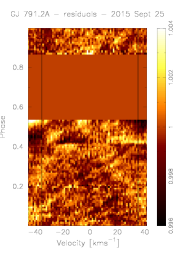
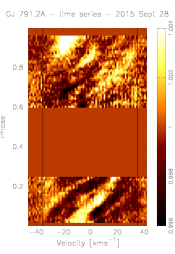
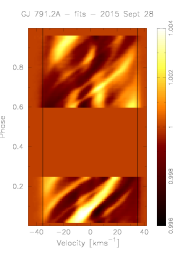
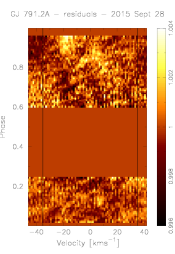
Our 2015 September 25 and 28 observations comprised better phase overlap than our prior 2014 September 3 and 6 observations, which were the basis of the work presented in B15. Since the 2014 observations were curtailed on the first night by weather constraints, we have re-derived the system parameters for GJ 791.2A. In B15, phase overlap during the two nights of observations was limited to a narrow range of from which we found d, sin = km s-1 and . With phase overlap of 0.336 for 2015 September 25 and 28, we find d and sin = km s-1. An axial inclination of is found, indicating results in good agreement with our initial estimates. The phased time series spectra after subtraction of the mean profile are shown in Fig. 1 (left panel) and reveal starspot features as white trails. Individual trails show different widths and gradients suggesting starspots or starspot groups of differing sizes at a range of stellar latitudes. The fits to the time series made separately for September 25 and September 28 are shown in the middle panels of Fig. 1. The residuals are plotted in the right hand panels and indicate the time series are fitted well. Some low level residual features remain and are still not fitted if we modify the full width of the local intensity profile for imaging. It is likely that imperfect fitting arises because the model does not account for bright chromospheric plage or intergranular faculae in the photosphere that may be associated with the starspots and which may additionally evolve on shorter timescales (De Pontieu et al., 2006). A linear correction using the continuum regions was applied to the final 15 flare-affected observations on September 25, which caused the blue wing of the deconvolved profiles to appear depressed.
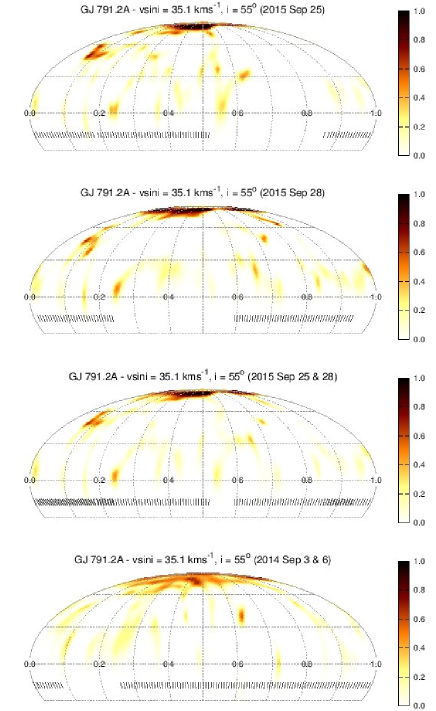
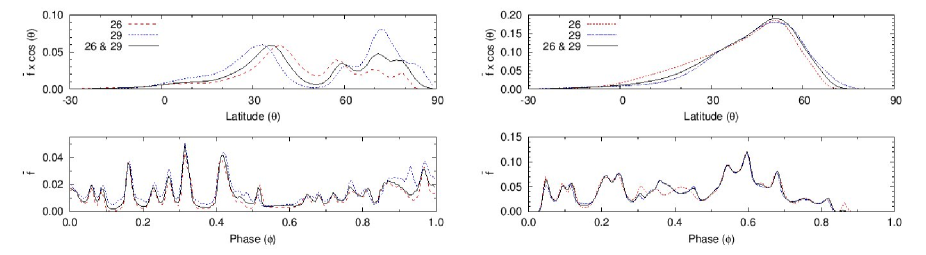
The deviations from the mean line profile caused by the spots have sufficient amplitude that between the spotted and unspotted regions is required to fit the line profiles. This enables images with spot filling factors of to be recovered. For K and K, the continuum intensity contrast at disc centre at the mean wavelength of the deconvolved line profiles is / . In the reconstructions for individual nights and the combined image in Fig. 2 (top and right panels), the greatest degree of spot filling is found in the circumpolar spot structure with maximum spot filling of (98 per cent) on September 25. Spots with typically possess spot filling factors of , while for spot filling factors are . The bottom panels of Fig. 2 show that the mean latitudinal filling at low and intermediate latitudes is half that at circumpolar latitudes. The spot filling has been area-corrected by multiplying by cos() so that a spot of fixed radius yields the same spot filling at all latitudes. Without the cos() area correction, the spot filling is an order of magnitude higher in the circumpolar region. The individual and combined reconstructions show that spots appear to be located at a range of latitudes and longitudes. The individual maps were reconstructed using the combined September 25 and 28 map as a starting image. This minimises the differences between images where there is no phase coverage and hence a weak constraint on the image. There appears to be some spot evolution where observation phases are common to both September 25 and September 28; for example the spot group centred on and has changed morphology. A mean spot filling factor of (2.3 per cent) is found for the combined image, while the 0.860 - 1.000 and 0.000 - 0.232 phase range common to the individual images yield mean respective spot filling factors for September 25 and September 28 of and .
4.2 GJ 791.2A - 2014 September 3 and 6 re-analysis
Since the improved phase overlap during the 2015 observations affords a more reliable estimate of rotation period and system parameters, we have re-derived the image for 2014 September 3 and 6 using the new parameters. The image is shown in Fig. 2 (left panel) where we have used the same spot temperature as for the 2015 reconstruction to enable a direct comparison of the two sets of images. In B15, we found that the data required K (/ ) to enable the spot features to be fit. This implies weaker spots were present in 2014; adopting the larger K that we require for the 2015 image will thus result in smaller spot filling fractions. The new image in Fig. 2 is broadly the same as the B15 image reconstruction, since the system parameters are almost identical. As expected, the mean and maximum spot filling factors are lower, with and (c.f. and for the optimised image in Fig. 7 of B15 with K). The latitude distribution of spots at both epochs are very similar, particularly at low and intermediate latitudes, although the polar and circumpolar spot structures are stronger but less extensive in 2016.
 |
 |
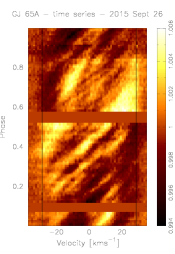
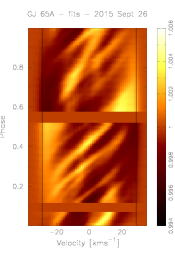
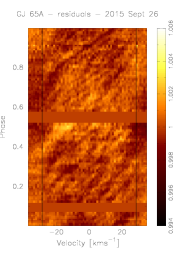
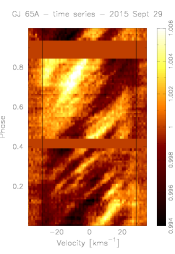
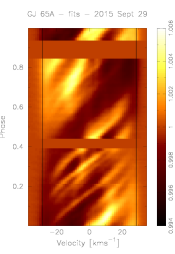
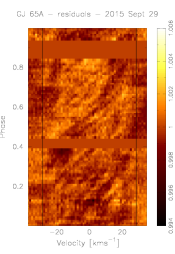
4.3 GJ 65A (BL Cet)
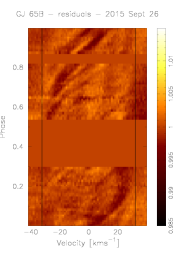
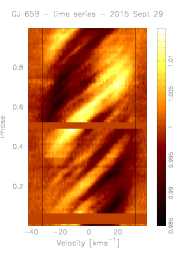
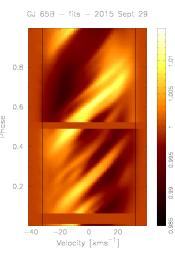
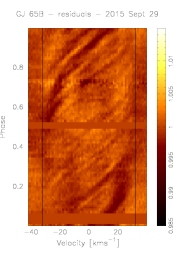
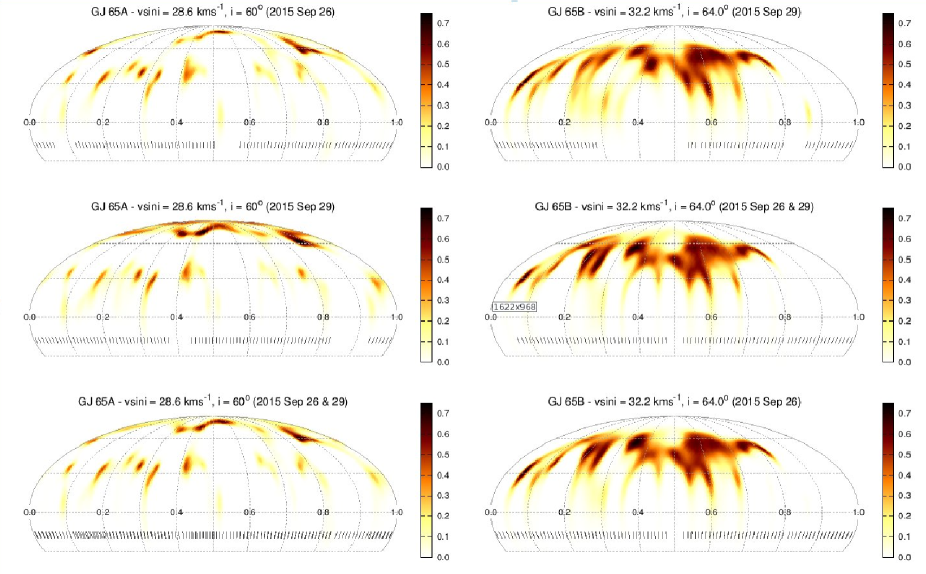
We derived stellar images using synthetic spectra with K and K (/ ). This enables a direct comparison with GJ 65B, although we find that K (/ ) also enables the spectra of GJ 65A to be fit with spot filling factors such that in all image pixels. We find best fit parameters for GJ 65A of sin = km s-1, d (5.83 hrs; see §4.5) and . The mean profile subtracted time series spectra, fits and residuals are shown in the upper two rows of Fig. 3. We have used the same reference epoch (HJD0 = 2456556.9332) as (Kochukhov & Lavail, 2017) who have recently published Zeeman Doppler images of GJ 65A and GJ 65B from polarimetric Stokes V observations made on 2013 September 21 and 24. We compare our maps with their findings in §5. The time series for the individual nights are similar, indicating that the same starspot features are persist on the 3 day timescale ( stellar rotations) of the observations. There is nevertheless indication of evolution in some of the features. The time series model fits and residuals shown in Fig. 3 indicate good fits though there are some residuals above the noise. For the individual and combined nights, the respective reduced = and . Fig. 4 (left panels) show the images for GJ 65A derived for the individual nights of September 26 and September 29 and also the image using data from both nights combined. Mean and maximum spot filling of and are found with spots located predominantly in a band centred at latitude - . Higher latitude spots from ° to are also found in the form of 2-3 larger spots or unresolved spot groups. There is some evidence of spot evolution between the two nights with a higher degree of polar spot filling on September 29, including additional spot structure. Otherwise the image reconstructions on September 26 and 29 are remarkably similar. Although high latitude spot structure is recovered no symmetric polar spot is seen.
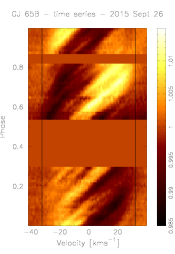
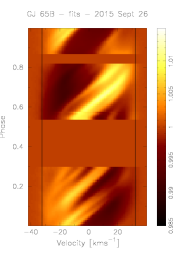
4.4 GJ 65B (UV Cet)
The best fit parameters for GJ 65B are sin = km s-1, d (5.44 hrs) and . As with GJ 65A, we used input models with K and K. The mean profile subtracted time series spectra, fits and residuals are shown in the lower two rows of Fig. 3. The starspot trails appear wider and more pronounced than those on GJ 65A (note colour scale), leading us to expect larger spots with greater contrast. The spot patterns are also consistent, with apparently little evolution between September 26 and 29. The residual fitted time series show that the features are well modelled, although again residuals are seen after subtracting the fits, likely due to associated facular contributions that we do not model. Mean and maximum spot filling of and are found. For the individual and combined nights, we find and . The images in Fig. 4 (right panels) reveal a contrast with GJ 65A, with particularly strong filling centred at mid-latitudes (). There is a distinct lack of polar or circumpolar spot structure above . Although large spot features appear at most phases, there is a notable lack of spots at and (i.e. for 0.21 of the phase or 76) despite good phase coverage on both nights. The starspot pattern on GJ 65B is stable on the 3 night time scale of the observations, with little apparent evolution of spots after 13 stellar rotations.
 |
 |
 |
 |
|
|
4.5 Differential rotation estimation
4.5.1 Solar-like differential rotation via the sheared image method
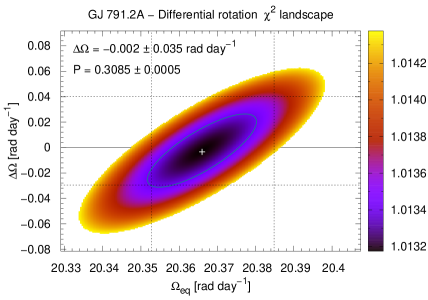
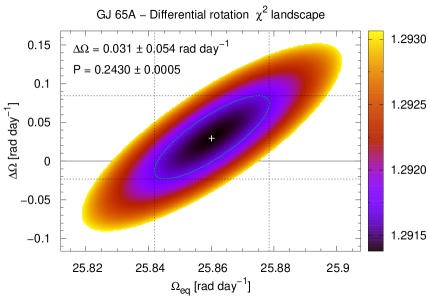
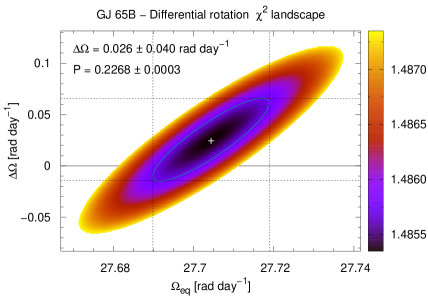
The persistence of spot features in the time series spectra and Doppler images enables us to estimate the latitude dependent rotation using the sheared image method (Petit et al., 2002). We model the star as a differentially rotating body with a simple solar-like latitude dependence for the rotation
| (1) |
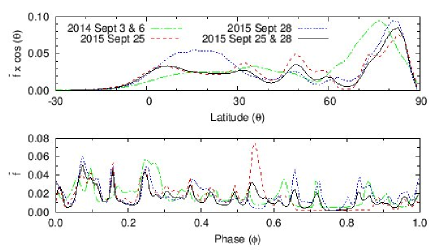
where is the stellar latitude, is the equatorial rotation rate ( ), and is the magnitude of the shear. The results of fitting for latitude dependent rotation are shown for each star in Fig. 5, where is plotted for vs . All three stars reveal small positive differential rotation, which is consistent with solid body rotation within the uncertainties. The results are discussed further in §5 in the context of other measurements and theoretical predictions.
4.5.2 Departure from solar-like differential rotation?
A recent publication by Brun et al. (2017) investigated the large scale flows in the convective envelopes of late-type stars as a function of rotation rate. Stars with small Rosby numbers (e.g. with rotation ) show cylindrical angular rotation velocity profiles throughout the convection zone resulting in alternating zonal jets, where prograde and retorgrade flows are seen at the surface. The models of Brun et al. are for stars with a radiative core and convective envelope, and do not investigate the rotation rates of our targets which are two orders of magnitude greater than solar.
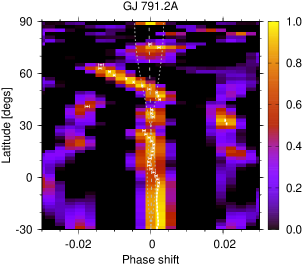
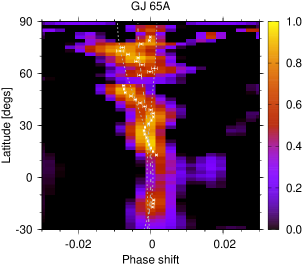
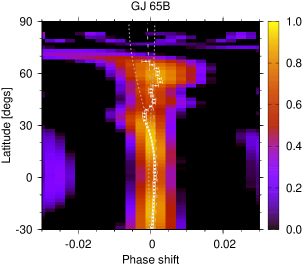
To search for any departure from solar-like differential rotation for GJ 791.2A, GJ 65A and GJ 65B, we performed cross-correlation of each latitude using the September 25 and September 28 Doppler images. This procedure is similar to the method first used to identify differential rotation in the K dwarf AB Dor (Donati et al., 1997) and Cluster G dwarfs (Barnes et al., 1998). Cross-correlation enables evolution of features and those features that trace any latitude dependent rotation to be assessed. We used a modified version of the hcross algorithm of Heavens (1993) to perform the cross-correlation (see Barnes et al. 2012). hcross is part of the STARLINK package, figaro (Shortridge, 1993); now maintained by East Asian Observatory333http://starlink.eao.hawaii.edu. The results are shown in Fig. 6. Globally, there appears to be reasonable agreement between the sheared image (assumed solar-like differential rotation) and the cross-correlation methods. For GJ 791.2A, the overlapping phase range used for the cross-correlation was and , while the complete phase range was used for GJ 65A and GJ 65B. The white filled circles and horizontal bars denote the cross-correlation maxima and estimated uncertainties. The grey dashed curves show the differential rotation derived using Equation 1 via the sheared image method. The dotted grey curves show uncertainties in the sheared image differential rotation values. Cross-correlation of individual latitudes appears to show significant deviation from the solar-like differential rotation, but is not consistent between all three stars. For GJ 791.2A, the phase coverage is smaller, with fewer features to obtain reliable cross-correlation. The apparent strong shearing at , appears to be due to evolution of the spot group at phase (see Fig. 2), rather than rotational shearing of persistent spots. For GJ 65A, the lack of strong features at low latitudes results in cross-correlation peaks at larger phase shifts (). Hence the peak cross-correlations and uncertainties are not shown for latitudes . Correlated deviations over several latitudes in the cross-correlation peaks for GJ 65A and GJ 65B are of amplitude (3.6). Despite the relatively small formal errors from hcross, these deviations are somewhat smaller than the equatorial resolutions of to reported in §5. Without repeated observations it is not possible to discern whether shearing due to persistent zonal flows is present or whether evolution of spot features masks such an effect.
Under the assumption that a differential rotation law can be incorporated into the model to which we fit the data, the magnitude of the shear should be more reliable than simple cross-correlation of constant latitude bands (see below) since all observations (i.e. on both nights in this instance) are modelled simultaneously. Although we can’t rule out deviation from a solar-like law, for consistency with previous studies, we restrict further discussion in §5 to the solar-like differential rotation measured using the sheared image method.
5 Discussion
We have reconstructed the starspot distributions on three fully convective stars: GJ 65A (M5.5V), GJ 65 B (M6V) and GJ 791.2A (M 4.5V). These observations were secured with the vlt and have an unprecedented equatorial resolution of , bringing the total number of fully convective stars with surface brightness distributions to six. The surprising result is that the two components of the binary system, GJ 65, have very different starspot distributions, despite having near-equal rotation and near-equal mass. GJ 65A shows high latitude and circumpolar spot coverage, while in contrast, GJ 65B shows large spots at intermediate latitudes. The third star, GJ 791.2A, shows similar spot coverage to an image made a year earlier (B15) and with a spot distribution similar to that reconstructed for GJ 65A.
We are able to achieve unprecedented resolutions of 8.3, 10.1 and 9.0 at the equator of the three fully convective stars, GJ 791.2A, GJ 65A and GJ 65B, for the first time. The Doppler images reveal that numerous spots are distributed across their surfaces, exhibiting similarities, with spots located at low-intermediate latitudes. GJ 65B shows spots or spot groups confined only to mid-latitudes with a higher degree of spot filling compared with GJ 65A and larger spot sizes compared with both GJ 791.2A and GJ 65A.
5.1 Spot filling
We have investigated the issue of spot filling on GJ 65B by modifying the spot temperature. Spot filling is expected to increase when using a two-temperature model with smaller contrasts (i.e. larger values of /). For low contrasts, the spot areas may also increase as DoTS attempts to fit the line distortions with lower contrast spots by increasing their size. With a higher contrast of = 500 K (/ ), we find that the is only marginally improved, by 3 per cent, over our adopted = 400 K (/ ). The images of GJ 65B look essentially the same for K and K. Similarly, with an arbitrary setting of / , the images are not changed significantly in appearance. Hence the difference in spot area sizes between GJ 65A and GJ 65B appears to be real and not a consequence of inappropriate choice of /. GJ 791.2A closely resembles GJ 65A, but exhibits a greater degree of circumpolar spot structure. The structure appears to be slightly less complex in the 2015 images compared with the 2014 image where all spots show more uniform filling factors.
5.2 System parameters and radii
Using our estimate of the axial inclination and period of GJ 65A and GJ 65B implies respective radii of and . The estimates are in good agreement with the and estimates by Kervella et al. (2016) from astrometric and parallax measurements. and sin , are generally well constrained parameters, but our estimates of , which contribute the dominant source of uncertainty in radius measurements (hence the likely reason for a larger radius estimate for GJ 65B), seem to be robust. Kervella et al. (2016) suggest that the large radii are consistent with youth and further inflated by strong magnetic fields (Chabrier et al., 2007; Feiden & Chaboyer, 2012). We discussed the radius and probable few hundred Myr age of GJ 791.2A in B15. Our system parameters for GJ 791.2A are in agreement with the previous estimates in B15 and now imply .
5.3 Comparison with models and magnetic field observations
Although we only recover surface brightness images, with no information about magnetic field strength, the strongest magnetic fields on stars with convective envelopes are expected in the recovered spots. It is thus reasonable to expect that spots act as tracers of dynamo activity, and to ask whether different spot patterns can be explained by different dynamo modes, or cyclic behaviour. Simulations by Gastine et al. (2013) find a dynamo bistability occurring in more rapidly rotating fully convective stars (i.e. with low Rossby numbers). The two dynamo modes suggest either dipolar or multipolar field configurations while Yadav et al. (2015) find that the axisymmetric dipolar mode is stable and dominant. The simulations by Yadav et al. (2015) also show heat flux maps, which offer the opportunity for comparison with our observations. Their simulations reveal stronger spots at high latitudes in the axisymmetric dipolar mode and are qualitatively in agreement with our images of GJ 65A, GJ 791.2A and potentially the image of LP 944-20 (M9V) presented in B15.
Our finding of higher spot filling factors and larger spots on GJ 65B compared with GJ 65A appears consistent with the stronger mean field strength found on GJ 65B by Kochukhov & Lavail (2017). However their observations suggest a strongly dipolar field for GJ 65B and more complex field for GJ 65A. The contrasting spot patterns may represent different parts of a magnetic cycle (Kitchatinov et al., 2014), although Shulyak et al. (2015) note that oscillating modes may only be identified by monitoring of individual M dwarfs on time scales of years. The simulated stability of the axisymmetric dipolar mode and the observation of consistently different radio behaviour in the GJ 65 components noted by Kochukhov & Lavail (2017) suggest that any cyclical behaviour must occur on timescales greater than 30 years.
There is some indication of phase alignment between our brightness images and the Stokes V radial field images derived from observations two years earlier by Kochukhov & Lavail (2017). While this may tentatively suggest long term stability of the dynamo, it is not clear that the spot geometry and magnetic field reconstructions offer a fully consistent picture. Specifically, the brightness images of GJ 65B show only spots at mid latitudes. No spot structure at high latitudes or near the poles is seen, unlike the Stokes V images, and also where the models suggest the strongest magnetic flux should appear in the axisymmetric dipolar field mode. Since our reconstructions require / (see §4.3, 4.4 & Fig. 4), the contribution towards Stokes V from the spot regions will be small compared with the polar regions. Hence the Stokes V images are mainly sensitive to the less spotted photosphere regions at the spot edges, latitudes above , and at the phases where no spots are recovered. Morin et al. (2008a) similarly found no polar spot, but low-intermediate latitude spots only in brightness images of the M4V star, V347 Peg, though the spots are somewhat weaker than seen here for GJ 65B. The accompanying Stokes V images revealed a strong axisymmetric, large scale poloidal field. The magnetic maps may thus not be offering a true picture of the magnetic field geometry, despite appearing to confirm model predictions. Unbiased observation of the magnetic polarity via Stokes V in both unspotted and spotted regions would be desirable and may soon be realised at near infrared wavelengths with upcoming instrumentation (Artigau et al., 2014; Lockhart et al., 2014) where photosphere-spot contrasts are expected to be lower.
The magnetic field phase variability seen in Stokes I GJ 65B by Kochukhov & Lavail (2017) is likely to arise the phase dependent mean spot filling effects we find in Fig. 4 (bottom right panel), where with maximum amplitude variability, . We also note that for GJ 65A, Kochukhov & Lavail (2017) do not see variability in Stokes I. Similarly, from Fig. 4 (bottom left panel) we find the phase dependent modulation in GJ 65A is less than seen in GJ 65B where , with maximum amplitude variability, (i.e. 3 times smaller absolute variability and 2.6 times smaller maximum amplitude spot filling variability). For GJ 791.2A (Fig. 2, lower panel), and (2014 September 03 and 06) and and (2015 September 25 and 28). In this respect, GJ 791.2A more closely resembles GJ 65A, although the modulation is stronger (a factor of 2.3 times smaller compared with GJ 65B). We are investigating red optical lines that are particularly sensitive to Zeeman-broadening (Shulyak et al., In prep), and which offer the best change of measuring magnetic field strength modulation due to stellar rotation. This will enable a higher cadence comparison with our targets than the study by Kochukhov & Lavail (2017), with the added benefit of affording a direct, simultaneous comparison with our images.
5.4 Differential rotation
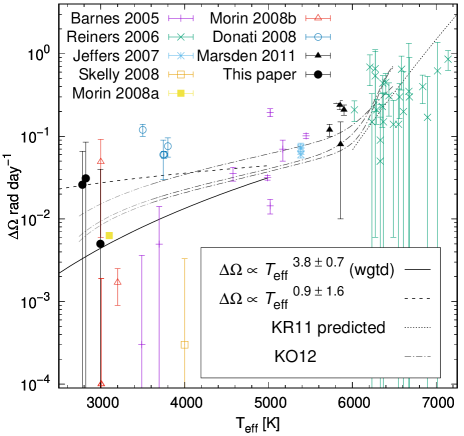
In Fig. 7, we plot against for GJ 791.2A, GJ 65A and GJ 65B along with the measurements made spectroscopically for all F, G, K and M dwarfs. Estimates of for LQ Lup and R58 that we used in Barnes et al. (2005) have been replaced by those from Marsden et al. (2011). Following Collier Cameron (2007), we also use the AB Dor measurements made in Jeffers et al. (2007). Barnes et al. (2005) found a simple power law relationship, with . This was subsequently revisited by Reiners (2006), incorporating results for F dwarfs using Fourier analysis. Collier Cameron (2007) further revised the power law fit to include subsequent measurements, finding . Küker & Rüdiger (2011) however found it is not appropriate to fit a single power law to the entire temperature range. Their theoretically derived relationship can be split into two regions, with a weaker power law for cooler stars, with for K K, and a much stronger power law of for K. Similarly Kitchatinov & Olemskoy (2012)(KO12) derived an analytical relationship for different stellar models. We find that for K when the uncertainties on each value are used. This considerably weaker dependence compared with previous measurements is the result of relative large scatter and exclusion of higher values at K and is in closer agreement with the relationship predicted by Küker & Rüdiger (2011). A fit that excludes error weighting is also shown in Fig. 7, with . Since the points with K measured by Reiners (2006) have large uncertainties and span a relatively large range, we have plotted the prediction of Küker & Rüdiger (2011) as a dashed curve (we find ).
|
The parameterised relationships found by Kitchatinov & Olemskoy (2012) are also plotted as dash-dot curves in Fig. 7 for three different rotation rates. Curves for and d are shown. The models are only valid for d, hence the d curve should be treated with caution; however the dependence on rotation was found to be relatively weak as also found empirically by Barnes et al. 2005 and more recently by Reinhold & Gizon (2015) and Balona & Abedigamba (2016) from Kepler lightcurve studies. In addition, the curves are extrapolated below ( = 3600 K) where they are plotted in a lighter grey. We have not attempted a numerical comparison of the models since there is considerable scatter. In addition, the stars at the higher temperature end generally have longer rotation periods. The rotation periods of most of the stars in the sample are d, although for HD 141943 (Marsden et al., 2011), d and the Reiners (2006) sample possess minimum periods of d. In some cases error bars could be underestimated, while it has been shown that the degree of differential rotation for a given object can vary (Collier Cameron & Donati, 2002; Jeffers et al., 2007). This finding is factored into the multi-epoch measurements for the higher temperature stars reported by Marsden et al. (2011). The dramatic increase noted by Marsden et al. (2011) amongst early G stars is evident in the models, though the exact location of this increase may occur at lower temperature than KO12 predict.
Reinhold et al. (2013) and Reinhold & Gizon (2015) took advantage of the large number of stars and extensive Kepler lightcurves to study differential rotation from photometric periodicities. These studies find a large scatter in for a given that are likely due to systematic effects of incomplete sampling of lightcurve periodicities. The large number of observations of this type of study enable a statistical comparison with the models and are in good agreement with the predictions of Küker & Rüdiger (2011). Our revised power law is now also in much closer agreement with these studies. Further observational studies by Balona & Abedigamba (2016) using Kepler lightcurves have enabled empirical parameterisation of in terms of both and . Our targets are at the extremes and extend the range most of these studies (i.e. lower and higher rad day-1). Our spectroscopic measurements of are nevertheless in good agreement with the extrapolated findings of Balona & Abedigamba (2016) (Figs. 5 & 6) and Balona et al. (2016) (Figs. 3 & 4).
Gastine et al. (2013) and Yadav et al. (2015) find that although differential rotation is expected to be small in stars showing axisymmetric dipolar fields, significant rotation may be found in those objects that display more multipolar fields. Gastine et al. (2013) find that per cent for multipolar fields. Yadav et al. (2015) predict per cent and note that this is consistent with observations of Morin et al. (2008b). In fact the four measurements made by Morin et al. (2008a) and Morin et al. (2008b) yield and per cent (i.e. somewhat less than the 2 per cent predicted by Yadav et al. 2015). Davenport et al. (2015) finds per cent from photometric modelling of Kepler data of GJ 1243 (M4V). Similarly, for GJ 791.2A, GJ 65A and GJ 65B, we obtain respective estimates of , and per cent, an order of magnitude lower than predicted by Yadav et al. 2015. Estimates of per cent are only found amongst M dwarfs above the fully convective boundary using the sheared image method (Donati et al., 2008) and photometric analysis.
Magnetic field strengths and topologies are found to differ in M dwarfs (Morin et al., 2010) as a function of the Rosby number, . The scatter seen in differential rotation measurements for M dwarfs may be a consequence of the impact of magnetic fields on the convective turnover time, , and may go some way to explaining the spread of seen in Fig. 7. Most of the more slowly rotating M dwarf measurements by Donati et al. (2008) and Morin et al. (2008b) are also made from Stokes V imaging with spherical harmonic constraints. It has been suggested that the differential rotation measurements recovered using Stokes V profiles are often higher because the magnetic features probe a higher part of the convection zone compared with the more deeply anchored cool spots. It is unclear whether this argument applies to fully convective stars and the Stokes V measurements reported by Donati et al. (2008) and Morin et al. (2008b). Unfortunately, those stars rotate too slowly for differential rotation measurements from brightness imaging. Measurement systematics may also be important: the customary means of treating errors in Doppler imaging, using and formal errors, likely underestimates the uncertainties. The Stokes V images of these low-mass M dwarfs relies on fewer profiles and more model assumptions than results from Stokes I. Though computationally expensive, it would be useful to attempt numerical simulations using to Monte Carlo techniques to derive uncertainties for all targets in a consistent manner.
6 Concluding remarks
With this work and other pre-cursors we have taken the first step towards realising for M dwarfs a fully resolved, fully convective M dwarf with which to compare model images. The high throughput of uves operating at vlt has enabled high resolution Doppler images of the faint prototype flare star, GJ 65B (UV Cet), to be obtained for the first time. Spot patterns that contrast with its twin, GJ 65A and GJ 791.2A suggest the dynamo mechanism operating in these stars may take different forms, confirming results from magnetic imaging and modelling studies.
The clarity of signals that we have found suggests that existing optical instrumentation, such as uves, operating at high resolution also offers the means to probe much more moderately rotating M dwarfs. GJ 65A/GJ 65B analogues with more moderate rotation of sin km s-1 are expected to rotate with d periods for instance. A narrower 0.3 arcsec slit (yielding in the red arm of uves) and the reduced need for very short exposures mean that stars with I (i.e. magnitudes fainter than the targets studied in this paper) can be imaged with spectra of comparable quality. Deeper lines relative to the normalised continuum would offset the reduced S/N (assuming sec exposures) we would expect in the extracted spectra, while at sin km s-1 and , the effective spot resolution would be of what is achieved here.
Near infrared technology covering multiple orders at high resolution (Lizon et al., 2014; Artigau et al., 2014) will also enable us to investigate wavelength dependent starspot contrast effects on a fainter sample of stars. With improvements in theoretical line lists, it may also be possible to investigate individual molecular species or transition energy ranges. Infrared polarimetry will be particularly important for assessing the optical Stokes V observations, which do not enable reliable estimation of the magnetic field inside the spots we recover with brightness imaging. In addition to providing information about the underlying dynamo mechanisms, an understanding of starspot distributions on fully convective stars, which may possess significant rotation on average (with sin km s-1, Jenkins et al. 2009; Reiners et al. 2012), is needed if we are to effectively deal with radial velocity jitter in radial velocity searches for planets (Barnes et al., 2017). Both CRIRES+ and and uves will be important instruments in this respect, offering the opportunity for high resolution observations.
Acknowledgments
We would like to thank the referee, Pascal Petit, for taking the time to read the manuscript and for constructive comments that helped improve the paper. This work is based on observations collected at the European Organisation for Astronomical Research in the Southern Hemisphere under ESO programmes 093.D-0165(A) and 095.D-0291(A). J.R.B. and C.A.H. were supported by the STFC under the grant ST/L000776/1 and ST/P000584/1. S.V.J. acknowledges research funding by the Deutsche Forschungsgemeinschaft (DFG) under grant SFB 963/1, project A16. HJ was supported by grants from the Leverhulme Trust (RPG-2014-281) and the Science and Technology Facilities Council (ST/M001008/1). JSJ acknowledges funding by Fondecyt through grants 1161218 and 3110004, and partial support from CATA-Basal (PB06, Conicyt), the GEMINI-CONICYT FUND and from the Comité Mixto ESO-GOBIERNO DE CHILE.
References
- Allard et al. (2012) Allard F., Homeier D., Freytag B., Sharp C. M., 2012, in Reylé C., Charbonnel C., Schultheis M., eds, EAS Publications Series Vol. 57, EAS Publications Series. pp 3–43 (arXiv:1206.1021), doi:10.1051/eas/1257001
- Artigau et al. (2014) Artigau É., et al., 2014, in Society of Photo-Optical Instrumentation Engineers (SPIE) Conference Series. p. 15 (arXiv:1406.6992), doi:10.1117/12.2055663
- Balona & Abedigamba (2016) Balona L. A., Abedigamba O. P., 2016, MNRAS, 461, 497
- Balona et al. (2016) Balona L. A., Švanda M., Karlický M., 2016, MNRAS, 463, 1740
- Baraffe et al. (2015) Baraffe I., Homeier D., Allard F., Chabrier G., 2015, A&A, 577, A42
- Barnes & Collier Cameron (2001) Barnes J. R., Collier Cameron A., 2001, MNRAS, 326, 950
- Barnes et al. (1998) Barnes J. R., Collier Cameron A., Unruh Y. C., Donati J. F., Hussain G. A. J., 1998, MNRAS, 299, 904
- Barnes et al. (2001) Barnes J. R., Collier Cameron A., James D. J., Steeghs D., 2001, MNRAS, 326, 1057
- Barnes et al. (2004) Barnes J. R., James D. J., Cameron A. C., 2004, MNRAS, 352, 589
- Barnes et al. (2005) Barnes J. R., Cameron A. C., Donati J.-F., James D. J., Marsden S. C., Petit P., 2005, MNRAS, 357, L1
- Barnes et al. (2012) Barnes J. R., et al., 2012, MNRAS, 424, 591
- Barnes et al. (2015) Barnes J. R., Jeffers S. V., Jones H. R. A., Pavlenko Y. V., Jenkins J. S., Haswell C. A., Lohr M. E., 2015, ApJ, 812, 42 (B15)
- Barnes et al. (2017) Barnes J. R., et al., 2017, MNRAS, 466, 1733
- Benedict et al. (2000) Benedict G. F., McArthur B. E., Franz O. G., Wasserman L. H., Henry T. J., 2000, AJ, 120, 1106
- Benedict et al. (2016) Benedict G. F., et al., 2016, AJ, 152, 141
- Berdyugina (2005) Berdyugina S. V., 2005, Living Reviews in Solar Physics, 2, 8
- Bopp & Moffett (1973) Bopp B. W., Moffett T. J., 1973, ApJ, 185, 239
- Brandenburg (2005) Brandenburg A., 2005, ApJ, 625, 539
- Browning (2008) Browning M. K., 2008, ApJ, 676, 1262
- Brun et al. (2017) Brun A. S., et al., 2017, ApJ, 836, 192
- Chabrier et al. (2007) Chabrier G., Gallardo J., Baraffe I., 2007, A&A, 472, L17
- Collier Cameron (2001) Collier Cameron A., 2001, in Boffin, H. M. J. and Steeghs, D. and Cuypers, J. ed., Astrotomography - Indirect Imaging Methods in Observational Astronomy. Springer (Lecture Notes in Physics), pp 183–206
- Collier Cameron (2007) Collier Cameron A., 2007, Astronomische Nachrichten, 328, 1030
- Collier Cameron & Donati (2002) Collier Cameron A., Donati J.-F., 2002, MNRAS, 329, L23
- DENIS Consortium (2003) DENIS Consortium 2003, VizieR Online Data Catalog, 2252
- Davenport et al. (2015) Davenport J. R. A., Hebb L., Hawley S. L., 2015, ApJ, 806, 212
- De Pontieu et al. (2006) De Pontieu B., Carlsson M., Stein R., Rouppe van der Voort L., Löfdahl M., van Noort M., Nordlund Å., Scharmer G., 2006, ApJ, 646, 1405
- Donati et al. (1997) Donati J.-F., Semel M., Carter B., Rees D. E., Collier Cameron A., 1997, MNRAS, 291, 658
- Donati et al. (2008) Donati J., et al., 2008, MNRAS, 390, 545
- Feiden & Chaboyer (2012) Feiden G. A., Chaboyer B., 2012, ApJ, 757, 42
- Gadun & Pavlenko (1997) Gadun A. S., Pavlenko Y. V., 1997, A&A, 324, 281
- Gastine et al. (2012) Gastine T., Duarte L., Wicht J., 2012, A&A, 546, A19
- Gastine et al. (2013) Gastine T., Morin J., Duarte L., Reiners A., Christensen U. R., Wicht J., 2013, A&A, 549, L5
- Heavens (1993) Heavens A. F., 1993, MNRAS, 263, 735
- Henry et al. (1997) Henry T. J., Ianna P. A., Kirkpatrick J. D., Jahreiss H., 1997, AJ, 114
- Horne (1986) Horne K. D., 1986, PASP, 98, 609
- Hosey et al. (2015) Hosey A. D., Henry T. J., Jao W.-C., Dieterich S. B., Winters J. G., Lurie J. C., Riedel A. R., Subasavage J. P., 2015, AJ, 150, 6
- Jeffers et al. (2007) Jeffers S. V., Donati J.-F., Collier Cameron A., 2007, MNRAS, 375, 567
- Jenkins et al. (2009) Jenkins J. S., Ramsey L. W., Jones H. R. A., Pavlenko Y., Gallardo J., Barnes J. R., Pinfield D. J., 2009, ApJ, 704, 975
- Johns-Krull & Valenti (1996) Johns-Krull C. M., Valenti J. A., 1996, ApJ, 459, L95+
- Kervella et al. (2016) Kervella P., Mérand A., Ledoux C., Demory B.-O., Le Bouquin J.-B., 2016, A&A, 593, A127
- Kitchatinov & Olemskoy (2012) Kitchatinov L. L., Olemskoy S. V., 2012, MNRAS, 423, 3344 (KO12)
- Kitchatinov et al. (2014) Kitchatinov L. L., Moss D., Sokoloff D., 2014, MNRAS, 442, L1
- Kochukhov & Lavail (2017) Kochukhov O., Lavail A., 2017, ApJ, 835, L4
- Küker & Rüdiger (2011) Küker M., Rüdiger G., 2011, Astronomische Nachrichten, 332, 933
- Lizon et al. (2014) Lizon J. L., et al., 2014, in Ground-based and Airborne Instrumentation for Astronomy V. p. 91477S, doi:10.1117/12.2054800
- Lockhart et al. (2014) Lockhart M., et al., 2014, in Ground-based and Airborne Instrumentation for Astronomy V. p. 91478P, doi:10.1117/12.2056367
- Luyten (1949) Luyten W. J., 1949, ApJ, 109, 532
- Marsden et al. (2006a) Marsden S. C., Mengel M. W., Donati F., Carter B. D., Semel M., Petit P., 2006a, in Casini R., Lites B. W., eds, Astronomical Society of the Pacific Conference Series Vol. 358, Astronomical Society of the Pacific Conference Series. p. 401
- Marsden et al. (2006b) Marsden S. C., Donati J.-F., Semel M., Petit P., Carter B. D., 2006b, MNRAS, 370, 468
- Marsden et al. (2011) Marsden S. C., et al., 2011, MNRAS, 413, 1922
- Mason et al. (2001) Mason B. D., Wycoff G. L., Hartkopf W. I., Douglass G. G., Worley C. E., 2001, AJ, 122, 3466
- Mills et al. (2014) Mills D., Webb J., Clayton M., Gray N., 2014, ECHOMOP: Echelle data reduction package, Astrophysics Source Code Library (ascl:1405.018)
- Montes et al. (2001) Montes D., López-Santiago J., Gálvez M. C., Fernández-Figueroa M. J., De Castro E., Cornide M., 2001, MNRAS, 328, 45
- Moreno-Insertis et al. (1992) Moreno-Insertis F., Schüssler M., Ferriz-Mas A., 1992, A&A, 264, 686
- Morin et al. (2008a) Morin J., et al., 2008a, MNRAS, 384, 77
- Morin et al. (2008b) Morin J., et al., 2008b, MNRAS, 390, 567
- Morin et al. (2010) Morin J., Donati J.-F., Petit P., Delfosse X., Forveille T., Jardine M. M., 2010, MNRAS, 407, 2269
- Pavlenko (2014) Pavlenko Y. V., 2014, Astronomy Reports, 58, 825
- Pavlenko & Schmidt (2015) Pavlenko Y. V., Schmidt M., 2015, Kinematics and Physics of Celestial Bodies, 31, 90
- Pavlenko et al. (2007) Pavlenko Y. V., Jones H. R. A., Martín E. L., Guenther E., Kenworthy M. A., Zapatero Osorio M. R., 2007, MNRAS, 380, 1285
- Petit et al. (2002) Petit P., Donati J.-F., Collier Cameron A., 2002, MNRAS, 334, 374
- Phan-Bao et al. (2009) Phan-Bao N., Lim J., Donati J.-F., Johns-Krull C. M., Martín E. L., 2009, ApJ, 704, 1721
- Reiners (2006) Reiners A., 2006, A&A, 446, 267
- Reiners & Schmitt (2003) Reiners A., Schmitt J. H. M. M., 2003, A&A, 398, 647
- Reiners et al. (2012) Reiners A., Joshi N., Goldman B., 2012, AJ, 143, 93
- Reinhold & Gizon (2015) Reinhold T., Gizon L., 2015, A&A, 583, A65
- Reinhold et al. (2013) Reinhold T., Reiners A., Basri G., 2013, A&A, 560, A4
- Saar & Linsky (1985) Saar S. H., Linsky J. L., 1985, ApJ, 299, L47
- Schüssler et al. (1996) Schüssler M., Caligari P., Ferriz-Mas A., Solanki S. K., Stix M., 1996, A&A, 314, 503
- Shortridge (1993) Shortridge K., 1993, in ASP Conf. Ser. 52: Astronomical Data Analysis Software and Systems II. pp 219–+
- Shulyak et al. (2015) Shulyak D., Sokoloff D., Kitchatinov L., Moss D., 2015, MNRAS, 449, 3471
- Skelly et al. (2008) Skelly M. B., Unruh Y. C., Collier Cameron A., Barnes J. R., Donati J.-F., Lawson W. A., Carter B. D., 2008, MNRAS, 385, 708
- Strassmeier (2009) Strassmeier K. G., 2009, The Astronomy and Astrophysics Review, 17, 251
- Yadav et al. (2015) Yadav R. K., Christensen U. R., Morin J., Gastine T., Reiners A., Poppenhaeger K., Wolk S. J., 2015, ApJ, 813, L31
- Zacharias et al. (2012) Zacharias N., Finch C. T., Girard T. M., Henden A., Bartlett J. L., Monet D. G., Zacharias M. I., 2012, VizieR Online Data Catalog, 1322