Mesoscopic magnetic resonance spectroscopy with a remote spin sensor
Abstract
Quantum sensing based on nitrogen-vacancy (NV) centers in diamond has been developed as a powerful tool for microscopic magnetic resonance. However, the reported sensor-to-sample distance is limited within tens of nanometers because the signal of spin fluctuation decreases cubically with the increasing distance. Here we extend the sensing distance to tens of micrometers by detecting spin polarization rather than spin fluctuation. We detected the mesoscopic magnetic resonance spectra of polarized electrons of a pentacene-doped crystal, measured its two typical decay times and observed the optically enhanced spin polarization. This work paves the way for the NV-based mesoscopic magnetic resonance spectroscopy and imaging at ambient conditions.
I INTRODUCTION
As one of the most important techniques, magnetic resonance spectroscopy finds broad applications in chemistry, biology and material science. Nanoscale magnetic resonance based on optical detection of electron spin resonance of nitrogen-vacancy (NV) centers in diamond has recently received broad attention in the context of quantum sensing. Magnetic resonance spectroscopy with nanoscale organic samples 1 ; 2 ; wrachtrup2017science and single molecules 3 ; 4 have been realized. Until now, the majority of nanoscale experiments measured a statistical fluctuation magnetization of spins which is much stronger than the mean thermal magnetization () with a nano-detection volume under the ambient conditions with the magnetic field of several hundred gauss. However, the fluctuation signal reduces dramatically with increased distance between the NV sensor and the sample. For the mesoscale quantum sensing, e.g., cellular-sized magnetic resonance, the thermal polarization magnetization is stronger than the fluctuation. Additionally, higher polarization can be achieved via hyperpolarization approaches such as optically induced polarization op , dynamic nuclear polarization (DNP) dnp ; dnp1 ; dnp2 , and quantum-rotor-induced polarization qrip ; qrip1 . The polarization signal can be dominant once the spin polarization is reasonably high (normally, for electron spins and for nuclear spins) even for the nanoscale sensing.
Here we report a long-range sensing method by detecting of spin polarization, so that mesoscale sensing based on NV center can be realised. This spin polarization removes the power law dependence on the separation distance between the target ensemble and the NV sensor. To demonstrate the method, we detect the mean magnetic field created by optically polarized electron spins within a pentacene-doped crystal. The optically induced polarization is improved a thousandfold compared to the calculated thermal polarization at 500 G. This results in three orders of magnitude signal enhancement. With this method, we can detect the magnetic resonance spectra and measure its two typical decay times of the pentacene molecules doped in a crystal with the size of a few tens of micrometers. The long-range sensing method paves the way for mesoscopic quantum sensing in chemistry, biology and material science at ambient conditions.
II PRINCIPLE
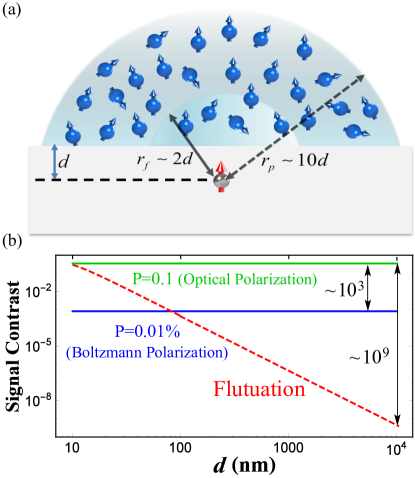
A schematic of a non-interacting spin system probed via the NV sensor is shown in Fig. 1(a). The signal being probed originates from magnetic dipolar interaction between the NV center and the sample spins.
It can be viewed as a slowly varying magnetic field in the vicinity of the NV center. Whereas the fluctuation signal (FS) governed by its variance is in proportion to the square of the dipolar interaction (i.e. ), the polarization signal (PS) governed by its mean is linear to the dipolar interaction (i.e. ). Consequently, the calculated radius of PS detection volume, , is about an order of magnitude larger than that of FS volume, . After the integration of a spherical sample volume larger than detection one, the PS is independent of the NV depth while the FS decreases cubically with increased NV depth. By projecting the magnetic field onto the NV symmetry axis, we obtain the mean magnetic field and the fluctuation one that NV can detect as shown below,
| (1) |
| (2) |
| (3) |
where is vacuum permeability, is Bohr magneton, is Landé factor of electron spin, is the spin density of the sample, and is the NV depth below the diamond surface. denotes magnetization which equals magnetic moment per volume, i.e., . is a constant and defined in Eqn. 2 with the value 9.28 Gnm3 for free electron spin.
Through interference measurement, and can be recorded into the coherence of NV sensor. Then the coherence is transformed into the population of NV center which can be directly readout by fluorescence (See the detailed descriptions in III.1). Therefore, the signal contrast (SC) is defined as the population difference of between the measurements with/without the sample. In the limit of small signal contrast, it has the following relations with and .
| (4) |
| (5) |
is the gyromagnetic ratio of NV, i.e., 2.80 MHz/G, and is the total time of interference measurement. The calculated signal contrast (SC) of PS and FS is mapped out as a function of NV depth in Fig. 1b.
III EXPERIMENTAL RESULTS AND DISCUSSION
III.1 Setup and pulse sequence description
In our experiment, we used the [111]-oriented NV center in a diamond chip, optically detected by a confocal microscope with a 532-nm laser excitation, shown in Fig. 2(a). The NV sensor was a few microns below the diamond surface. The sample for detection was a single crystal of p-terphenyl doped with pentacene-, 0.05 mol, where the long axis of the pentacene molecule was placed to align with the [111]-NV axis. The crystal thickness was 15 m. Another 520nm-laser with the beam intensity of W/m2 was applied to the crystal to optically induce the large population difference of two eigenstates which is defined as polarization, see the details below. Between the diamond and the crystal, there were a 150nm-silver layer and a 100nm-PMMA layer isolating the 532-nm and 520-nm laser beams as well as fluorescence generated from NV centers and the sample crystal. The copper wire on the top generated microwave fields to control both pentacene and NV.
The energy diagram is shown in Fig. 2(b). In our experiment, the sublevels of the triplet are not exactly the Zeeman eigenstates of external magnetic field , but a weak mixing of them, i.e., , where , and the subscript denotes the Zeeman eigenstates. See the detailed discussion in III.3.
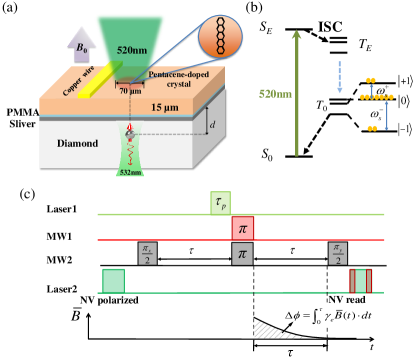
The optically induced polarization detection (OIPD) pulse sequence is shown in Fig. 2(c) and comprises the following steps. (1) The NV spin state was initialized into with a 1.5- 532-nm laser pulse. (2) By introducing a pulse the NV spin was brought into the superposition state . It recorded and generated by the sample during the following double-electron-electron resonance (DEER) pulse sequence. Synchronous with the -pulse in the DEER sequence, a 520-nm laser pulse for time was applied to generate spin polarization of pentacene, defined as the population difference of sublevels and , (after the 520nm laser pulse, ). (3) After phase accumulation, a second pulse converted this phase into a measurable population that was read out by the final laser pulse. Note that owing to fast decay of the state (7 s in the Fig. 5), laser and microwave pulses for pentacene spins can be applied before the first pulse for experimental convenience. The pulse sequence was typically repeated for two million times to accumulate sufficient statistics, ensuring that the electron PS of pentacene was probed.
During the spin echo time , the spin coherence of the NV spin revolves in the plane under the mean magnetic field , and meanwhile shortens under the fluctuation one . In the limit of small signal contrast, is mainly stored in the imaginary part of the coherence (PS) probed with two perpendicular pulses, while in the real part (FS) measured with two parallel pulses. However, FS is too small to be measured with deep NV ( for m shown in Fig.1(b)).
III.2 Magnetic resonance spectroscopy of optically polarised electron spins
We first recorded an electron spin resonance spectrum of pentacene with an NV depth of m at the field 512 G. The OIPD sequence was repeated with a sequential scan of , in which the laser irradiation time 1.5 s, spin echo time 21.6 s. Fig. 3(a) presents the results obtained from applying two different phases of the second pulse. As explained in the III.1, for pulse, a strong peak (red circle) at MHz is observed while the peak is absent for pulse.
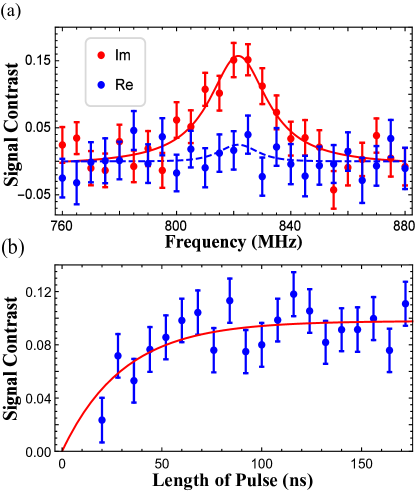
As shown in Fig. 3(b), the transition between the sublevels of and +1 of pentacene molecule was measured but no Rabi oscillation was observed. It indicates that the microwave field MW1 manipulating electron spins of pentacene is rather inhomogeneous. Besides, it can be inferred from Fig. 3(b) that the maximum mixed state of and is generated on the ensemble average after the MW1 irradiation of 80 ns in Step (2), and thus halves the magnetic field .
III.3 Energy levels of triplet states versus magnetic field
The Hamiltonian of triplet states of pentacene molecule under an external magnetic field is given by
| (6) | ||||
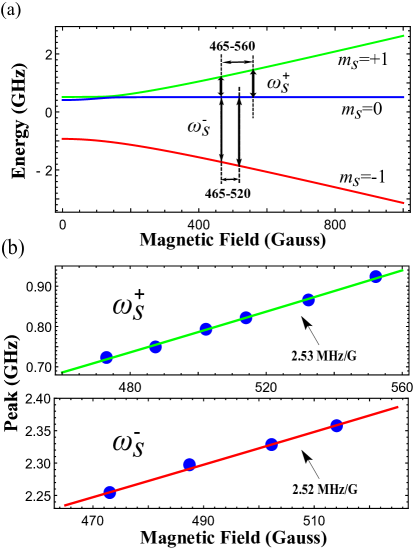
where and are the zero-field splitting (ZFS) parameters, is the gyromagnetic ratio of the spin, and is the amplitude of the magnetic field. Here we designate the molecular axes of pentacene as follows: the out-of-plane axis as the x axis, the short in-plane axis as the y axis, and the long in-plane axis as the z axis. and are the spherical coordinates of the magnetic field in the frame. A small misalignment () results from the lattice structure () Lat and the slight tilting angle caused by cutting (), and the latter dominates. According to ref. 8 , = -776.55 MHz and = -669.75 MHz (Note: the coordinate system in the ref. 8 is different from the one used here, and we need perform a rotation about y axis to obtain the parameters here). Due to the transverse component of the ZFS (non-commute with the Zeeman interaction), it associates with spin mixing of Zeeman states, and , the energy levels are curved with respect to the magnetic field, shown in Fig. 4(a). Consequently, instead of the gyromagnetic ratio of free electron, 2.80 MHz/G, the slopes of and are 2.53 MHz/G and 2.52 MHz/G in the vicinity of 500 G, respectively. As shown in Fig. 4(b), the experimental data agrees well with the calculated results, indicating that the signal originates from the pentacene molecule and not from electron contamination on the surface of or within the diamond.
III.4 Dynamical study of triplet states in pentacene molecules
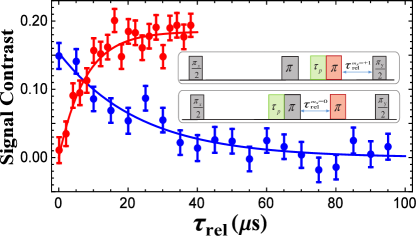
The dynamical property, such as the decay times of the pentacene manifold and , has been investigated in an adaptation to the OIPD sequence. A relaxation interval was inserted between the microwave irradiation for pentacene (MW1) and the second spin-echo pulse, as shown in the upper inset of Fig. 5. During this interval the population of could relax, which can be readily measured using the NV-based magnetic resonance. While the population of is not accessible to direct measurement, it can be detected by driving the population to state with a microwave pulse . As a result, the relaxation duration was inserted between the laser and microwave pulses, as shown in the lower inset of Fig. 5. By monitoring the amplitude of ESR peak as a function of and measurements of two typical decay times of -manifold, and , were obtained and shown in Fig. 5. Fitting to exponential curves, we obtained s and s at G which are comparable with the traditional electron spin resonance (ESR) results within a factor of three 6 ; 7 (See the detailed description in Appendix A). With the decay times of different molecular orientations, the kinetic parameters (lifetime and spin-lattice relaxation time) of the triplet sub-levels can be studied in a prescribed way 6 .
III.5 Polarization measurement
The polarization is an important property for the remote quantum sensing. Experimentally, the sample was illuminated for 1.5 s by a Gaussian beam with the waist radius = m. Therefore, to quantitatively analyse the electron polarization of pentacene molecules, we integrate the sample volume modelled as a cylinder (V) with the thickness = m and the radius = m. In the weak signal limit, signal contrast is approximately equal to
| (7) | ||||
where = 7 s is the lifetime of = +1, = 1.6210-3 nm-3 is the spin density of the sample, is a constant with the value 8.35 Gnm3 for pentacene spins (Note that the slope of is 2.53 MHz/G in the vicinity of 500 G, compared to gyromagnetic ratio 2.80 MHz/G for free electron spin giving nm3 in the Eqn. 2), and is the NV depth below the diamond surface. and are the spherical coordinates in the frame taking the position of NV as the original point and the direction of magnetic field as the z axis.
After integration of the sample volume, we curve-fit the data with Eqn. 7, giving the polarization , shown in Fig. 6 (a). Taking the uncertainties of , the radius and the thickness into consideration, we calculate the uncertainty of the polarization to be 0.01. The signal contrast decays with increasing the depth of NV owing to limited sample volume, unlike the case of infinite sample in Fig. 1(b). Larger polarzation can be achieved by increasing the 520nm-laser pulse duration. The PS signal is saturated with 4 s, indicating that the triplet manifold reaches equilibrium with the singlet state. A typical time s corresponding to the spin polarization of is obtained by curve fitting, as shown in Fig. 6(b). The saturated polarization at 4 s is (the detailed comparison with conventional ESR experimental results is described in Appendix A).
As we can see from Eq. 4, the sample thickness should be in the same order of magnitude or larger than the radius . This is not a vital limitation of our method but just a technical issue. Generally, samples are prepared by cutting (for solid sample) or by designing a container, e.g. microfluidic devices, with a proper shape (for liquid sample). Moreover, gradient magnetic field can also be applied to selectively pick up the desired shape for detection.

IV Conclusion
These investigations were devised to develop techniques that enable the polarization signal to be probed with long-range NV sensing. Using the dipolar interactions of the NV center and a bulk magnetization, this approach has been achieved. With this long-range sensing protocol, we have studied the dynamical properties of pentacene molecule in a single crystal indicating broad applications in chemistry, biology and material science. Boltzmann-polarised spin magnetisation can be probed with NV-ensemble sensors as well 9 . By manipulating NV sensors with different depths, we can vary the detection range of length scale from several hundred nanometers to ten microns to realize (sub-)cellular-sized magnetic resonance. With the improvement of polarization via hyperpolarization method, our approach can enable the applications of mesoscopic nuclear magnetic resonance spectroscopy and imaging at ambient conditions.
Acknowledgments
The authors thank Chang Gan Zeng for their help on the sample preparation, Haoli Zhang for useful discussion. This work is supported by the 973 Program (Grants No. 2013CB921800, No. 2016YFA0502400), the National Natural Science Foundation of China (Grants No. 11227901, No. 31470835, No. 91636217 and No. 11722544), the CAS (Grants No. XDB01030400 and No. QYZDY-SSW-SLH004, No. YIPA2015370), the CEBioM, and the Fundamental Research Funds for the Central Universities (WK2340000064), the An Hui Natural Science Foundation (Grants No. 1708085MA22).
T. X, and F. S. contributed equally to this work.
Appendix A Comparison with conventional ESR experiment
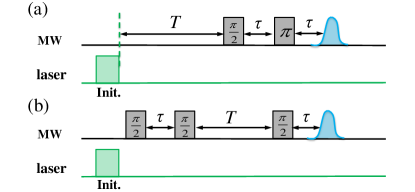
Our measurements of two decay times and reasonably agree with those of conventional ESR experiments. The decay time can be measured with two-pulse echo experiment the time between the /2 and pulses is fixed, and the time delay between the laser pulse and the first microwave pulse T increases by steps, as shown in Fig. 7(a). The time between the /2 and microwave pulses was fixed at 1.25 s. The result is shown in ref. 7 , Fig. 2 (297 K) (about 30 s), while in our work it is 23 s. The decay time can be measured with three-pulse (/2, /2, /2) ESEEM where the time delay between the second and third pulses T increases by steps, as shown in Fig. 7(b). The first /2 pulse occurred 1 s after the laser pulse. The fixed delay time s. The data is shown in ref. 6 , Fig. 8(b) (about 15 s), while in our work it is 7 s. All the experiments performed in conventional ESR are above 3000 G while our experiments are performed at 500 G, and the pentacene density is also different from our sample. These differences may cause the difference between our results and conventional ESR experiments.
In terms of polarization, the following factors may lead to the fact that the polarization () we measured is below the previous work (). First, the laser pulse intensity in our experiment is at least two orders smaller than that in previous work, which renders polarization process so slow that it decays into singlet state. Second, as we mentioned in the text, strong transverse component of the ZFS mixes strongly spin sublevels and at the magnetic field of G. Therefore, the population distribution is different from that in the previous work.
References
- (1) H. J. Mamin, M. Kim, M. H. Sherwood, C. T. Rettner, K. Ohno, D. D. Awschalom, D. Rugar, Science 339, 557 (2013).
- (2) T. Staudacher, F. Shi, S. Pezzagna, J. Meijer, J. Du, C. A. Meriles, F. Reinhard, J. Wrachtrup, Science 339, 561 (2013).
- (3) N. Aslam, M. Pfender, P. Neumann, R. Reuter, A. Zappe, F. F. de Oliveira, A. Denisenko, H. Sumiya, S. Onoda, J. Isoya, J. Wrachtrup, Science 10, 1126 (2017).
- (4) F. Shi, Q. Zhang, P. Wang, H. Sun, J. Wang, X. Rong, M. Chen, C. Ju, F. Reinhard, H. Chen, J. Wrachtrup, J. Wang, J. Du, Science 347, 6226 (2015).
- (5) I. Lovchinsky, A. O. Sushkov, E. Urbach, N. P. de Leon, S. Choi, K. De Greve, R. Evans, R. Gertner, E. Bersin, C. Müller, L. McGuinness, F. Jelezko, R. L. Walsworth, H. Park, M. D. Lukin, Science 351, 6275 (2016).
- (6) K. Tateishi, M. Negoro, S. Nishida, A. Kagawa, Y. Morita, and M. Kitagawa, Proc. Natl. Acad. Sci. USA 111, 7527 (2014).
- (7) C. Griesinger, M. Bennati, H. M. Vieth, C. Luchinat, G. Parigi, P. Höfer, F. Engelke, S. J. Glaser, V. Denysenkov, T. F. Prisner, Prog. Nucl. Magn. Reson. Spectrosc. 64, 4 (2012).
- (8) J. H. Ardenkjaer-Larsen, B. Fridlund, A. Gram, G. Hansson, L. Hansson, M. H. Lerche, R. Servin, M. Thaning, and K. Golman., Proc. Natl. Acad. Sci. USA 100, 10158 (2003).
- (9) D. Gajan, A. Bornet, B. Vuichoud, J. Milani, R. Melzi, H. A. van Kalkeren, L. Veyre, C. Thieuleux, M. P. Conley, W. R. Grüning, M. Schwarzwälder, A. Lesage, C. Coperet, G. Bodenhausen, L. Emsley, and S. Jannin., Proc. Natl. Acad. Sci. USA 111, 14693 (2014).
- (10) B. Meier, J. N. Dumez, G. Stevanato, J. T. Hill-Cousins, S. S. Roy, P. Hakansson, S. Mamone, R. C. D. Brown, G. Pileio, M. H. Levitt., J. Am. Chem. Soc. 135, 18746 (2013).
- (11) S. S. Roy, J. N. Dumez, G. Stevanato, B. Meier, J. T. Hill-Cousins, R. C. D. Brown, G. Pileio, and M. H. Levitt., J. Magn. Reson. 250, 25 (2015).
- (12) F. G. Patterson, H. W. H. Lee, W. L. Wilson, and M. D. Fayer, Chem. Phys. 84, 51 (1984).
- (13) J. L. Ong, D. J. Sloop, T. S. Lin, Chem. Phys. Lett. 241, 540 (1995).
- (14) D. J. Sloop, H. Yu, T. Lin, S. I. Weissman, J. Chem. Phys. 75, 3746 (1981).
- (15) H. M. Rietveld, E. N. Maslen, C.J. B. Clews, Acta Cryst. B26, 693 (1970).
- (16) J. L. Ong, D. J. Sloop, T. S. Lin, J. Phys. Chem. 97, 7833 (1993).
- (17) D. R. Glenn, D. B. Bucher, J. Lee, M. D. Lukin, H. Park, R. L. Walsworth, Nature 555, 351 (2018).