782-0436 Macul, Santiago, Chile 22institutetext: Millennium Institute of Astrophysics, Santiago, Chile 33institutetext: Centro de Astro-Ingeniería, Pontificia Universidad Católica de Chile, Santiago, Chile 44institutetext: Unidad de Astronomía, Facultad Cs. Básicas, Universidad de Antofagasta, Av. U. de Antofagasta 02800, Antofagasta, Chile 55institutetext: Astronomisches Rechen-Institut, Zentrum für Astronomie der Universität Heidelberg, Mönchhofstr. 12-14, 69120 Heidelberg, Germany 66institutetext: Departamento de Fisica, Facultad de Ciencias Exactas, Universidad Andres Bello, Av. Fernandez Concha 700, Las Condes, Santiago, Chile 77institutetext: Vatican Observatory, V00120 Vatican City State, Italy
Pulsating stars in Centauri:
Abstract
Centauri (NGC 5139) contains many variable stars of different types, including the pulsating type II Cepheids, RR Lyrae and SX Phoenicis stars. We carried out a deep, wide-field, near-infrared (IR) variability survey of Cen, using the VISTA telescope. We assembled an unprecedented homogeneous and complete and near-IR catalog of variable stars in the field of Cen. In this paper we compare optical and near-IR light curves of RR Lyrae stars, emphasizing the main differences. Moreover, we discuss the ability of near-IR observations to detect SX Phoenicis stars given the fact that the amplitudes are much smaller in these bands compared to the optical. Finally, we consider the case in which all the pulsating stars in the three different variability types follow a single period-luminosity relation in the near-IR bands.
1 Introduction
In the near-infrared (IR) bands, the study of variable stars has some advantages compared to the optical: i) the period-luminosity (PL) relations have lower internal dispersions (Longmore90 ; Catelan04 ), leading to more precise distance determinations; ii) the interstellar extinction is lower (for the band, the extinction is one tenth of the extinction in the band); and iii) pulsating stars tend to have smaller amplitudes, leading to better constrained mean magnitudes with a smaller number of epochs.
Despite these advantages, only a handful of wide-field time-series surveys are devoted to near-IR bands. Two ongoing near-IR variability surveys are the Vista Variables in the Vía Láctea (VVV) ESO Public Survey, which acquired time-resolved data (in the band) in highly extinct regions of the Galaxy, at low Galactic latitudes (see, e.g., Minniti10 ; Catelan2013 ), and the VISTA survey of the Magellanic Cloud system (VMC; e.g., Cioni2011 ; Ripepi2014 ; Ripepi2016 ). A detailed review of the time-series surveys in the near-IR is presented by Matsunaga17 in these proceedings.
In this present scenario, Centauri (NGC 5139) is an excellent laboratory to study pulsation properties in the near-IR bands since it hosts a large and rich variable star content, previously well studied using optical observations. In particular, the cluster has at least 180 RR Lyrae (RRL) stars (Navarrete15 ); 74 SX Phoenicis (SX Phe), the greatest number found in a globular cluster (Olech05 ; Weldrake07 ); and seven type II Cepheids (T2Cs), among others variability types.
2 Observations
Near-IR images of Cen were taken using the VISTA 4.1m telescope, at ESO Paranal Observatory Emerson10 . 42 and 100 images in and , respectively, were collected. The details of the observations and data reduction have been previously explained in Navarrete15 . Point-spread function (PSF) photometry was derived using the DAOPHOT II/ALLFRAME package (Stetson87 ; Stetson94 ) for the innermost ten arcminutes region of the cluster, while the DoPhot package (Schechter93 ; Javier12 ) was preferred to derive PSF photometry in the outer regions.
From the observations, the intensity-average mean magnitudes for 278 previously known pulsating stars were recovered. Of them, the variability (i.e., sinusoidal light curve for the given period) was recovered for 209 pulsating stars. The 69 stars previously known to be variables (Kaluzny04 ; Weldrake07 ), but without signs of variability in the near-IR, include a subsample of low-amplitude, c-type RRL (RRc) stars, in addition to most of the SX Phe stars that are known to be present in the cluster field.
3 Near-IR and visible light curves of Cen RR Lyrae stars
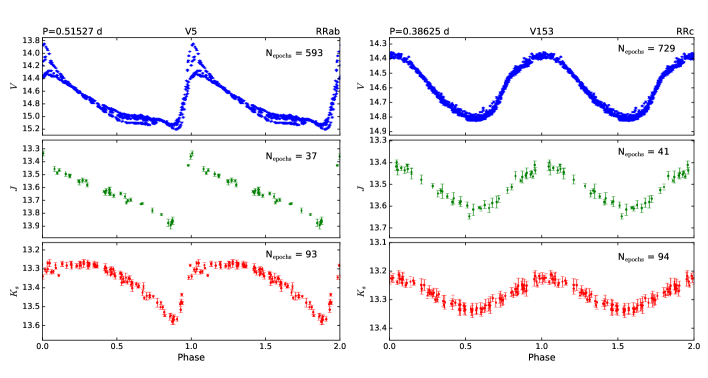
Considering the extensive optical study of variable stars in the cluster by Kaluzny04 , the amplitudes and light curve shapes in and the near-IR bands and can be directly compared. Figure 1 shows the light curves in (top), (middle) and (bottom) for one ab-type RRL (RRab, left) and one RRc star (right). The light curves in are from the study of Kaluzny04 . Each panel shows, at the top right, the number of epochs in each light curve. From the figure, some striking differences can be noticed. First of all, the Blazhko effect that is evident in the -band light curve of the RRab variable (V5, upper left panel) is not distinguishable in the near-IR light curves. This is the case for all the known Blazhko RRab stars in the cluster (Navarrete15 ). Even though the resulting amplitude modulation is too small to be recovered in our near-IR light curves, Sollima08 reported increased scatter in their near-IR light curves of RR Lyr, which they attributed to the Blazhko effect. Second, the amplitudes in and are smaller than in the band. Navarrete15 provide relations to convert between , and magnitudes for RRL stars, and the decrease in the amplitudes from the visual to the IR is evident in their Figure 3. Finally, the light curve shape of RRab stars tends to be more sinusoidal as the light curve is observed with redder filters. The same effect is seen for RRc stars but the difference is less prominent, given their already nearly sinusoidal -band light curves. The different light curve shapes, as one moves from the visual regime to the near-IR, can be understood largely in terms of the reduced dependence of the emerging flux on the star’s temperature variations, as compared to the radius (cs15 , and references therein). The lack of distinctive features in the light curves is one of the difficulties facing the automated classification of variable stars in the near-IR (see, e.g., Angeloni14 ; Elorrieta16 ).
4 Variability amplitudes of SX Phoenicis stars
SX Phe stars typically have smaller variability amplitudes than RRL and T2Cs, and are thus more difficult to detect. Cen hosts 74 SX Phe, of which more than 45 have -band amplitudes mag. Using the and time series, the variability of only 12 of these SX Phe could be recovered. These 12 stars have the highest -amplitudes among all the SX Phe in the cluster, from 0.13 up to 0.31 mag (based on the minimum and maximum magnitudes reported by Kaluzny04 ). For the remaining SX Phe stars, the variability amplitudes are too small and, therefore, the light curves look indistinguishable from those of non-variable stars.
The amplitude distribution in , , and for the SX Phe stars with recovered variability in the near-IR is shown in Figure 2. In this figure, and also in Figure 3, we include only those 7 stars for which we were able to retrieve the corresponding -band data (from Kaluzny04 ). For these 7 stars, we re-derived the -band amplitudes in a manner consistent with the technique that was used to obtain the near-IR amplitudes. As can be seen, most of the amplitudes in tend to be mag, while their respective amplitudes are mag. These small amplitude values make the detection of SX Phe stars on the basis solely of near-IR observations harder. Only high-amplitude pulsators are likely to be found, at least at the magnitude level of mag. This group of SX Phe pulsators corresponds to a small fraction of the distribution of amplitudes found for this variability type (see, e.g., Rodriguez00 ). Efforts have been made to collect near-IR light curves for SX Phe stars in the field as well as in some clusters (see, e.g., Angeloni14 ), again recovering only high-amplitude pulsators.

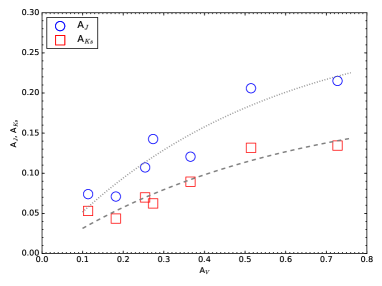
A comparison between the resulting , , values is shown in Figure 3. The lines overplotted on this diagram correspond to best-fit relations of the following forms:
| (1a) | ||||
| (1b) | ||||
which are valid for visual amplitudes in the range mag.
5 Near-IR period-luminosity relations
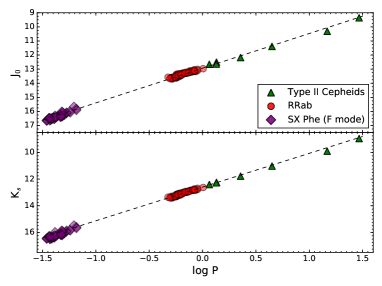
It has been suggested that the PL relations for T2Cs and RRL can be seen as a single relation, with nearly the same slope and zero points, at least in the near-IR, extending from periods shorter than 1 day up to days (see, e.g., Matsunaga06 ; Feast11 ; Navarrete17 ). At least to first order, this may plausibly also extend to the SX Phe regime (e.g., dm10 ; cs15 , and references therein). Here we revisit this possibility, using our sample of T2Cs, RRab and (candidate) fundamental-mode SX Phe stars from Navarrete17 .
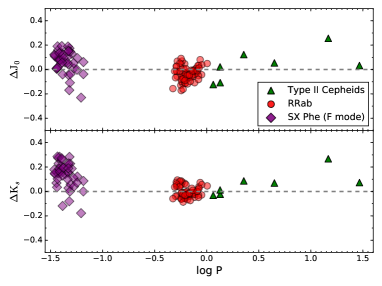
The left panels of Figure 4 show the (in days) and extinction-corrected (top) and (bottom) magnitudes and the least-squares fit recovered from the data (dashed lines). Despite the fact that the data largely conform to a straight line, resembling a single PL relation for all the aforementioned variability types, small differences are found, mostly in the longest- and shortest-period regimes. In the right panels of the figure, the difference between the observed and magnitudes (top and bottom panels, respectively) and the best fit to the data is presented. It is clear that the SX Phe stars tend to deviate the most from the relation, suggesting a non-negligible difference in slope between their PL relation and the one for RRL stars. The same is found for the longest-period T2Cs (W Virginis and RV Tauri sub-types). RRab stars present very small deviations from the fit ( mag), in spite of the fact that its well-known metallicity dependence (Navarrete17 ) was not corrected for when producing this plot.
| Ref. | ||||
| T2Cs | 0 | Matsunaga06 | ||
| RRL | Navarrete17 | |||
| SX Phe | 0 | Navarrete17 | ||
| T2Cs+RRL2 | 0 | This work | ||
| All types2 | 0 | This work | ||
| Ref. | ||||
| T2Cs | 0 | Matsunaga06 | ||
| RRL | Navarrete17 | |||
| SX Phe | 0 | Navarrete17 | ||
| T2Cs+RRL2 | 0 | This work | ||
| All types2 | 0 | This work |
1 In the form , where corresponds to the bandpass.
2 Adopting mag for Cen (from Navarrete17 ).
The slopes of the fits can be compared with the recently derived PL and PL relations for SX Phe and RRL stars, respectively, as obtained by Navarrete17 using the same data. For T2Cs, no such relations were derived, since the cluster hosts only seven such stars. Table 1 shows the coefficients of the PL relations for the different variability types (from Matsunaga06 and Navarrete17 ), as well as the slopes derived in this paper simultaneously using the three variability types and when only T2Cs and RRL are considered. There is much better agreement among the different slope values when SX Phe stars are excluded from the fits. This was already evident from Figure 4 in which SX Phe stars are those with the highest deviations from the fit. Reassuringly, the slope values are closer when the band is considered, suggesting that in fact T2Cs and RRL could indeed share a common PL relation, at least in this bandpass.
Acknowledgments: Support for this project is provided by the Ministry for the Economy, Development, and Tourism’s Millennium Science Initiative through grant IC 120009, awarded to the Millennium Institute of Astrophysics (MAS); by the Basal Center for Astrophysics and Associated Technologies (CATA) through grant PFB-06/2007; by CONICYT’s PCI program through grant DPI20140066; and by FONDECYT grants #1141141 and #1171273 (C.N., M.C.), #1130196 (D.M.), #1150345 (F.G.), #3130320 (R.C.R.), and #11150916 (J.A.-G.). C.N. acknowledges additional support from CONICYT-PCHA/Doctorado Nacional 2015-21151643.
References
- (1) Alonso-García, J., Mateo, M., Sen, B., et al. AJ, 143, 70 (2012)
- (2) Angeloni, R., Contreras Ramos, R., Catelan, M., et al. A&A, 567, 100 (2014)
- (3) Catelan, M., Pritzl, B. J., & Smith, H. A., ApJS, 154, 633 (2004)
- (4) Catelan, M., Minniti, D., Lucas, P. W., et al., in 40 Years of Variable Stars: A Celebration of Contributions by Horace A. Smith, ed. K. Kinemuchi, C. A. Kuehn, N. De Lee, H. A. Smith, p. 139 (https://arxiv.org/abs/1310.1996) (2013)
- (5) Catelan, M., & Smith, H. A., Pulsating Stars (Wiley-VCH, Weinheim, 2015)
- (6) Cioni, M. -R. L., Clementini, G., Girardi, L., et al. A&A, 527, 116 (2011)
- (7) Elorrieta, F., Eyheramendy, S., Jordán, A., et al. A&A, 595, 82 (2016)
- (8) Emerson, J. P., & Sutherland, W. J., in Ground-based and Airborne Telescopes III., SPIE Conf. Ser., Vol. 7733, ed. Stepp, L. M., Gilmozzi, R., Hall, H. J. (2010)
- (9) Feast, M., in RR Lyrae Stars, Metal-Poor Stars, and the Galaxy, ed. A. McWilliam, Carnegie Observatory Astrophysics Series, 5, 170 (2011)
- (10) Longmore, A. J., Dixon, R., Skillen, I., et al., MNRAS, 247, 684 (1990)
- (11) Kaluzny, J., Olech, A., Thompson, I. B., et al., A&A, 424, 1101 (2004)
- (12) Majaess, D. J., JAAVSO, 38, 100
- (13) Matsunaga, N., Fukushi, H., Nakada, Y., et al., MNRAS, 370, 1979 (2006)
- (14) Matsunaga, N., preprint (https://arxiv.org/abs/1705.02547) (2017)
- (15) Minniti, D., Lucas, P. W., Emerson, J. P., et al., New Astron., 15, 433 (2010)
- (16) Navarrete, C., Contreras Ramos, R., Catelan, M., et al., A&A, 577, 99 (2015)
- (17) Navarrete, C., Catelan, M., Contreras Ramos, R., et al., A&A, in press (https://arxiv.org/abs/1704.0303) (2017)
- (18) Olech, A., Dziembowski, W. A., Pamyatnykh, A. A., et al., MNRAS, 363, 40 (2005)
- (19) Ripepi, V., Marconi, M., Moretti, M. I., et al., MNRAS, 437, 2307 (2014)
- (20) Ripepi, V., Marconi, M., Moretti, M. I., et al., ApJS, 224, 21 (2016)
- (21) Rodríguez, E., & López-González, M. J., A&A, 359, 597 (2000)
- (22) Schechter, P. L., Mateo, M., & Saha, A., PASP, 105, 1342 (1993)
- (23) Sollima, A., Cacciari, C., Arkharov, A. A. H., et al., MNRAS, 384, 1583 (2008)
- (24) Stetson, P. B., PASP, 99, 197 (1987)
- (25) Stetson, P. B., PASP, 106, 250 (1994)
- (26) Weldrake, D. T. F., Sackett, P. D., & Bridges, T. J., AJ, 133, 1447 (2007)