Anisotropic super-attenuation of capillary waves on driven glass interfaces
Abstract
Metrological AFM measurements are performed on the silica glass interfaces of photonic band-gap fibres and hollow capillaries. The freezing of attenuated out-of-equilibrium capillary waves during the drawing process is shown to result in a reduced surface roughness. The roughness attenuation with respect to the expected thermodynamical limit is determined to vary with the drawing stress following a power law. A striking anisotropic character of the height correlation is observed: glass surfaces thus retain a structural record of the direction of the flow to which the liquid was submitted.
What governs the structure of a glass surface? To very good approximation, the bulk structure of a vitreous material resembles a snapshot of the liquid before glass transition Zarzycki (1991). Similarly, the surface of a glass corresponds to the frozen liquid interface Jäckle and Kawazaki (1995), and can reveal frozen surface modes of this interface. Over a wide range of length scales, from the nanometer up to the millimeter range, the sub-nanometer roughness of a fire-polished glass surface results from the superposition of frozen thermal equilibrium capillary waves of the liquid Sarlat et al. (2006).
At equilibrium, capillary fluctuations of liquid interfaces originate from the interplay between thermal noise () and interface tension (), and result in a superposition of capillary waves. Height fluctuations scale as:
| (1) |
which equals 0.3-0.4 nm for most simple liquids. Liquid interfaces are thus extremely smooth.
Thermal interface fluctuations correspond to a lower bound of the interface width imposed by equilibrium thermodynamics. In this context, the application of any external field is usually expected to enhance the level of fluctuations. In the presence of a flow, amplification of capillary fluctuations typically gives rise to hydrodynamic instabilities Charru (2011). However recent results suggest that shear flow may in fact induce a non-linear attenuation of capillary waves Derks et al. (2006); Thiébaud and Bickel (2010); Thiébaud et al. (2014).
Here we present an accurate experimental characterization of such an attenuation of capillary fluctuations on glass surfaces. In particular, we show that a glass surface retains a structural record of the direction of the flow to which the liquid was submitted. Performing high precision Atomic Force Microscopy (AFM) roughness measurements on the inner glass interfaces of photonic band-gap fibres and hollow capillaries produced by fibre drawing, we show that driven glass interfaces result from the freezing of attenuated capillary waves. The roughness is strongly anisotropic with an overall amplitude that presents a non-linear attenuation with respect to the expected equilibrium thermodynamic limit.
Measurements of capillary waves – Capillary fluctuations of liquid interfaces have long been difficult to measure experimentally Braslau et al. (1985, 1988); Sanyal et al. (1991) and direct optical observation could only be obtained through the use of a near critical colloid-polymer mixture characterized by an ultra-low interface tension Aarts et al. (2004). While it remains extremely challenging to characterize experimentally the full spatio-temporal spectrum of thermal capillary waves at liquid interfaces, it is however possible to restrict the scope of the study and to access quantitatively either the temporal or the spatial part of the interface fluctuations. Interferometer-based surface fluctuation specular reflection (SFSR) has recently allowed the frequency spectrum of thermal capillary waves to be probed on thin films Tay et al. (2008); Pottier et al. (2011).
Spatial fluctuations of liquid interfaces can be accessed in a very different context: glass surfaces. When cooled down from the liquid state through a glass transition, equilibrium thermal capillary waves suddenly get frozen in. The intrinsic roughness of glass surfaces thus directly results from the spatial fluctuations of capillary waves frozen at the glass transition temperature Jäckle and Kawazaki (1995). Thorough AFM measurements on glass surfaces can be used to quantitatively extract the surface structure factor associated with such frozen capillary waves Roberts et al. (2005); Sarlat et al. (2006):
| (2) |
where is the wave vector of the capillary waves, the Boltzmann constant and the interface tension.
The quantitative characterization of the roughness spectrum of glass interfaces has recently been the subject of a growing interest in the context of the development of Hollow-Core Photonic Band-Gap Fibres (HC-PBGF) Roberts et al. (2005); Phan-Huy et al. (2009); Brun et al. (2014); Buet et al. (2016). In such microstructured fibres, light propagates through air within the hollow core and the ultimate losses are expected to be determined by the scattering from the inner interfaces of the fibre Fokoua et al. (2012).
In the following, we first report AFM measurements on inner silica glass interfaces of HC-PBGFs SI . Inner surfaces were chosen because they are protected from contaminants and directly interact with light propagating within such fibres, which make them particularly important in the context of HC-PBGFs. They show significantly lower roughness levels than the expected lower bound, i.e. frozen capillary waves obtained on the surface of the same amorphous material before drawing. Moreover, the surface roughness appears to be highly anisotropic.
By analogy with liquid interfaces under shear flow, we then perform AFM measurements on the inner surfaces of hollow fibres obtained in different drawing conditions and we provide evidence for a non-linear attenuation effect controlled by the viscous stress experienced by the fibres during drawing.
Attenuated frozen capillary waves on inner glass interfaces of Photonic Band Gap Fibres – Surface roughness was measured on the core interface of a 37 cell HC-PBGF. Optical fibres were obtained using a two-step stack and draw process Poletti et al. (2013); Buet et al. (2016). In a first step, cylindrical fused silica capillaries of millimetric diameter were stacked in a triangular lattice with 37 capillaries omitted to form the inner hollow core. The assembly was then drawn into m lengths cane of a few mm diameter. In a second step, the cane was inserted into a sleeve jacket and the assembly drawn down to optical fiber dimensions with a diameter of the order of 100 m.
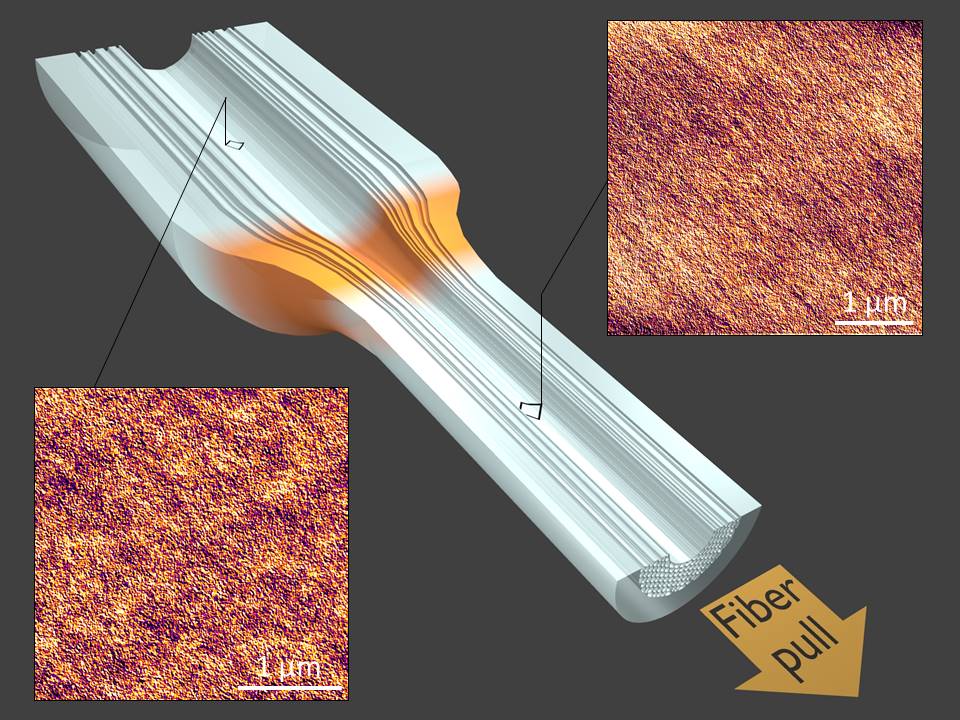
As illustrated in Fig. 1, during the drawing process of the centimetric diameter preform into a fibre, the silica glass is heated up to about 2000∘C in a furnace where it reaches the liquid state and flows under the action of a pulling force, before experiencing a sudden quench to below the glass transition temperature as it exits the furnace. Out-of-equilibrium capillary fluctuations are thus frozen on the air/glass interfaces of the fibre microstructure. Insets in Fig. 1 illustrate the surface roughness on the inner surface of the final drawn hollow core and of the fire polished silica glass preform, which is representative of the surface of the same glass before the drawing.
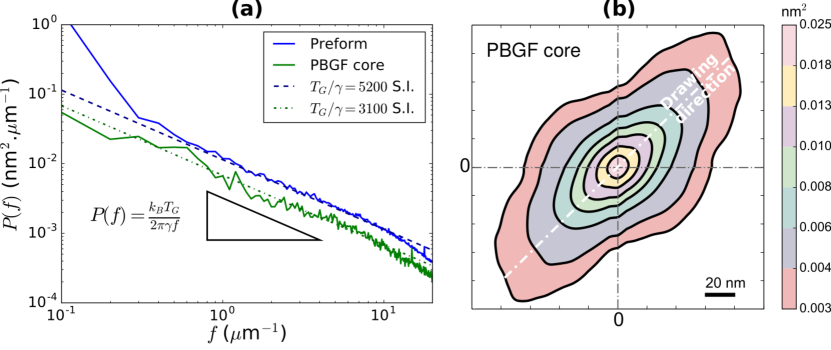
The 1D power spectral density (PSD) along the drawing direction and the 2D height correlation function extracted from these AFM roughness measurements are shown in Fig. 2. Concerning the frozen equilibrium capillary waves of the preform, the theoretical expression for the PSD for 1D extracted profiles can be derived from the eq. (2) as:
| (3) |
where is the spatial frequency. Here we assume a sudden freezing of liquid capillary waves at glass transition. As illustrated in Fig. 2a, the predicted behavior is clearly evidenced in our measurements, and , for the preform, the prefactor is also in excellent agreement with the expected value for silica glass (, )Sarlat et al. (2006). Surprisingly, while the same behavior also applies to the out-of-equilibrium surfaces of the PBGF fibres, the prefactor is found to be two times smaller along the drawing direction. Since the latter controls the final roughness amplitude, this directly implies that the roughness of the innner interfaces of the fibre is about lower than predictions based on thermodynamic noise (at the glass transition temperature , i.e. in the supercooled state just before freezing), which are usually expected to represent a lower bound.
Another striking feature of the roughness of the PBGF interfaces, illustrated in Fig. 1, is a marked anisotropy. In Fig. 2b, we give a more quantitative support to this observation: the 2D height autocorrelation functions obtained for the PBGF fibre interfaces are clearly anisotropic with longer range correlations along the drawing direction.
Non-linear smoothing of driven glass interfaces – The presence of anisotropic correlations provides strong evidence of an out-of-equilibrium character of the interfaces in the supercooled regime before freezing at the glass transition. Thiébaud and Bickel Thiébaud and Bickel (2010) recently proposed a stochastic hydrodynamic perturbative model of liquid interface under shear flow that predicts attenuation of the capillary modes in the direction of the flow depending on the viscous stress at the interface:
| (4) |
Here, stands for the structure factor of the surface in the presence of a shear rate ( gives the angle from the flowing direction), while the prefactor is the equilibrium expression obtained at a temperature in the absence of flow. The parameter is a adimensioned shear rate and is a numerical constant Thiébaud and Bickel (2010); Thiébaud et al. (2014) The roughness attenuation depends both on the control parameter and the direction relative to the flow. In the presence of a flow, the height fluctuations should thus be anisotropic.
The extensional flow of a silica melt under the high thermal gradient that exists during a fibre draw process is obviously far more complex than the shear flow discussed above. Still, numerical models Jasion et al. (2015) assuming a simple Newtonian behavior of the molten glass reproduce accurately the drawing process of microstructured fibres over a wide range of process parameters (temperature of the furnace, drawing velocity, internal gas pressure) and geometric parameters (air-filling fraction of the fibres). In particular, it appears that the glass membranes defining the microstructure experience high stress during drawing. Vitreous silica in the supercooled regime is indeed characterized by high values of the viscosity ( Pa.s in the furnace) and strain rates are of the order unity in the hot flowing region so that stress can reach hundreds of MPa.
In the context of an extensional flow, the dimensionless shear rate parameter defined above can be viewed as a ratio between an attenuation velocity due to stretching and the damping velocity of the capillary waves, i.e. a capillary number Thiébaud et al. (2014). This parameter can also rewrittent in terms of stress or interface tension: , i.e. the ratio of interface tension with an effective tension induced by the viscous stress acting across the equilibrium width of the liquid interface . This definition can be immediately generalized on dimensional grounds to build a control parameter characteristic of the drawing process: . Here is the glass surface roughness expected in the absence of drawing and is the maximum tensile stress experienced by the fibre during the drawing. Numerical modelling of according to Jasion et al. (2015) shows that the parameter can take significant values during the drawing process. This suggests that, against common belief Roberts et al. (2008), the drawing process may significantly lower the surface roughness within glass microstructured fibres.
Since the viscosity of glasses is strongly dependent on temperature, a change of temperature is expected to induce a large the variation of the viscous stress, hence of the parameter . Therefore, a series of model fibres (hollow capillary tubes) were prepared under different drawing conditions. The furnace temperature was varied in the range [2000∘C-2100∘C] while the pulling rate and the geometry were kept constant. A fibre with an outer diameter of 220 m with = thickness of 15 m was obtained by applying a suitable pressure within the capillary during the draw.
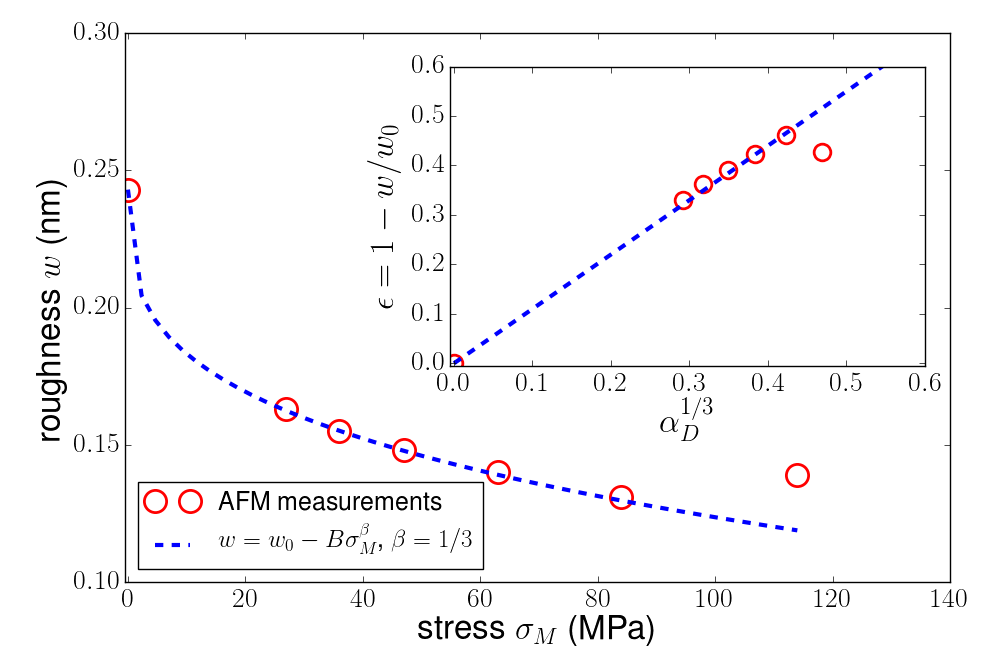
A series of AFM measurements () were performed on the inner surfaces of 6 different types of hollow capillary tubes obtained at different furnace temperatures. The results are summarized in Fig. 3 where we plot the RMS roughness (height standard deviation) measured over scanned areas of m m vs the drawing stress estimated from the numerical model of drawing Jasion et al. (2015) (see also Table S1 in S.I.). Just as for PBGFs, the surface roughness lies well below that of our reference fire polished preform (). Moreover, the roughness appears to decrease as a power law of the drawing stress with an exponent close to , as emphasized in the inset of Fig. 3 where the roughness reduction is plotted as a function of the cubic root of the dimensionless stress .
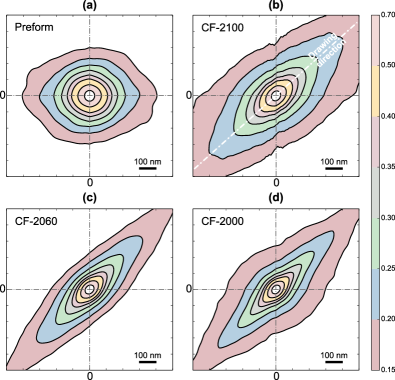
In addition to the roughness reduction, an evident anisotropic effect can again be identified from the above experiments. As shown on the 2D height correlation maps in Fig. 4, the larger , the more anisotropic the surface roughness. Beyond anisotropy, a stretching effect is also clearly noticed on the 2D correlation functions: the larger , the more diamond-like the level lines. Note here that in order to eliminate any bias due to the intrinsic anisotropy of the instrument, AFM measurements were performed along directions at relative to the drawing direction as justified by an extensive metrological investigation reported in the Suppemental Material SI .
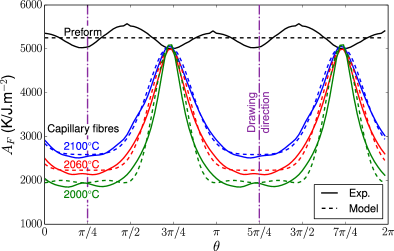
Owing to the easier access to the inner surfaces in the capillary fibres with respect to the PBGFs, a fuller range of AFM measurements could be performed and a full quantitative characterization of the two-dimensional surface roughness spectrum was obtained SI . The scaling behaviour expected for frozen capillary waves was again obtained, but with an angular dependent prefactor :
| (5) |
As shown in Fig. 5, the prefactor which can be seen as an effective value of the ratio is systematically lower when measured along the drawing direction than in the azimuthal direction. The observed anisotropy is such that it can not be described with the simple first order perturbative expansion given by eq. (4).
Non-linear effects could be captured by accounting for a simple non-linear transformation of the polar angle: . The use of this sine circle map that either contracts or expands the angular metrics depending on the orientation thus enables us to propose a simple analytic expression accounting for the measured surface structure factor of anisotropic frozen capillary waves:
| (6) |
Conclusion – Glass surfaces obtained by drawing thus consist of a superposition of frozen attenuated capillary waves. They result from two successive out-of-equilibrium processes: i) the non-linear attenuation of thermal capillary waves in the stretched liquid phase; ii) the freezing of these attenuated fluctuations when the liquid is quenched through the glass transition. Owing to the combination of these two mechanisms, glass surfaces can retain a memory of the flow direction in the liquid state.
The existence of such anisotropic fluctuations has previously been observed and discussed for critical systems Beysens et al. (1979); Onuki and Kawasaki (1979); Smith et al. (2008), but never observed to our knowledge in the framework of standard hydrodynamics.
While we report here evidence of a dramatic effect of a flow on the structure of a silica glass surface, early studies were mostly focussed on the effect of the stretch rate on the bulk structure of silicate glasses Takamori and Tomozawa (1976); Stebbins et al. (1989). Note here that unlike the case of polymers, a flow-induced anisotropy in the structure of amorphous silica can not result in the long range alignment of (here absent) chain-like structures Miller et al. (1973). Recent experimental and numerical results seem to confirm the emergence of a flow-induced structural anisotropy, but limited to the molecular scale Rountree et al. (2009); Wu et al. (2009); Sato et al. (2013) that is far smaller than the scale range of frozen capillary waves reported here.
Finally, the possibility to decrease the surface roughness below the expected lower bound with a fine tuning of the drawing condition is obviously of great interest in the context of the development of photonic band-gap fibres. Moreover, the quantitative characterization of the non-linear roughness spectrum of the inner interfaces of PBGF should pave the way toward a rigorous computation of scattering losses.
Acknowledgements – This work was supported by the EU 7th Framework Program under grant agreement 228033 (MODE-GAP). FP and DJR acknowledge the support of the Royal Society. XB acknowledges the support of Programme DIM OxyMORE, Ile de France. The authors acknowledge Naveen K. Baddela and John Hayes for fabricating the 37 cell HC-PBGF. BB and DV acknowledge Jean-Thomas Fonné, E. Gouillart and Hervé Montigaud at Laboratoire SVI (CNRS/Saint-Gobain) where part of the AFM Measurements were performed.
References
- Zarzycki (1991) J. Zarzycki, Glasses and the vitreous state (Cambridge Univ. Press, 1991).
- Jäckle and Kawazaki (1995) J. Jäckle and K. Kawazaki, J. Phys. Cond. Matt. 7, 4351 (1995).
- Sarlat et al. (2006) T. Sarlat, A. Lelarge, E. Søndergård, and D. Vandembroucq, Eur. Phys. J. B 54, 121 (2006).
- Charru (2011) F. Charru, Hydrodynamic Instabilities (Cambridge Univ. Press, 2011).
- Derks et al. (2006) D. Derks, D. G. A. L. Aarts, D. Bonn, H. N. W. Lekkerkerker, and A. Imhof, Phys. Rev. Lett. 97, 038301 (2006).
- Thiébaud and Bickel (2010) M. Thiébaud and T. Bickel, Phys. Rev. E 81, 031602 (2010).
- Thiébaud et al. (2014) M. Thiébaud, Y. Amarouchene, and T. Bickel, J. Stat. Mech. Th. Exp. (2014), 10.1088/1742-5468/2014/12/P12011.
- Braslau et al. (1985) A. Braslau, M. Deutsch, P. S. Pershan, A. H. Weiss, J. Als-Nielsen, and J. Bohr, Phys. Rev. Lett. 54, 114 (1985).
- Braslau et al. (1988) A. Braslau, P. S. Pershan, G. Swislow, B. M. Ocko, and J. Als-Nielsen, Phys. Rev. A 38, 2457 (1988).
- Sanyal et al. (1991) M. K. Sanyal, S. K. Sinha, K. G. Huang, and B. M. Ocko, Phys. Rev. Lett. 66, 628 (1991).
- Aarts et al. (2004) D. G. A. L. Aarts, M. Schmidt, and H. N. W. Lekkerkerker, Science 304, 847 (2004).
- Tay et al. (2008) A. Tay, C. Thibierge, D. Fournier, C. Fretigny, F. Lequeux, C. Monteux, J. P. Roger, and L. Talini, Rev. Sci. Inst. 79 (2008), 10.1063/1.3002424.
- Pottier et al. (2011) B. Pottier, G. Ducouret, C. Fretigny, F. Lequeux, and L. Talini, Soft Mat. 7, 7843 (2011).
- Roberts et al. (2005) P. J. Roberts, F. Couny, H. Sabert, B. J. Mangan, D. P. Williams, L. Farr, M. W. Mason, A. Tomlinson, T. A. Birks, J. C. Knight, and P. S. Russell, Optics Express 13, 237 (2005).
- Phan-Huy et al. (2009) M. C. Phan-Huy, J. M. Moison, J. A. Levenson, S. Richard, G. Mélin, M. Douay, and Y. Quiquempois, J. Lightwave Technol. 27, 1597 (2009).
- Brun et al. (2014) C. Brun, X. Buet, B. Bresson, M. S. Capelle, M. Ciccotti, A. Ghomari, P. Lecomte, J. P. Roger, F. Poletti, D. J. R. M. Petrovich, D. Vandembroucq, and G. Tessier, Opt. Express 22, 029554 (2014).
- Buet et al. (2016) X. Buet, C. Brun, B. Bresson, J. Gâteau, S. Sandoghchi, E. N. Fokoua, F. Poletti, D. J. R. M. Petrovich, D. Vandembroucq, and G. Tessier, Opt. Lett. 41, 5086 (2016).
- Fokoua et al. (2012) E. N. Fokoua, F. Poletti, and D. J. Richardson, Opt. Exp. 20, 20980 (2012).
- (19) See Supplemental Material at http://www.SI-address for technical details on the fabrication of fibres and on the AFM measurements.
- Poletti et al. (2013) F. Poletti, M. N. Petrovich, and D. J. Richardson, Nanophotonics 2, 315 (2013).
- Jasion et al. (2015) G. T. Jasion, J. S. Shrimpton, Y. Chen, Bradley, D. J. Richardson, and F. Poletti, Opt. Express 23, 312 (2015).
- Roberts et al. (2008) J. Roberts, H. Sabert, B. J. Mangane, and L. Farr, “Hollow core optical fiber and making same,” US Patent (2008), US 7, 366,388 B2.
- Beysens et al. (1979) D. Beysens, M. Gbadamassi, and L. Boyer, Phys. Rev. Lett. 43, 1253 (1979).
- Onuki and Kawasaki (1979) A. Onuki and K. Kawasaki, Ann. Phys. 121, 456 (1979).
- Smith et al. (2008) T. H. R. Smith, O. Vasilyev, D. B. Abraham, A. Maciolek, and M. Schmidt, Phys. Rev. Lett. 101, 067203 (2008).
- Takamori and Tomozawa (1976) T. Takamori and M. Tomozawa, J. Am. Ceram. Soc. 59, 377 (1976).
- Stebbins et al. (1989) J. F. Stebbins, D. R. Spearing, and I. Farnan, J. Non-Cryst. Solids 110, 1 (1989).
- Miller et al. (1973) P. J. Miller, G. J. Exarhos, and W. M. R. Jr., J. Chem. Phys. 59, 2796 (1973).
- Rountree et al. (2009) C. L. Rountree, D. Vandembroucq, M. Talamali, E. Bouchaud, and S. Roux, Phys. Rev. Lett. 102, 195501 (2009).
- Wu et al. (2009) J. Wu, J. Deubener, J. F. Stebbins, L. Grygarova, H. Behrens, L. Wondraczek, and Y. Yue, J. Chem. Phys. 131, 104504 (2009).
- Sato et al. (2013) T. Sato, N. Funamori, and T. Yagi, J. Appl. Phys. 114, 103509 (2013).